Some reports are long and complex, which can make it difficult for readers to locate and use the information that they need. In these cases, you can add interactive features that help users to navigate and explore reports. Hyperlinks and tables of content offer different ways for a user to find information or drill down to more detailed data. Interactive chart features enable you to customize the data that a chart displays and provide links to additional information. To review information in a different format, a report user can export some or all of the data from a report.
You can create a hyperlink that links one report element to another element, either in the same report or in a different report. These links are commonly referred to as master-detail or drill-through links. A report, for example, can contain a summary listing with hyperlinks to detailed information. The report element that acts as the link is called the source report element. It must be a data, label, image, or chart element. The report element to which you link is called the target report element.
As an example, a report might contain all the sales for a company aggregated by region. Each region total could then be linked to the detailed sales transactions for that region. The transaction detail may reside in the same report or in a separate report, and if the detail report is separate, it can be a previously executed report or one that is run on demand when the link is traversed. Using a cached detail report can be useful when the report is very large or changes infrequently.
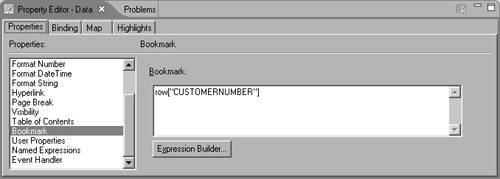
To create a link from one report element to another element in the same report, you use a bookmark and a hyperlink. First, you create a bookmark for the target report element. The bookmark can be text, such as “My Bookmark”, or an expression. For example, you can use row[“CUSTOMERNAME”] within a table to generate a dynamic bookmark for each customer in the table. Use the Bookmark property in the property editor to add the bookmark, as shown in Figure 22-1. You can type the expression in the text area or use the expression builder.
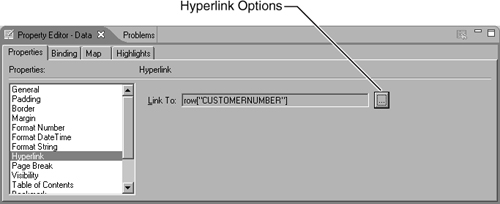
After you create the bookmark, you create a hyperlink for the source element. Include the bookmark or expression in the hyperlink expression for the source element. To create the hyperlink, you use the hyperlink property of the source report element. In the property editor, choose Hyperlink to display the hyperlink properties, as shown in Figure 22-2, then choose the Hyperlink Options button that is marked with an ellipsis.
When Hyperlink Options appears, use the settings shown in Figure 22-3 to create the link. Select Internal Bookmark for Hyperlink Type, which indicates you are linking two sections within the same report. Then select a bookmark from the drop-down list, which is automatically generated from all the bookmarks you created earlier.
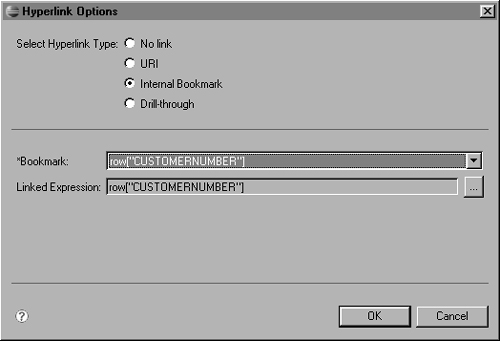
Linked Expression is populated with the bookmark you select. If you want to link to bookmarks conditionally, you may choose the Expression Builder button to enter script that changes the selected bookmark dynamically based on such things as parameters, sessions values, or data values.
For example, the details to which you link for each customer in a customer listing report may be different depending on the role of the person viewing the report. Someone in the sales department may need to drill to purchase order details, while someone in the shipping department may need to drill to bill of lading information. Adding script in the expression builder to change the bookmark based on user role accomplishes this result.
Creating a link from one report to a different report is very similar to creating a link between elements in the same report. Again, begin by creating a bookmark in the target report. Then use the hyperlink property to open Hyperlink Options and create a hyperlink in the source report. This type of hyperlink is called a drill-through link. After you create the bookmark in the target report, use the settings on Hyperlink Options, as shown in Figure 22-4, to create the hyperlink in the source report.
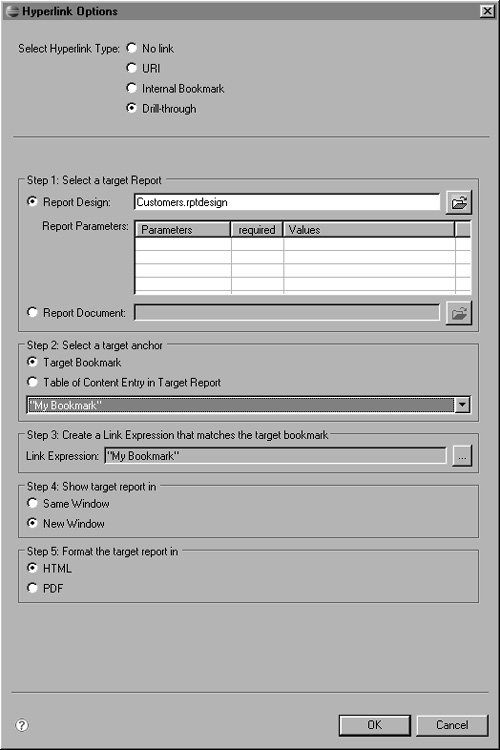
The most important difference between creating a link within the same report and creating a link to a different report is that the hyperlink expression must contain the name of the report file in which the target element resides when you link to a different report. On Hyperlink Options, you can type a file name or navigate to and select the correct file.
You must also indicate whether the target report opens in the same window or a new one, and whether it is formatted in HTML or PDF.
You can also use a report parameter with a hyperlink to open a customized version of a different report. The hyperlink expression takes a report parameter value and opens a version of the target report that is based on the parameter value. The value for the parameter that is passed to the target report can be set using the expression builder. If the parameter value is left blank and it is a required parameter, the report user is prompted for the value when the link is selected.
After you create the report parameter in the target report, use the settings on Hyperlink Options to create the link in the source report, as shown in Figure 22-5.
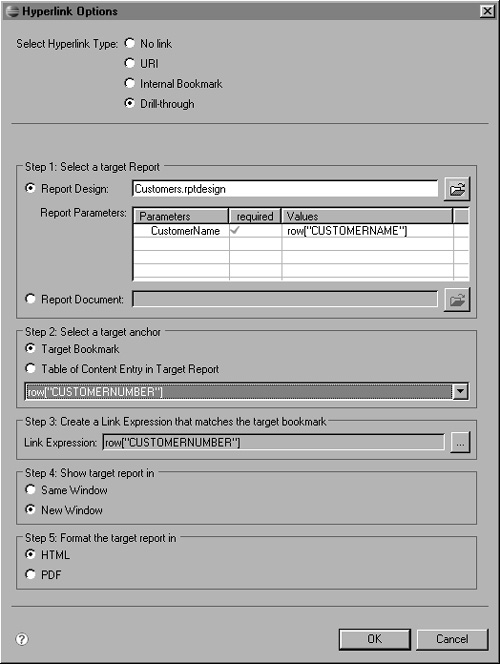
When the report user follows the link, the generated detail report displays the page where the target bookmark is found if the format is HTML. If the format is PDF, or if the bookmark entry is blank, the detail report opens at the first page.
An alternative to using a bookmark as a target anchor is using a table of contents entry in the target report. Building table of contents entries is described in a later section of this chapter.
It is also possible to link to a previously executed report. This task can be done by selecting Report Document instead of Report Design and entering a report document name with the .rptdocument extension.
You can use a hyperlink to open a document or a web page. These links provide users with easy access to additional sources of information, creating more interactive reports. You can, for example, use a link to:
This type of link uses a Uniform Resource Identifier (URI). You provide the document, image, or web page location on the hyperlink properties page, using the settings shown in Figure 22-6.
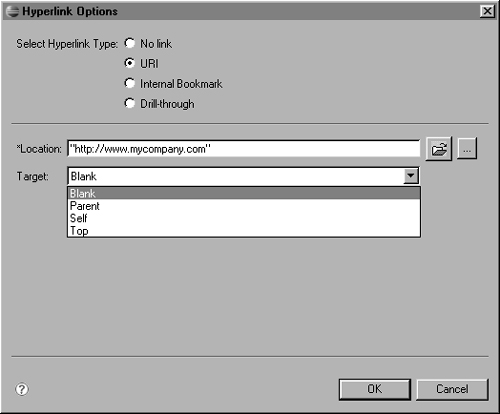
You must use a URI to specify the location, as shown in the following examples:
"http://www.mycompany.com"
"http://mysite.com/legal_notices/copyright.html"
"http://mysite.com/images/executives.jpg"
"file:/C:/copyright/statement.txt"
The quotation marks are required. You can type a URI, navigate to and select a file, or use the expression builder to create an expression that evaluates to a URI. Using the expression builder means that the URI is constructed dynamically, which is useful when the full URI is not known at design time or when the URI changes depending on data retrieved from a data source.
Target corresponds to a target attribute for an HTML anchor tag. For example, “Blank” opens the target in a new window.
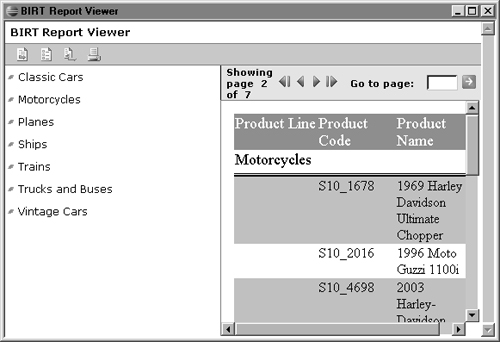
A table of contents allows large or congested reports to be more easily navigated by the report user. In the report viewer, the table of contents appears to the left of the report when you choose the table of contents button, and selecting any entry within the table of contents automatically loads the desired section of the report. When viewing the report in PDF format, the table of contents entries appear as bookmarks to the left of the report.
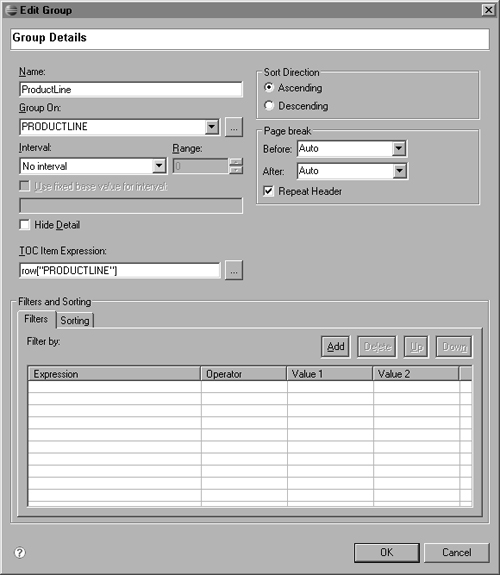
By default, a grouped report includes a table of contents that displays the group values. For example, if the group key is a data set field named PRODUCTLINE, the table of contents expression in the group editor is row[“PRODUCTLINE”], as shown in Figure 22-7.
In the report viewer, the table of contents lists all the values in the PRODUCTLINE field, as shown in Figure 22-8.
In some cases, you may not want the table of contents to display field values exactly as they are saved. For example, the values might be obscure. You can customize the table of contents expression to create a more informative table of contents entry. For example, to display a product name on a separate line after a product code, the TOC Item Expression in Edit Group would be:
   row["PRODUCTCODE"] + "
" + row["PRODUCTNAME"]
You can provide any valid JavaScript expression as a TOC Item Expression. For example, to show that a product is obsolete, you can check the value of the OBSOLETE database field, as shown in the following example:
if ( row["OBSOLETE"] == "yes" ) {
row["PRODUCTCODE"] + " (Obsolete)"
} else {
row["PRODUCTCODE"] + "
" + row["PRODUCTNAME"]
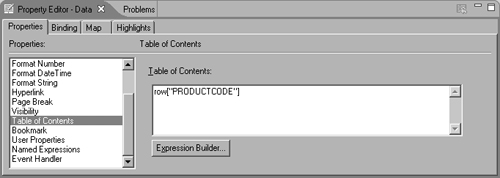
}Table of contents entries may also be nested to reflect the relationship of report elements. For example, you can add a nested table of contents to the report shown in Figure 22-8 to display product codes under each product line. To do so, select the [PRODUCTCODE] report data element and use Property Editor to add a Table of Contents property with the value row[“PRODUCTCODE”], as shown in Figure 22-9.
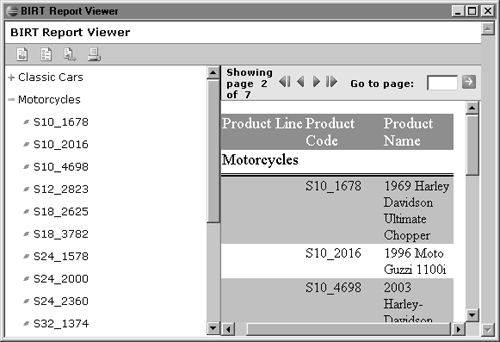
In the report viewer, the table of contents displays product codes within the product line entries, as shown in Figure 22-10.
To include a table of contents entry for other report elements, such as charts or images, you would also use Property Editor to add a Table of Contents property.
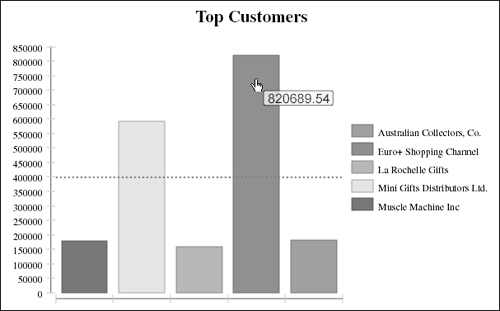
You can bookmark or link to a chart or include a chart in the table of contents, as described earlier in this chapter. You can also use additional interactive features to enhance the behavior of a chart in the report viewer. An interactive chart feature supports a response to an event, such as the report user choosing an item or moving the mouse pointer over an item. The response can trigger an action, such as opening a web page, drilling to a detail report, or changing the appearance of the chart. For example, you can use a ToolTip to display the series total when a user places the mouse over a bar in a bar chart, as shown in Figure 22-11.
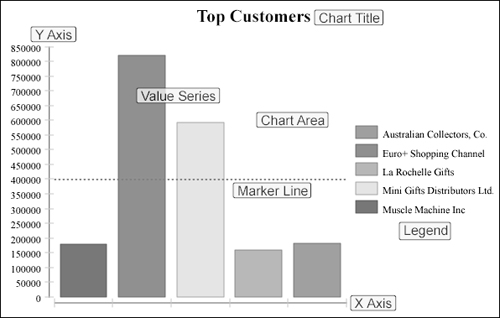
You can add an interactive feature to a value series, the chart area, the legend, marker lines, the x- and y-axis, or a title. These areas are illustrated in Figure 22-12.
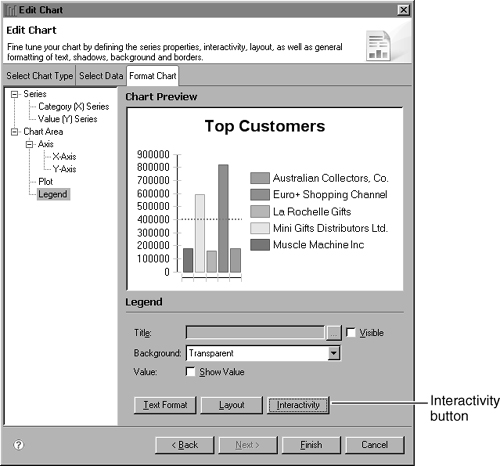
Start the process of adding interactivity to a chart by choosing Format Chart in the Chart Builder and selecting the chart element you wish to make interactive. Select the appropriate interactivity button, and the interactivity editor appears. Figure 22-13 shows the selection of the Interactivity button for a chart legend.
The location and name for the button to invoke the interactivity editor varies by chart element. Table 22-1 lists the procedure used to invoke the interactivity editor for each element. Not all chart types have all elements.
Table 22-1. Accessing chart interactivity options
Chart element | How to invoke the interactivity editor |
|---|---|
Chart Area | Choose Chart Area Interactivity on the Chart Area formatting page |
Chart Title | Choose Title Interactivity on the Chart Area formatting page |
Legend Area | Choose Interactivity on the Legend formatting page |
X-Axis and Y-Axis | Choose Interactivity on the X-Axis or the Y-Axis formatting page |
Marker | Choose Markers on the X-Axis or the Y-Axis formatting page. Axis Markers appears. Choose Interactivity. |
Value Series | Choose Interactivity on the Value Series |
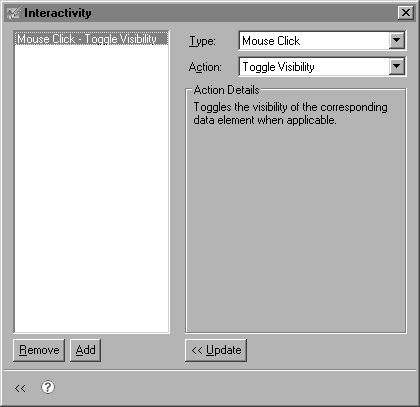
You specify the type of event that triggers interactivity for the selected chart element and indicate the action you wish to perform in Interactivity. For example, in a chart legend, you can use a mouse click to toggle the visibility of the associated data point. Figure 22-14 shows the event type and action in Interactivity required to accomplish this event.
There are a variety of event types that can be used to trigger interactivity. Table 22-2 lists the type options available in the interactivity editor, and describes the UI gesture associated with each.
Table 22-2. Event types
Event type | Description |
|---|---|
Mouse Click | Click the selected chart element. |
Mouse Double-Click | Double-click on the selected element. |
Mouse Down | Press and hold the mouse button down over the selected element. |
Mouse Up | Release the mouse button above the selected chart element. |
Mouse Over | Move the mouse pointer onto the selected element and leave it there. |
Mouse Move | Pass the mouse pointer over the selected element. |
Mouse Out | Move the mouse pointer off the selected element. |
Focus | Put UI focus on the selected element with the mouse or tab navigation. |
Blur | Remove UI focus from the selected element using either the mouse or tab navigation. |
Key Press | Press a key while the mouse pointer is over the selected element. |
Key Down | Press and hold a key down while the mouse pointer is over the selected element. |
Key Up | Release a key while the mouse pointer is over the selected element. |
Load | Load the chart in the viewer. |
Table 22-3 lists the action options associated with each event type in the interactivity editor. Not all actions are available in all chart output formats.
Table 22-3. Interactive features
Action name | Result | Available in |
|---|---|---|
URL Redirect | Sends the browser to a URL for a web page, a document, or an image. Also used to link to another report. | SVG, SWT, Swing, HTML |
Show ToolTip | Displays explanatory text over a chart element. | SVG, SWT, Swing, HTML |
Toggle Visibility | Changes the visibility of a chart element, typically a series. | SVG, SWT, Swing |
Invoke Script | Invokes a client-side script inside the viewer. | SVG, HTML |
Highlight | Highlights a chart element, such as a data point. | SVG, SWT, Swing |
Callback | Invokes a callback class. | SWT, Swing |
Toggle Data Point Visibility | Changes the visibility of a data point. | SVG, SWT, Swing |
After selecting the event type and associated action in Interactivity, choose Add. Remove an existing event type and action pair by selecting the pair and choosing Remove. To update, select an existing pair and select a new event type or action, then choose Update. You can add multiple interactive features to a chart element, but a particular event can produce only one action.
To use some interactive features, such as highlighting, the chart must be formatted in SVG rather than in an image file format, such as GIF or BMP. In addition, the report user must view the report in a browser that has an SVG plug-in and supports JavaScript. To see how an interactive feature works in a chart, you must preview the report in the report viewer.
One special type of interactivity involves linking a chart value series to a detailed listing of the associated data from the series in another report. To link a chart in this fashion, an event type and action pair must be added to the Value Series element in the interactivity editor. The event type can be set to any UI gesture, but is most often a mouse click, and the action must be set to URL Redirect.
For example, Figure 22-15 shows a URL redirect that has been set up on a bar chart illustrating sales by customer. When the report user clicks the bar associated with a particular customer’s sales, the URL redirect action triggers.
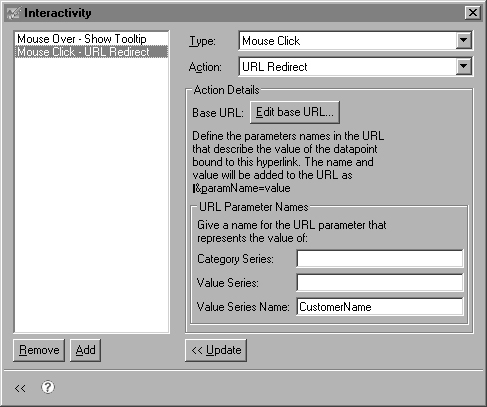
A URL redirect action on a value series relies upon the same hyperlink mechanism described earlier in the chapter. In particular, choosing Edit Base URL in Interactivity causes Hyperlink Options to appear to specify the target report and other details. The only difference is in the way that values needed for report parameters are passed. Chart data points can be used to populate report parameters, but because they cannot be accessed directly, you can associate them with the name of the report parameter by supplying the name of the parameter in the interactivity editor, next to the appropriate chart data point.
For example, in Figure 22-15, the value for the chart value series is passed as the report parameter CustomerName. If the report user were to click the bar for a customer named “Acme”, the customer would be appended to the target report hyperlink URL as &CustomerName=Acme, and the report would be generated with data associated only with Acme.
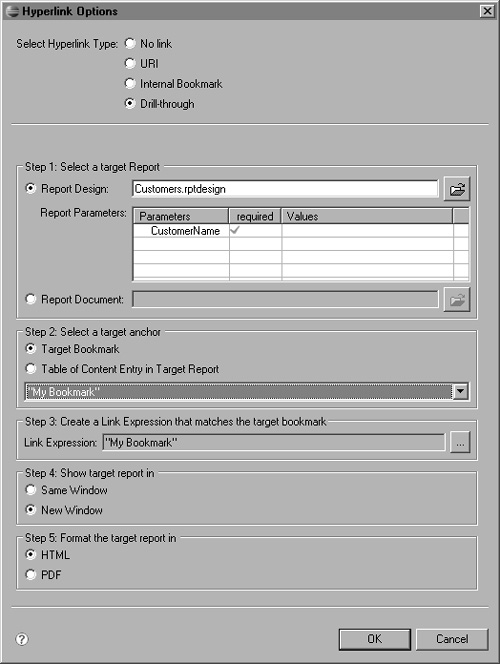
Figure 22-16 shows Hyperlink Options with the information required to invoke a drill-through link to the target report, Customers.rptdesign, including the required report parameter CustomerName.
You can export report data from the report viewer to a comma-separated values (.csv) file by choosing Export data. You can use Export data to quickly extract some or all of the data from a report, then you can use this data in another document or format. For example, you could export customer sales data from a report for a previous quarter, then use the numbers in a spreadsheet to create a forecast for an upcoming one.
How to export report data
In the report viewer, choose Export data, as shown in Figure 22-17.
When Export Data appears, select a result set from the drop-down list, then move the data that you want to export from Available Columns to Selected Columns. Figure 22-18 shows selected columns in Export Data.
Choose OK. File Download appears.
Choose Save, then choose Save As and indicate where to save the file.

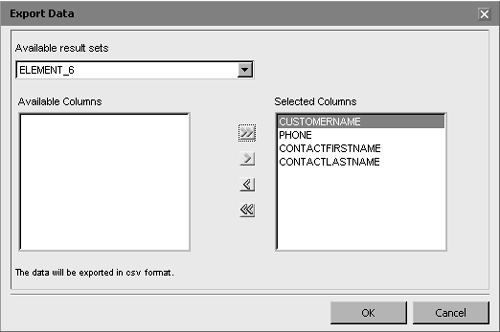
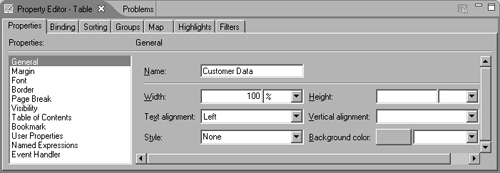
Available result sets in Export Data shown in Figure 22-18 lists the container elements that use data, such as tables, charts, and data elements. By default, the name that is displayed in the list is a derivative of the "ELEMENT" string, such as ELEMENT_10. To make it easier for report users to identify the section of the report they wish to export data from, you can give each report element a more meaningful name in Property Editor.
For example, to give a more meaningful name to the main table in a customer report, select the table in the layout editor, and update Name for the General property with “Customer Data”, as shown in Figure 22-19.