
Chapter 7. Views
Eclipse has so many different views and toolbars that it’s easy to get overwhelmed trying to decipher them all. Consider this part of the book to be your own personal secret decoder ring.
Breakpoints View
The Breakpoints view (in the Debug perspective) shows a list of all the breakpoints you have set in your projects. Use it to enable and disable breakpoints, edit their properties, and set exception breakpoints (which trigger a stop when a Java exception occurs). Table 9 lists the commands on the Breakpoints view toolbar.
|
Icon |
Description |
|
Remove the selected breakpoint(s). | |
|
Remove all breakpoints in all projects. | |
|
Show/hide breakpoints not valid in the selected remote debug target (toggle). | |
|
Edit the source code at the breakpoint. | |
|
Temporarily disable all breakpoints (toggle). | |
|
Expand the breakpoint tree. | |
|
When the program stops, highlight the breakpoint that caused it to stop (toggle). | |
|
Create a breakpoint for a Java exception. |
Double-click on a breakpoint to edit the code at that line. To fine-tune when the breakpoint will be triggered, right-click on the breakpoint and select Properties. Table 10 shows some of the properties you can set. The exact options that appear will vary depending on the breakpoint’s type.
|
Property |
Description |
|
Enabled |
Indicates whether the breakpoint is currently in effect. |
|
Hit Count |
Specifies how many times the breakpoint must be hit before the programs stops. |
|
Condition |
Stops only when the expression is true or changes value. |
|
Suspend Policy |
Pauses the whole program or just a single thread. |
|
Filtering |
Limits the breakpoint’s effect to the given thread(s). |
In the Eclipse Java development environment, an expression is anything you can put on the righthand side of a Java assignment statement. This can include ordinary variables, fields, method calls, arithmetic formulae, and so forth.
A
conditional breakpoint is a breakpoint that doesn’t stop every time. For example, if you’re debugging a crash that occurs on the 100th time through a loop, you could put a breakpoint at the top of the loop and use a conditional expression like i==99, or you could specify a hit count of 100—whichever is more convenient.
Console View
The Console view displays the output of programs that are run under the control of Eclipse. Use it to view standard output or error output from your Java programs, or from Ant, CVS, or any other external program launched from Eclipse. You can also type into the Console view to provide standard input.
The Console view is closely tied to the Debug view. It keeps a separate page for each program listed in the Debug view, whether or not the program is currently running. Table 11 shows the commands on the Console view’s toolbar.
|
Icon |
Description |
|
Terminate the current program. | |
|
Remove all record of previously terminated programs. | |
|
Clear all the lines in the current console page. | |
|
Keep the view from scrolling as new lines are added to the end (toggle). | |
|
Prevent the view from automatically switching to other pages (toggle). | |
|
Switch to an existing console page. | |
|
Open a new console page (for example, to see CVS output). |
Tip
If your program prints a stack traceback, the Console view turns each line into a hyperlink. Click on a link to go to the location indicated in the traceback.
Options for the Console view can be found under Window → Preferences → Run/Debug → Console.
Debug View
The Debug view (in the Debug perspective) lists all programs that were launched by Eclipse. Use it to pause program execution, view tracebacks, and locate the cause of deadlocks (more on this shortly). Table 12 shows the commands on the Debug view’s toolbar.
|
Icon |
Description |
|
Continue running a program or thread that was previously paused. | |
|
Pause the current program or thread. | |
|
Terminate the current program. | |
|
Disconnect from a remote debugger. | |
|
Remove all record of previously terminated programs. | |
|
Single step into method calls. | |
|
Single step over method calls. | |
|
Continue execution until the current method returns. | |
|
Rewind execution to the beginning of the selected stack frame (requires VM support). | |
|
Enable/disable step filters (toggle). |
Step filters prevent you from having to stop in classes, packages, initializers, or constructors that you don’t find interesting. The list of filters is configured in Window → Preferences → Java → Debug → Step Filtering.
One option in the Debug view menu deserves a special mention: Show Monitors. Monitors are Java thread synchronization points. Deadlocks occur when one thread is waiting on a monitor that will never be released. When you turn on the Show Monitors option, the Debug view will display a list of monitors owned or waited on by each thread. Any deadlocks will be highlighted.
Declaration View
The Declaration view (in the Java perspective) shows the Java source code that defined the current selection. Use this view to see the declaration of types and members as you move around your code, without having to switch editors. The toolbar for the Declaration view contains the single icon shown in Table 13.
Display View
The Display view (in the Debug perspective) shows expression results in an unstructured format. Use it as a temporary work area in which to place expressions and calculate their values. Table 14 shows the commands on the Display view’s toolbar.
There are four different ways to evaluate expressions in the Eclipse debugger:
- Inspect (Ctrl+Shift+I or Run → Inspect)
Show the value of an expression in an expandable tree format. Optionally, copy it into the Expressions view. The value is never recalculated.
- Display (Ctrl+Shift+D or Run → Display)
Show the value of an expression in a simple string format. Optionally, copy it into the Display view. The value is never recalculated.
- Execute (Ctrl+U or Run → Execute)
Evaluate the expression but don’t show its value.
- Watch (Run → Watch)
Copy an expression into the Expressions view. Its value is recalculated every time you do a Step or Resume command.
For example, in the Java editor, you could highlight an expression such as array[i-1] and press Ctrl+Shift+D. A pop-up window appears, showing the current value of that array element. Press Ctrl+Shift+D again and the expression is copied to the Display view.
If this view looks familiar to you, that’s because it’s essentially an unnamed scrapbook page.
Error Log View
The Error Log view is not included by default in any perspective, but you can open it with Window → Show View → Error Log. Use it to view internal Eclipse errors and stack dumps when reporting problems to the developers. It can also display warnings and informational messages logged by Eclipse plug-ins. Table 15 shows the commands on the Error Log view’s toolbar.
Expressions View
The Expressions view (in the Debug perspective) shows a list of expressions and their values in the debugger. Use it to examine program states persistently as you step through your code, and to set breakpoints when fields are accessed or modified. This view is similar to the Variables view (described later in Part VII) except that the Expressions view shows only expressions that you have explicitly added. Table 16 describes the Expressions view’s toolbar.
There are three ways of looking at any expression in the Eclipse IDE; this is true for both the Expressions view and the Variables view:
- Literal mode
The fields, and nothing but the fields
- Logical mode
The way you normally think about the object
- Details pane
The string representation (as returned by the
toString()method)
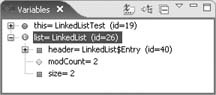
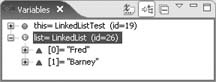
Consider a java.lang.LinkedList object. If you look at it literally (as in Figure 26), you’ll see it contains some internal data structures, such as the number of items and a reference to the first item. But if you look at it logically (Figure 27), it simply contains a list of objects.
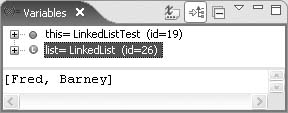
Additionally, the Expressions and Variables views support an optional text area called the Details pane. This pane shows the string representation of the selected item (see Figure 28). Use the view menu to arrange the panes horizontally or vertically, or to disable the Details pane altogether.
Hierarchy View
The Hierarchy view (in the Java perspective) shows the supertypes and subtypes for the selected Java object. Use it to explore the type hierarchy, fields, and methods for a class or interface by selecting the type in the Java editor or Package Explorer view and pressing F4 (Navigate → Open Type Hierarchy).
The Hierarchy view has two panes, each with its own toolbar. The top pane is the Type Hierarchy tree (see Table 17), which lists the object’s supertypes and subtypes. The optional bottom pane is the Member list (Table 18). It shows fields and methods. Double-click on any type or member to edit its source code.
Javadoc View
The Javadoc view (in the Java perspective) shows Java documentation from comments at the definition of the current selection. Use it if you need a larger, permanent version of the pop-up window you get when you hover the mouse pointer over a type or member in the Java editor. The toolbar for the Javadoc view contains the single icon shown in Table 19.
Like Hover Help, the Javadoc view requires access to the source code.
JUnit View
The JUnit view (in the Java perspective) shows the progress and results of JUnit tests. Use it to see what tests failed and why (see Part V for instructions on how to run unit tests).
The JUnit view has two panes, each with its own toolbar. The JUnit tests pane (see Table 20 for toolbar commands) lists the tests that failed (or a hierarchy of all tests). When you select a failed test in this pane, the Failure trace pane (see Table 21 for toolbar commands) shows a traceback pinpointing where the failure occurred. Double-click on any test name, class name, or traceback line to edit the source code at that point.
Use the JUnit preference page (Window → Preferences → Java → JUnit) to configure the list of stack frames to filter out.
Navigator View
The Navigator view (in the Resource perspective) shows all projects in the workspace as they exist on disk. Use it to see the literal directories and files. Contrast this with the Package Explorer view, which shows a Java-centric representation. Table 22 describes the Navigator view’s toolbar.
Right-click on a directory and select Go Into to focus on that directory. Then you can use the Back, Forward, and Up toolbar buttons to move around in the tree.
Outline View
The Outline view (in the Java and Debug perspectives) shows a tree representation of the resource being edited. Use it to quickly find the major elements of your class and study the overall API you have designed. In order for the outline to appear, the current editor must support it. Table 23 describes the Outline view’s toolbar.
Package Explorer View
The Package Explorer view (in the Java perspective) shows all projects in the workspace using logical Java groupings. Use it as your primary window into the world of your Java source code. Table 24 shows the Package Explorer view’s toolbar.
The Package Explorer view is a much more powerful version of the Navigator view, custom tailored for Java development. The main difference is that the Package Explorer understands Java source directories and packages. For example, suppose your project has a package named a.b.c. You will see the package a.b.c. in the Package Explorer view, while in the Navigator view, you will see the directory tree (a containing b containing c).
Views such as the Package Explorer support thousands of icon variations made from combining base icons (for simple objects like packages and files) with decorator icons, also known as decorations (for errors, warnings, accessibility, etc.). Tables 25 and 26 show a few of the common icons you should become familiar with.
Problems View
The Problems view (in the Java perspective) shows all the errors and warnings in the workspace. Double-click on a line in this view to jump directly to the offending source line. Table 27 describes the Problems view toolbar.
Tip
You’ll often want to use a filter to see just the problems for the current project or perhaps just the currently selected resource.
Right-click on a problem to see a context menu. One of the options there is Quick Fix (Ctrl+1). Use this to quickly repair common errors.
Search View
The Search view (in the Java perspective) shows the results of any search operation. Use it to filter and select just the matches you’re interested in. Table 28 describes the Search view toolbar.
|
Icon |
Description |
|
Go to next match. | |
|
Go to previous match. | |
|
Remove selected match(es) from the view. | |
|
Remove all matches from the view. | |
|
Expand the search tree. | |
|
Collapse the search tree. | |
|
Go back to a previous search in the history. | |
|
Group by project. | |
|
Group by package. | |
|
Group by file. | |
|
Group by type. |
The Search view can show its results in either flat mode (a plain listing) or hierarchical mode (an expandable tree). The grouping actions in the toolbar are only available in hierarchical mode. Use the View menu to change modes.
Tasks View
The Tasks view (in the Java perspective) lists all the markers placed in your source code. Markers are reminders that you or Eclipse add to the code to indicate something that needs your attention later. They can be added manually (Edit → Add Bookmark… or Edit → Add Task…), but more commonly the compiler adds them when it encounters a special comment in your code like this:
// TODO: Revisit this laterThe comment strings TODO, FIXME, and XXX are recognized by default. Add any others that you commonly use in your code to Window → Preferences → Java → Compiler → Task Tags.
Table 29 describes the Tasks view toolbar.
Variables View
The Variables view (in the Debug perspective) shows all the parameters and local variables in scope during a debugging session. Use this view to keep an eye on your program’s state as you step through it. The Variables view toolbar is described in Table 30.