Chapter 9. Graphics
Introduction
The recipes in this chapter introduce the powerful, fast, and
creative graphics capabilities of Visual Basic 2005. They provide
working examples of everything from drawing simple lines to creating charts and simple animations. If you’re coming
from Visual Basic 6.0, you’ll be especially pleased with the powerful
new capabilities of the GDI+ graphics. Several recipes will help you
update your skills by substituting new functionality for the primitive
graphics commands provided by Visual Basic 6.0, such as Line, Circle, and so on.
9.1. Creating Graphics Objects
Solution
Sample code folder: Chapter 09GDIObjects
Always start by defining and creating the fundamental graphics
objects relied upon by all GDI+ graphics methods. These include
colors, pens, fonts, brushes, and of course the Graphics object itself, the drawing surface
used by all graphics drawing methods.
Discussion
The sample code in this recipe demonstrates the creation of several graphics-related objects, providing a good starting point for studying some GDI+ fundamentals. We’ll look at the code in sections.
The most common place to put drawing code is in the Paint event handler for the form or control
on which you will draw:
	Private Sub Form1_Paint(ByVal sender As Object, _
	      ByVal e As System.Windows.Forms.PaintEventArgs) _
	      Handles Me.Paint
You can draw in other events or methods as well, but you’ll run into fewer hassles if you paint when the system tells you to, rather than forcing redrawing of surfaces based on other events.
The Paint event provides a
couple of useful parameters to help with the painting. You can create
your own Graphics object—a
technique handy in some situations—but when drawing in a Paint event, simply use the Graphics object passed to the event. You can
reference the e.Graphics object by
that nomenclature, or you can create a shorter reference to it (such
as, in this example, canvas):
	' ----- Grab the graphics object for this form.
	Dim canvas As Graphics = e.Graphics
You typically use the Graphics object a lot in the Paint method, so keeping the reference easy
to use can simplify your coding.
Colors can be defined in several ways, some of which
are demonstrated in the following group of program lines. You can
choose from a long list of enumerated colors with fanciful names like “cornsilk,” or you can
build your own color by setting each of the red, green, and blue
components of the color to a value from 0 to 255. There are also some
named system colors you can access to employ the standard colors
selected by the user for the entire workstation. The advantage of
using these colors is that your graphics will take on the
system-described colors, even if the user has changed one of those
colors from its default base. A fourth optional parameter (actually
passed as the first argument to Color.FromArgb())), called Alpha, controls the transparency of a color.
As shown in the following code, a transparent shade of green is
created by setting its Alpha
parameter to a middle-of-the-road value of 127:
	' ----- Create some colors.
	Dim colorBackground As Color = Color.Cornsilk
	Dim colorRed As Color = Color.FromArgb(255, 0, 0)
	Dim colorTransparentGreen As Color = _
	   Color.FromArgb(127, 0, 255, 0)
	Dim colorControlDark As Color = _
	   SystemColors.ControlDark
A Pen is used as a parameter for many drawing
methods. For example, lines, ellipses, rectangle edges, and polygon
edges are all drawn using a designated pen to define the lines used to
construct them. A basic Pen object
is comprised of a color and an optional width. If not given, the width
defaults to 1 unit, and you’ll get what you expect if your scaling
mode is the default pixels. If a different scaling is used, the
thickness of the pen’s line will remain at 1 unit, but depending on
the scaling this can drastically affect the appearance of the lines
you draw (see Recipe
9.8 for more on this topic). The following code block defines
pen1 with a width of 1 unit and
pen2 with a width of 25:
	' ----- Create some pens.
	Dim pen1 As New Pen(Color.Blue)
	Dim pen2 As New Pen(colorRed, 25)
Font objects are required whenever text is
drawn on a graphics surface. There are several ways to define a
new Font object: you can specify
its name and a few optional properties such as font size, or you can
start with a given font and make changes to it. Both of these
techniques are used in the program lines shown here:
	' ----- Create some fonts.
	Dim font1 As New Font("Arial", 24, _
	   FontStyle.Bold Or FontStyle.Italic)
	Dim font2 As New Font(Me.Font, FontStyle.Regular)
Visual Basic 2005 doesn’t have a plain old Print command, like the one that was
available in the good old days of VB 6. You’ll need to become familiar
with fonts, brushes, and GDI+ methods such as DrawString() to draw even the simplest text
content. The upside of this situation is that text can be drawn on any
surface in the same way, whether it’s a printer page, a form, or the
face of a button or other control.
When you draw shapes using lines, you pass the graphics method a
pen. When you fill Graphics objects
with color, such as when drawing a solid-filled rectangle or ellipse,
you pass a brush. Brushes can be solid-filled with a color, as shown
here, or they can be created using a repeating fill pattern or
image:
	' ----- Create some brushes.
	Dim brush1 As New SolidBrush(Color.DarkBlue)
	Dim brush2 As New SolidBrush(colorTransparentGreen)
The next lines use several methods of the Graphics object to render ellipses,
rectangles, and a string:
	' ----- Demonstrate a few sample graphics commands.
	canvas.Clear(colorBackground)
	canvas.DrawEllipse(pen2, 100, 50, 300, 200)
	canvas.FillEllipse(brush1, New Rectangle( _
	   50, 150, 250, 200))
	canvas.FillRectangle(New SolidBrush(colorTransparentGreen), _
	   120, 30, 150, 250)
	canvas.DrawString("Text is drawn using GDI+", _
	   font1, brush1, 120, 70)
Figure 9-1
displays the results generated by this code. The biggest ring is a
single-line outline of an ellipse, drawn using the pen2 object defined above (it’s actually a
red pen with a width of 25 units—in this case, the units are the
default pixels). The lower ellipse is solid-filled using a blue brush.
Clipping takes place automatically, and although the blue ellipse
doesn’t quite fit on the form’s surface, this causes no problems. The
rectangle uses the transparent green brush defined earlier, allowing
the red and blue ellipses to show through from underneath. Finally,
the string of text can be drawn at any location, using any font, any
size, any color, and any rotation angle.

Proper GDI+ etiquette requires that you properly dispose of all objects you create. Back in the old days before Windows 95, proper cleanup of graphics objects was essential, and the system could crash if it ran out of its few precious graphics resources. Those fears are long gone, but GDI+ objects still consume system resources. The .NET garbage-collection system will eventually dispose of all graphics objects, but it’s best if you do it yourself immediately:
	   ' ----- Clean up.
	   brush2.Dispose()
	   brush1.Dispose()
	   font2.Dispose()
	   font1.Dispose()
	   pen2.Dispose()
	   pen1.Dispose()
	   canvas = Nothing
	End Sub
9.2. Drawing on Controls for Special Effects
Problem
You want to alter the appearance of a control by drawing on it in reaction to mouse or other events.
Solution
Sample code folder: Chapter 09SpecialEffects
Add code to the control’s Paint event handler, and if required, call
the control’s Refresh() method to
trigger the Paint event.
Discussion
Any visible control has a Paint event that lets you patch in code to
modify the control’s appearance in any way you want. The following
code demonstrates this technique by completely changing the appearance
and behavior of a standard Button
control. For the sample, we created a new Windows Forms application,
then added a Panel control named
Panel1 and two Button controls, Button1
and Button2. Button1 is left
untouched for comparison, but Button2 changes as the mouse is used with
it. The button’s background color is altered as the mouse moves over
its face, and again when the mouse is clicked. The ButtonBackColor variable holds the indicated
color as set within the various mouse-event procedures, and it is used
in the button’s Paint event to
render its background color:
	Public Class Form1
	   Private ButtonBackColor As Color = Color.LightGreen
These four events change the background color in response to the mouse cursor entering or leaving the face of the button and to the mouse button being depressed and released when the cursor is over the button:
	Private Sub Button2_MouseEnter(ByVal sender As Object, _
	      ByVal e As System.EventArgs) Handles Button2.MouseEnter
	   ' ----- Change the button to show the effect of the mouse.
	   ButtonBackColor = Color.FromArgb(32, 192, 32)
	End Sub

	Private Sub Button2_MouseLeave(ByVal sender As Object, _
	      ByVal e As System.EventArgs) Handles Button2.MouseLeave
	   ' ----- Return the button to normal mode.
	   ButtonBackColor = Color.LightGreen
	End Sub

	Private Sub Button2_MouseDown(ByVal sender As Object, _
	      ByVal e As System.Windows.Forms.MouseEventArgs) _
	      Handles Button2.MouseDown
	   ' ----- The mouse is clicking the button. Show an effect.
	   ButtonBackColor = Color.LightPink
	End Sub

	Private Sub Button2_MouseUp(ByVal sender As Object, _
	      ByVal e As System.Windows.Forms.MouseEventArgs) _
	      Handles Button2.MouseUp
	   ' ----- The mouse was released. Go back to normal.
	   ButtonBackColor = Color.LightGreen
	   Button2.Refresh()
	End Sub
The Refresh() method in the MouseUp event handler tells the control to redraw itself, triggering a Paint event. You would expect the other
three event handlers to each need a Refresh() call as well, but the Button control issues those calls on our
behalf during these events.
The following method repaints Button2’s surface whenever Windows fires the
Paint event:
	Private Sub Button2_Paint(ByVal sender As Object, _
	      ByVal e As System.Windows.Forms.PaintEventArgs) _
	      Handles Button2.Paint
	   ' ----- Draw a fancy button surface.
	   Dim counter As Integer
	   Const numberOfLobes As Integer = 5

	   ' ----- Get the graphics object for the button.
	   Dim canvas As Graphics = e.Graphics

	   ' ----- Set a new background color.
	   canvas.
Clear(ButtonBackColor)
The button’s Graphics object
provides the surface for all graphics commands. The Clear() method optionally renders the
background in a given color. In this case, the variable ButtonBackColor tells the button what colors
to set the background to in response to the various mouse
events:
	' ----- Draw the atomic orbits in blue, two pixels wide.
	Dim atomPen As Pen = New Pen(Color.Blue, 2)

	' ----- Specify the location and size of the electron orbits.
	Dim sizeFactor As Integer = Button2.ClientSize.Width  2
	Dim lobeLength As Integer = sizeFactor * 8  10
	Dim lobeWidth As Integer = lobeLength  4

	' ----- Shift center of orbits to center of button.
	canvas.TranslateTransform(sizeFactor, sizeFactor)
The following lines of code repeatedly draw an ellipse in blue, rotated around its center to create an “atom” effect:
	   ' ----- Draw orbits rotated around center.
	   For counter = 1 To numberOfLobes
	      canvas.RotateTransform(360 / numberOfLobes)
	      canvas.DrawEllipse(atomPen, -lobeLength, -lobeWidth, _
	         lobeLength * 2, lobeWidth * 2)
	   Next counter
	End Sub
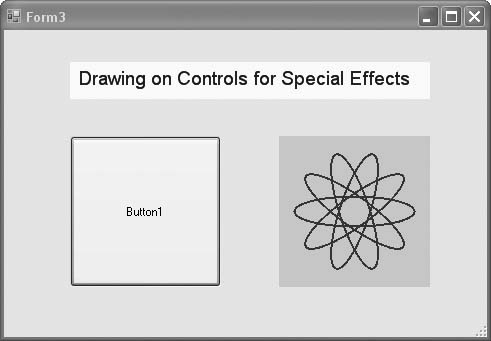
We chose this graphic partly because it was just plain fun to create, but also to show how easy it is to draw some things in Visual Basic 2005 that are cumbersome to draw in VB 6.
The following Paint event
handler paints the panel with a background color and some text, as
shown in Figure 9-2.
This same effect can be accomplished with a standard Label, but this provides another example of
how the face of just about any control can be graphically rendered as
desired:
	Private Sub Panel1_Paint(ByVal sender As Object, _
	      ByVal e As System.Windows.Forms.PaintEventArgs) _
	      Handles Panel1.Paint
	   ' ----- Draw a nice title.
	   Dim canvas As Graphics = e.Graphics
	   canvas.Clear(Color.Azure)
	   canvas.DrawString( _
	      "
Drawing on Controls for Special Effects", _
	      New Font("Arial", 14), Brushes.DarkBlue, 5, 5)
	End Sub
The next two methods, one for Button1 and the other for Button2, are nearly identical. They
demonstrate that even though Button2 now appears much different from the
more standard Button1 (see Figure 9-2), both buttons
behave the same and can be used in a program in the same way:
	   Private Sub Button1_Click(ByVal sender As System.Object, _
	         ByVal e As System.EventArgs) Handles Button1.Click
	      MsgBox("Button1 clicked!", MsgBoxStyle.Exclamation, _
	         "Painting on Controls")
	   End Sub

	   Private Sub Button2_Click(ByVal sender As System.Object, _
	         ByVal e As System.EventArgs) Handles Button2.Click
	      MsgBox("Button2 clicked!", MsgBoxStyle.Exclamation, _
	         "Painting on
Controls")
	   End Sub
	End Class
9.3. Letting the User Select a Color
Solution
Sample code folder: Chapter 09UserColorSelect
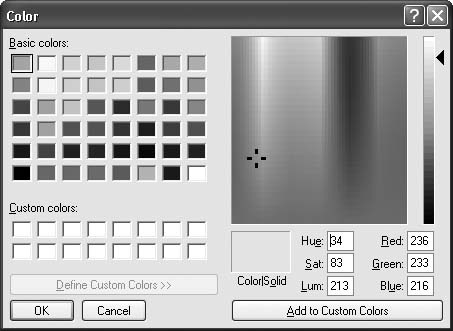
For simple color-selection needs, use the ColorDialog control. This dialog, shown in
Figure 9-3, lets the
user select any of the 16,777,216 24-bit colors available in
Windows.
Discussion
Create a new Windows Forms application, and add the following
controls to Form1:
A
Labelcontrol namedColorName. Set its Text property toNot Selected.A
PictureBoxcontrol namedColorDisplay. Set itsBorderStyleproperty toFixedSingle.A
Buttoncontrol namedActChange. Set itsTextproperty to Change….A
ColorDialogcontrol namedColorSelector.
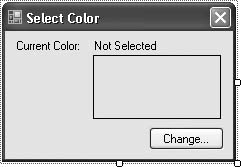
Add informational labels if desired. The form should look something like Figure 9-4.
Now add the following source code to the form’s code template:
	Private Sub ActChange_Click(ByVal sender As System.Object, _
	      ByVal e As System.EventArgs) Handles ActChange.Click
	   ' ----- Prompt to change the color.
	   ColorSelector.Color = ColorDisplay.BackColor
	   If (ColorSelector.ShowDialog() = _
	         Windows.Forms.DialogResult.OK) Then
	      ' ----- The user selected a color.
	      ColorDisplay.BackColor = ColorSelector.Color
	      If (ColorSelector.Color.IsNamedColor = True) Then
	         ' ----- Windows has a name for this color.
	         ColorName.Text = ColorSelector.Color.Name
	      Else
	         ColorName.Text = "R" & ColorSelector.Color.R & _
	            " G" & ColorSelector.Color.G & _
	            " B" & ColorSelector.Color.B
	      End If
	   End If
	End Sub
Run the program, and click the Change button to access the dialog. The form
will show the selected color, and either the name of the color (if
known) or its red-green-blue (RGB) value.
The ColorDialog includes a
few Boolean properties that let you control the availability of the
“color mixer” portion of the form (the right half). The dialog does
not include features that let the user indicate transparency or the
“alpha” level of a color.
9.4. Working with Coordinate Systems (Pixels, Inches, Centimeters)
Problem
You’ve been drawing on a graphics canvas (such as the surface of a form or control), and working with pixels. But your program lets the user work in inches or centimeters, and you don’t want to do all the conversions yourself.
Solution
Sample code folder: Chapter 09MeasurementSystems
The Graphics object that you
receive in a Paint event handler
(or that you create else-where) provides a few different ways to scale
to different measurement systems. The easiest way is to set its
PageUnit property to one of the
predefined GraphicsUnit enumeration
values. The sample code in this recipe uses GraphicsUnit.Display (the default),
.Inch, and .Millimeter.
Discussion
Create a new Windows Forms application, and add the following
controls to Form1:
A
RadioButtoncontrol namedShowPixels. Set itsTextproperty toPixel Sample.A
RadioButtoncontrol namedShowInches. Set itsTextproperty toInches Sample.A
RadioButtoncontrol namedShowCentimeters. Set itsTextproperty toCentimeters Sample.A
Labelcontrol namedComment. Set itsAutoSizeproperty toFalse, and resize it so that it can hold a dozen or so words.A
PictureBoxcontrol namedSampleDisplay. Set itsBorderStyleproperty toFixedSingle. Size it at about 250 x 250 pixels.
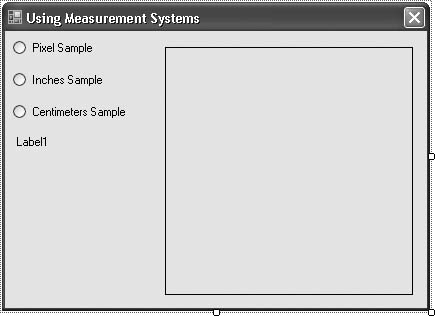
Your form should look something like Figure 9-5.
Now add the following source code to the form’s class template:
	Private Sub ChangeSystem(ByVal sender As System.Object, _
	      ByVal e As System.EventArgs) _
	      Handles ShowPixels.CheckedChanged, _
	      ShowInches.CheckedChanged, _
	      ShowCentimeters.CheckedChanged
	   ' ------ Update the example text.
	   If (ShowPixels.Checked = True) Then
	      Comment.Text = "50x50 rectangle at position " & _
	         "(50, 50). Major ruler ticks are at 100 pixels."
	   ElseIf (ShowInches.Checked = True) Then
	      Comment.Text = "1x1 inch rectangle at position " & _
	         "(1, 1). Major ruler ticks are inches."
	   Else
	      Comment.Text = "1x1 centimeter rectangle at " & _
	         "position (1, 1). Major ruler ticks are centimeters."
	   End If

	   ' ----- Now update the display.
	   SampleDisplay.Invalidate()
	End Sub

	Private Sub Form1_Load(ByVal sender As Object, _
	      ByVal e As System.EventArgs) Handles Me.Load
	   ' ----- Show the pixel example by default.
	   ShowPixels.Checked = True
	End Sub

	Private Sub SampleDisplay_Paint(ByVal sender As Object, _
	      ByVal e As System.Windows.Forms.PaintEventArgs) _
	      Handles SampleDisplay.Paint
	   ' ----- Draw the surface based on the user's selection.
	   Dim rectangleArea As Rectangle
	   Dim thinPen As Pen
	   Dim rulerWidth As Single
	   Dim tickStep As Single
	   Dim tickSize As Single
	   Dim counter As Integer
	   Dim bigTick As Single
	   Const ticks As String = "1424142414241"

	   ' ----- Clear any previous content.
	   e.Graphics.Clear(Color.White)

	   ' ----- Adjust to the right system.
	   If (ShowPixels.Checked = True) Then
	      ' ----- Draw a 50-by-50-pixel rectangle at (50,50).
	      rectangleArea = New Rectangle(50, 50, 50, 50)
	      rulerWidth = e.Graphics.DpiX / 5.0F
	      bigTick = 100.0F
	   ElseIf (ShowInches.Checked = True) Then
	      ' ----- Scale for inches.
	      e.Graphics.PageUnit = GraphicsUnit.Inch

	      ' ----- Draw a 1" x 1" rectangle at (1,1).
	      rectangleArea = New Rectangle(1, 1, 1, 1)
	      rulerWidth = 0.2F
	      bigTick = 1.0F
	   Else
	      ' ----- Scale for centimeters (actually, millimeters).
	      e.Graphics.PageUnit = GraphicsUnit.Millimeter

	      ' ----- Draw a 1cm x 1cm rectangle at (1,1).
	      '       Note: 0.2 inches is 1/5 of 25.4 millimeters.
	      rectangleArea = New Rectangle(10, 10, 10, 10)
	      rulerWidth = 25.4F / 5.0F
	      bigTick = 10.0F
	   End If

	   ' ----- Create a single-pixel pen.
	   thinPen = New Pen(Color.Black, 1 / e.Graphics.DpiX)

	   ' ----- Draw a ruler area. The rulerWidth is 0.2 inches
	   '       wide, no matter what the scale. Make a 3-inch
	   '       ruler.
	   e.Graphics.FillRectangle(Brushes.BlanchedAlmond, 0, 0, _
	      rulerWidth, rulerWidth * 15)
	   e.Graphics.FillRectangle(Brushes.BlanchedAlmond, 0, 0, _
	      rulerWidth * 15, rulerWidth)
	   e.Graphics.DrawLine(thinPen, rulerWidth, rulerWidth, _
	      rulerWidth, rulerWidth * 15)
	   e.Graphics.DrawLine(thinPen, rulerWidth, rulerWidth, _
	      rulerWidth * 15, rulerWidth)

	   ' ----- Draw the ruler tick marks. Include whole steps,
	   '       half steps, and quarter steps.
	   For counter = 1 To ticks.Length
	      ' ----- Get the tick measurements. The "ticks" constant
	      '       includes a set of "1", "2", and "4" values. "1"
	      '       gives a full-size tick mark (for whole units),
	      '       "2" gives a half-size tick mark, and "4" gives
	      '       a 1/4-size tick mark.
	      tickSize = CSng(Mid(ticks, counter, 1))
	      tickStep = rulerWidth + ((bigTick / 4.0F) * (counter - 1))

	      ' ----- Draw the horizontal ruler ticks.
	      e.Graphics.DrawLine(thinPen, tickStep, 0, _
	         tickStep, rulerWidth / tickSize)

	      ' ----- Draw the vertical ruler ticks.
	      e.Graphics.DrawLine(thinPen, 0, tickStep, _
	         rulerWidth / tickSize, tickStep)
	   Next counter

	   ' ----- Adjust the (0,0) point to the corner of the ruler.
	   e.Graphics.TranslateTransform(rulerWidth, rulerWidth)

	   ' ----- Draw the rectangle.
	   e.Graphics.DrawRectangle(thinPen, rectangleArea)

	   ' ----- Put things back to normal.
	   e.Graphics.PageUnit = GraphicsUnit.Display
	   thinPen.Dispose()
	End Sub
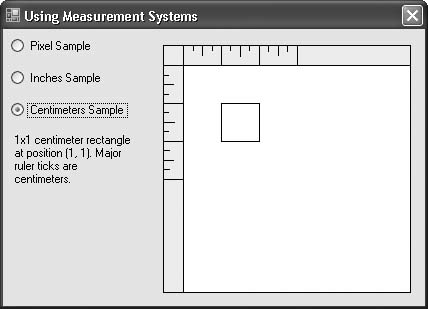
Run the program, and click on each of the three radio buttons to see the results. Figure 9-6 shows the application using centimeters.
The focus of the application is on drawing the black rectangle:
e.Graphics.DrawRectangle(thinPen, rectangleArea)
The rest of the code is there to make it easy to see the difference between the drawing systems.
The Graphics object defaults
to the coordinate system of the display. On a monitor, each
unit is a single pixel. When you draw a 10 x 10 rectangle, you are
drawing a rectangle 10 pixels high and 10 pixels wide. To draw a 10 x
10-inch rectangle, you need to change the scaling
system so that “1” represents an inch instead of a pixel.
The PageUnit property does
just that. It supports a few common measurement systems, including Inches,
Millimeters, and even Points.
You can also create your own custom scaling factor in each
direction (X and Y) by using the Graphics object’s
ScaleTransform() method. This lets you set a
scaling factor for both the horizontal (X) and vertical (Y)
directions. To see scaling in action, create a new Windows Forms
application, and add the following source code to the form’s code
template:
	Private Sub Form1_Paint(ByVal sender As Object, _
	      ByVal e As System.Windows.Forms.PaintEventArgs) _
	      Handles Me.Paint
	   e.Graphics.Clear(Color.White)
	   e.Graphics.DrawRectangle(Pens.Black, 10, 10, 30, 30)
	   e.Graphics.ScaleTransform(2, 2)
	   e.Graphics.DrawRectangle(Pens.Black, 10, 10, 30, 30)
	End Sub
This code draws two 30 x 30 rectangles, one normal (i.e., 30 x 30 pixels), and one scaled by a factor of two in each direction (resulting in a 60 x 60 square). Figure 9-7 shows the output of this code.
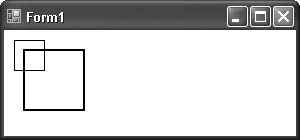
Everything about the second (larger) square is scaled by two: its size, its starting position (at (20,20) instead of (10,10)), and even the thickness of its pen (it’s twice as thick).
9.5. Creating a Bitmap
Solution
Sample code folder: Chapter 09BitmapObject
Create Bitmap objects, and
load images into them or draw directly on them.
Discussion
You can create a bitmap in memory, draw graphics onto a Graphics object created for the bitmap, and
then draw the bitmap to a form, panel, or other paintable surface.
This can provide an increase in speed, and sequentially drawing
multiple bitmaps onto a visible surface gives you a simple but
effective type of animation.
The code example in this recipe creates a bitmap based on the
size of the form and the nature of the Graphics object for the form. A new Graphics object is created based on the new
bitmap, so graphics methods will apply to the bitmap. Much of the rest
of the code creates radial lines emanating from two points near the
center of the bitmap. Finally, once the bitmap graphics are complete,
the bitmap is drawn to the form’s Graphics object, which paints onto the face
of the form:
	Private Sub Form1_Paint(ByVal sender As Object, _
	      ByVal e As System.Windows.Forms.PaintEventArgs) _
	      Handles Me.Paint
	   ' ----- Draw to the form indirectly through a bitmap.
	   Dim x As Single
	   Dim y As Single
	   Dim xc As Single
	   Dim yc As Single
	   Dim angle As Single
	   Dim radians As Single
	   Dim workImage As Bitmap
	   Dim canvas As Graphics

	   ' ----- Create a bitmap that is the same size and
	   '       format as the form surface.
	   workImage = New Bitmap(Me.Size.Width, Me.Size.Height, _
	      e.Graphics)

	   ' ----- Create a canvas for the bitmap. Drawing on the
	   '       canvas impacts the bitmap directly.
	   canvas = Graphics.FromImage(workImage)

	   ' ---- Draw a radial pattern.
	   For angle = 0 To 360 Step 2
	      radians = angle * Math.PI / 180
	      x = 500 * Math.Cos(radians)
	      y = 500 * Math.Sin(radians)
	      yc = Me.ClientSize.Height / 2
	      xc = Me.ClientSize.Width * 10 / 21
	      canvas.DrawLine(Pens.Black, xc, yc, xc + x, yc + y)
	      xc = Me.ClientSize.Width * 11 / 21
	      canvas.DrawLine(Pens.Black, xc, yc, xc + x, yc + y)
	   Next angle

	   ' ----- Stamp the bitmap on the form surface.
	   e.Graphics.DrawImage(workImage, 0, 0)
	End Sub
The key lines of code here are the ones that create the workImage and canvas objects. They create a bitmap
compatible with the form and a graphics surface for the bit-map. All
drawing methods require a Graphics
object to provide a drawing surface. The last line uses the Graphics. DrawImage() method to draw the custom image
onto the form, providing a way to get the in-memory bitmap onto a
visible surface.
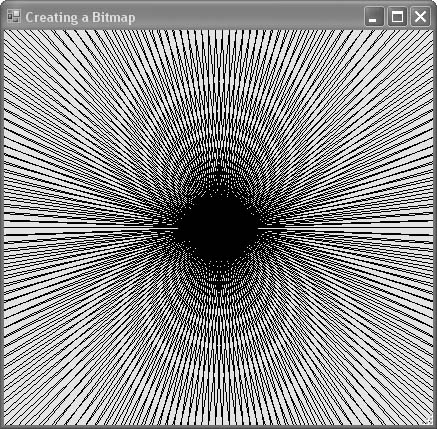
Figure 9-8 shows the new bitmap’s contents as drawn onto the face of the form.
As you resize this form, its Paint event fires repeatedly, and the bitmap
is recreated on the fly. However, it doesn’t redraw the entire
surface, because Windows tries to limit screen redraws to only those
parts that it thinks have changed. In this case, only the newly
exposed areas of the form are redrawn. To circumvent this, add the
following code to the form:
	Private Sub Form1_Resize(ByVal sender As Object, _
	      ByVal e As System.EventArgs) Handles Me.Resize
	   ' ----- Redraw the surface cleanly.
	   Me.Invalidate()
	End Sub
Now the entire image is redrawn as the form size changes.
9.6. Setting a Background Color
Problem
You want to customize a form’s background color but don’t want the controls on the form to look out of place.
Solution
Sample code folder: Chapter 09BackgroundColor
No problem: most controls automatically take on the same background color as their container.
Discussion
The demonstration of this effect is simple. Add the following
code to a button’s Click event to
change the background color to some random selection. Place any
controls of interest on the form to see how the changing background
affects them:
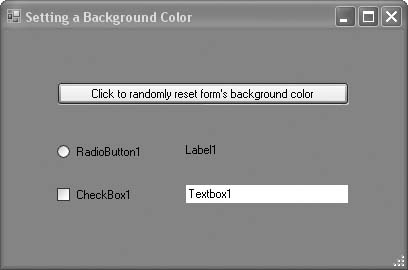
	Private Sub ActBackground_Click( _
	      ByVal sender As System.Object, _
	      ByVal e As System.EventArgs) _
	      Handles ActBackground.Click
	   ' ----- Change the background to some random color.
	   Dim redPart As Integer
	   Dim greenPart As Integer
	   Dim bluePart As Integer
	   Dim surpriseColor As New Random

	   redPart = surpriseColor.Next(0, 255)
	   greenPart = surpriseColor.Next(0, 255)
	   bluePart = surpriseColor.Next(0, 255)
	   Me.BackColor = Color.FromArgb(redPart, _
	      greenPart, bluePart)
	End Sub
As shown in Figure
9-9, the RadioButton, Label,
and CheckBox controls all adjust
automatically by taking on the same background color as the containing
form. The TextBox control’s
background remains white, by design. Place any other controls you
might be using on this form to see how they behave.
9.7. Drawing Lines, Ellipses, and Rectangles
Problem
You need to draw some basic shapes on a graphics surface. What choices are available?
Solution
Sample code folder: Chapter 09 DrawingBasicShapes
The System.Drawing.Graphics
object includes several methods that draw filled and unfilled shapes,
including methods for lines, rectangles, and ellipses. This recipe’s
code implements a simple drawing program using these basic
shapes.
Discussion
Create a new Windows Forms application, and add the following
controls to Form1:
A
RadioButtoncontrol namedDrawLine. Set itsTextproperty toLineand itsCheckedproperty toTrue.A
RadioButtoncontrol namedDrawRectangle. Set itsTextproperty toRectangle.A
RadioButtoncontrol namedDrawEllipse. Set itsTextproperty toEllipse.A
ComboBoxcontrol namedLineColor. Set itsDropDownStyleproperty toDropDownList.A
ComboBoxcontrol namedFillColor. Set itsDropDownStyleproperty toDropDownList.A
PictureBoxcontrol namedDrawingArea. Set itsBackColorproperty toWhite(or255, 255, 255) and itsBorderStyleproperty toFixed3D. Make it somewhat large.
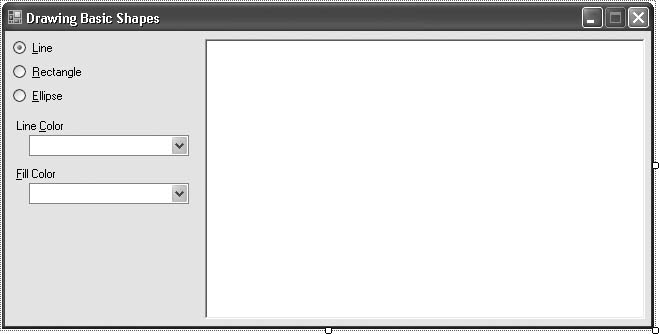
Add informational labels if desired. The form should look like the one in Figure 9-10.
Now add the following source code to the form’s code template:
Private FirstPoint As Point = New Point(-1, -1)
Private Sub Form1_Load(ByVal sender As System.Object, _
ByVal e As System.EventArgs) Handles MyBase.Load
' ----- Fill in the list of colors.
For Each colorName As String In New String() _
{"Black", "Red", "Orange", "Yellow", "Green", _
"Blue", "Indigo", "Violet", "White"}
LineColor.Items.Add(colorName)
FillColor.Items.Add(colorName)
Next colorName
LineColor.SelectedIndex = LineColor.Items.IndexOf("Black")
FillColor.SelectedIndex = LineColor.Items.IndexOf("White")
End Sub
Private Sub DrawingArea_MouseDown(ByVal sender As Object, _
ByVal e As System.Windows.Forms.MouseEventArgs) _
Handles DrawingArea.MouseDown
' ----- Time to do some drawing.
Dim useLine As Pen
Dim useFill As Brush
Dim canvas As Graphics
Dim drawBounds As Rectangle
' ----- Is this the first or second click?
If (FirstPoint.Equals(New Point(-1, -1))) Then
' ----- This is the first click. Record the location.
FirstPoint = e.Location
' ----- Draw a marker at this point.
DrawMarker(FirstPoint)
Else
' ----- Get the two colors to use.
useLine = New Pen(Color.FromName(LineColor.Text))
useFill = New SolidBrush(Color.FromName(FillColor.Text))
' ----- Get the
drawing surface.
canvas = DrawingArea.CreateGraphics()
' ----- Remove the first-point marker.
DrawMarker(FirstPoint)
' ----- For
rectangles and
ellipses, get the
' bounding area.
drawBounds = New Rectangle( _
Math.Min(FirstPoint.X, e.Location.X), _
Math.Min(FirstPoint.Y, e.Location.Y), _
Math.Abs(FirstPoint.X - e.Location.X), _
Math.Abs(FirstPoint.Y - e.Location.Y))
' ----- Time to draw.
If (DrawLine.Checked = True) Then
' ----- Draw a line.
canvas.DrawLine(useLine, FirstPoint, e.Location)
ElseIf (DrawRectangle.Checked = True) Then
' ----- Draw a rectangle.
canvas.FillRectangle(useFill, drawBounds)
canvas.DrawRectangle(useLine, drawBounds)
Else
' ----- Draw an ellipse.
canvas.FillEllipse(useFill, drawBounds)
canvas.DrawEllipse(useLine, drawBounds)
End If
' ----- Clean up.
canvas.Dispose()
useFill.Dispose()
useLine.Dispose()
FirstPoint = New Point(-1, -1)
End If
End Sub
Private Sub DrawMarker(ByVal centerPoint As Point)
' ----- Given a point, draw a small square at
' that location.
Dim screenPoint As Point
Dim fillArea As Rectangle
' ----- Determine the fill area.
screenPoint = DrawingArea.PointToScreen(centerPoint)
fillArea = New Rectangle(screenPoint.X - 2, _
screenPoint.Y - 2, 5, 5)
' ----- Draw a red rectangle. Cyan is the RBG
' inverse of red.
ControlPaint.FillReversibleRectangle(fillArea, Color.Cyan)
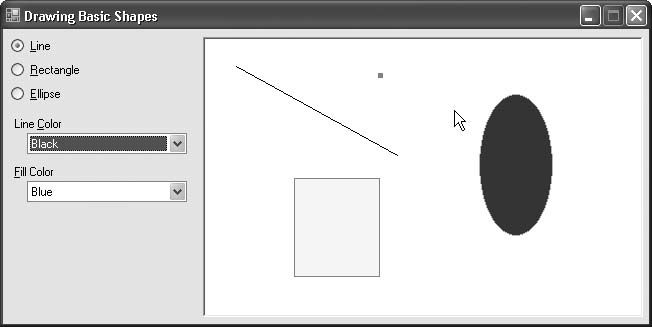
End SubRun the program, and use the RadioButton and ComboBox controls to select the object style
and colors. Click on the DrawingArea controls twice to specify the two
endpoints of each line, rectangle, or ellipse. Figure 9-11 shows the program
in use.
Drawing shapes is so easy in .NET as to make it somewhat
humdrum. Back in the early days of computer drawing, drawing a line or
circle required a basic understanding of the geometric equations
needed to produce such shapes on a Cartesian coordinate system. But no
more! The Graphics object includes
a set of methods designed to make drawing simple. Most of them are
used throughout the recipes in this chapter.
This recipe’s code spends some time watching for the locations of mouse clicks on the drawing surface. Once it has these locations and the user-selected colors, it draws the basic shapes in just a few quick statements:
	If (DrawLine.Checked = True) Then
	   canvas.DrawLine(useLine, FirstPoint, e.Location)
	ElseIf (DrawRectangle.Checked = True) Then
	   canvas.FillRectangle(useFill, drawBounds)
	   canvas.DrawRectangle(useLine, drawBounds)
	Else
	   canvas.FillEllipse(useFill, drawBounds)
	   canvas.DrawEllipse(useLine, drawBounds)
	End If
See Also
Recipe 9.26
discusses the FillReversibleRectangle() method used in
this recipe’s code.
9.8. Drawing Lines One Pixel Wide Regardless of Scaling
Problem
You need to draw a one- pixel-wide line, but this becomes problematic when the graphics scaling mode is changed.
Solution
Sample code folder: Chapter 09 PenWidth
Set the pen’s width to −1. Although this approach is not formally documented in the GDI+ references, it does cause the thinnest line possible to be drawn no matter what the scaling is set to.
Discussion
The Graphics object’s
PageUnit property allows you to set the
scaling to standard units such as inches or millimeters. This can be
very handy for some types of graphics-drawing tasks, but it alters the
way lines are drawn. The DrawLine() method accepts a pen that defines
the color and width of the drawn line. By default the pen’s width is
always set to 1 unit wide, and as long as the PageUnit is left at its default setting of
Pixels, all is well: a 1-unit-wide
line will be drawn as 1 pixel wide. However, when PageUnit is set to Inches, for example, a 1-unit-wide line is
rendered as 1 inch wide, which is likely not what you want at
all.
To demonstrate this in action, and to show the workaround, this recipe’s code first draws a line diagonally across the form with a red pen set to a width of 1, then draws another line on the other diagonal using a green pen set to a width of −1.
Create a new Windows Forms application, and place three RadioButton controls on the form, named
UsePixels, UseMillimeters, and
UseInches. Set their Text properties appropriately. Then add the
following code to the form’s code template:
Private Sub RadioButton_CheckedChanged( _
ByVal sender As System.Object, _
ByVal e As System.EventArgs) _
Handles UsePixels.CheckedChanged, _
UseMillimeters.CheckedChanged, _
UseInches.CheckedChanged
' ----- Change the scaling system.
Me.Refresh()
End Sub
Private Sub Form1_Paint(ByVal sender As Object, _
ByVal e As System.Windows.Forms.PaintEventArgs) _
Handles Me.Paint
' ----- Draw contrasting
lines.
Dim xCorner As Single
Dim yCorner As Single
Dim canvas As Graphics
canvas = e.Graphics
xCorner = Me.ClientSize.Width
yCorner = Me.ClientSize.Height
If (UseMillimeters.Checked = True) Then
canvas.PageUnit = GraphicsUnit.Millimeter
xCorner /= canvas.DpiX
yCorner /= canvas.DpiY
xCorner *= 25.4
yCorner *= 25.4
ElseIf (UseInches.Checked = True) Then
canvas.PageUnit = GraphicsUnit.Inch
xCorner /= canvas.DpiX
yCorner /= canvas.DpiY
Else
canvas.PageUnit = GraphicsUnit.Pixel
End If
' ----- Clear any previous lines.
canvas.Clear(Me.BackColor)
' ----- Draw a one-unit line.
canvas.DrawLine(New Pen(Color.Red, 1), 0, 0, _
xCorner, yCorner)
' ----- Draw a one-pixel line.
canvas.DrawLine(New Pen(Color.Green, -1), xCorner, _
0, 0, yCorner)
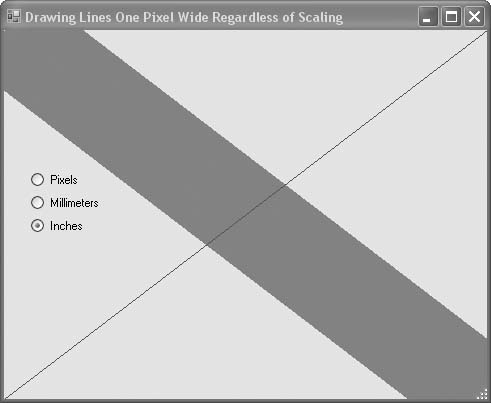
End SubAs this code shows, the graphics PageUnit property is set appropriately for
these units, and the red line will show the obvious difference in the
line width. Figure 9-12
shows the results when the red line is drawn 1 inch wide (it’s black
and white here, obviously, but imagine it’s red). The green line is
drawn 1 pixel wide, no matter which scaling mode is selected.
In addition to the PageUnit
mode, the ScaleTransform() method can customize the
scaling of your graphics. This transform affects all coordinates, and
all pen widths too; a pen width of 1 draws a 1-unit-wide line at
whatever scale is set. Again, the workaround is to set the pen’s width
to –1 to get a consistent 1- pixel-wide line.
9.9. Forcing a Form or Control to Redraw
Solution
Sample code folder: Chapter 09Invalidating
It’s best to let the operating system handle exactly when any
object should repaint itself. In Visual Basic 2005, this means it’s
best to draw in an object’s Paint
event and not to worry about when to activate the painting. However,
there are times when you want to control when graphics are redrawn,
such as for simple animations, when data values in the program change,
or when other events happen that affect the image. In these cases, you
can call the Refresh() method of the object to be
refreshed, or you can call the Invalidate() method to do much the same
thing. The operating system handles the rest of the details.
Discussion
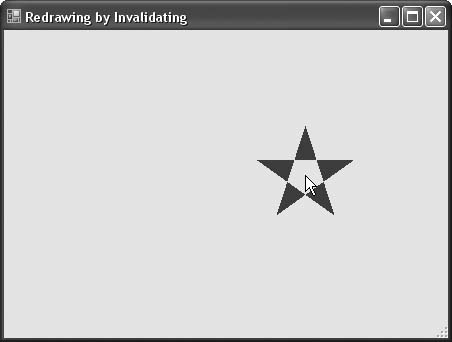
The demonstration code shown here draws a five-pointed star
centered on the mouse cursor. As the mouse moves around on the form,
the star moves with it, which means each mouse-move event should
trigger a form Paint event. You
accomplish this by invalidating the form with each move of the mouse.
You can also use the Refresh()
method.
Create a new Windows Forms application, and add the following code to the form’s class template:
	' ----- Keep track of the mouse position.
	Private MouseX As Integer
	Private MouseY As Integer

	Private Sub Form1_MouseMove(ByVal sender As Object, _
	      ByVal e As System.Windows.Forms.MouseEventArgs) _
	      Handles Me.MouseMove
	   ' ----- Record the mouse position.
	   MouseX = e.X
	   MouseY = e.Y

	   ' ----- Mark the form for redrawing.
	   Me.Invalidate()

	   ' ----- If you want to update the form quicker,
	   '       call Refresh() instead of Invalidate().
	   'Me.Refresh()
	End Sub
The form’s Paint event grabs
the form’s Graphics object to provide the surface to
draw on, then creates an array of points defining the five points of
the star, centered around the current position of the mouse:
	Private Sub Form1_Paint(ByVal sender As Object, _
	      ByVal e As System.Windows.Forms.PaintEventArgs) _
	      Handles Me.Paint

	   ' ----- Refresh the form display.
	   Dim canvas As Graphics = e.Graphics
	   Dim starPoints(4) As Point
	   Dim angle As Double
	   Dim radians As Double
	   Dim pointX As Double
	   Dim pointY As Double
	   Dim counter As Integer
	   Const pointDistance As Double = 50
	   Const angleStart As Integer = 198
	   Const angleRotation As Integer = 144

	   ' ----- Calculate each of the star's points.
	   angle = angleStart
	   For counter = 0 To 4
	      angle += angleRotation
	      radians = angle * Math.PI / 180
	      pointX = Math.Cos(radians) * pointDistance + MouseX
	      pointY = Math.Sin(radians) * pointDistance + MouseY
	      starPoints(counter) = New Point(CInt(pointX), _
	         CInt(pointY))
	   Next counter

	   ' ----- Draw the star. I've provided a few alternatives.
	   canvas.FillPolygon(Brushes.DarkRed, starPoints, _
	      Drawing2D.FillMode.Alternate)
	   'canvas.FillPolygon(Brushes.DarkRed, starPoints, _
	   '
Drawing2D.FillMode.Winding)
	   'canvas.DrawPolygon(Pens.DarkRed, starPoints)
	End Sub
There are several ways to draw or solid-fill a polygon such as this five-pointed star.
The last three statements in the code let you experiment with three
different techniques. The algorithm used to fill the center of a
polygon can either end up with alternating areas filled, or not. Figure 9-13 shows the results
of filling using Drawing2D.FillMode.Alternate. The Drawing2D.FillMode.Winding mode causes the
star to be completely filled in, including the center area.
The Invalidate() method does not force an
immediate refresh of the form. Instead, it puts in a request for a
redraw the next time the system is not too busy. Windows considers
screen updates low-priority tasks, so if your system is busy doing
other things, the screen changes will be postponed. If you want the
changes to occur immediately, follow the Invalidate() method call with a call to the
form’s (or, if you are drawing on a control, the control’s) Update() method:
	Me.Invalidate()
	Me.Update()
The Refresh() method combines
both lines into one method call. So why would you call Invalidate() when the more powerful Refresh() method is available? Invalidate() accepts arguments that let you
narrow down the size of the area to redraw. Redrawing the entire form
can be a slow process, especially if you have to do it often. By
passing a Rectangle or Region object to Invalidate(), you can tell Windows, “Redraw
only in this limited area.”
9.10. Using Transparency
Problem
You know that .NET includes cool new transparency and " alpha blending” features, and you’d like to try them out.
Solution
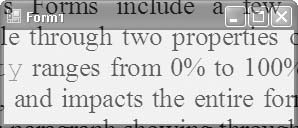
Windows Forms include a few different transparency features.
The simplest are accessible through two properties of each form:
Opacity and
TransparencyKey. Opacity ranges from 0% to
100% (actually, 0.0 for full transparency and 1.0 for full opacity)
and impacts the entire form. Figure 9-14 shows a form set
at 50% opacity with this paragraph showing through.
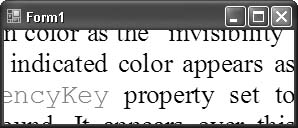
The TransparencyKey property
lets you indicate one form color as the “invisibility” color. When
used, anything on the form that appears in the indicated color is
rendered invisible. Figure
9-15 shows a form with its TransparencyKey property set to Control, the color normally used for the
form’s background. It appears over this paragraph’s text.
Discussion
A bug in the initial release of Visual Basic 2005 causes some
images drawn on a form’s surface or on one of its contained controls
to ignore the TransparencyKey
setting, even if that image contains the invisibility color. There is
a workaround that uses a third transparency feature of GDI+, the
Bitmap object’s MakeTransparent() method. The following
block of code loads an image from a file, sets the White color as transparent, and draws it on
the invisible background from Figure 9-15, producing the
results in Figure
9-16:
	Private Sub Form1_Load(ByVal sender As System.Object, _
	      ByVal e As System.EventArgs) Handles MyBase.Load
	   Dim backImage As New Bitmap("c:logo.bmp")
	   backImage.MakeTransparent(Color.White)
	   Me.BackgroundImage = backImage
	End Sub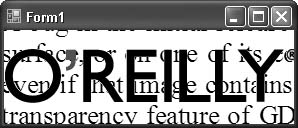
A fourth transparency feature involves partially invisible
colors. Although the System.Drawing.Color structure includes
several predefined colors, you can create your own colors through that
structure’s FromArgb() method. One
variation of this method accepts four arguments: red, green, and blue
components, and an “alpha” component that sets the transparency of the
color. That value ranges from 0 (fully transparent) to 255 (fully
opaque). Another variation accepts just an alpha component and a
previously defined color:
	' ----- Make a semi-transparent red color.
	Dim semiRed As Integer = New Color(128, Color.Red)

	' ----- Here's another way to do the same thing.
	Dim semiRed As Integer = New Color(128, 255, 0, 0)
You can then use this color to create pens or brushes as you would with any other color.
Some older systems don’t support all methods of transparency. If there is any chance your program will run on such older systems, don’t depend on transparency as the sole method of communicating something important to the user.
9.11. Scaling with Transforms
Problem
You want to zoom the view of a drawing area so that the user has a wider or narrower view of the content.
Solution
Sample code folder: Chapter 09ScalingTransform
Add a scaling transform to the drawing surface before outputting the text. The
System.Drawing.Graphics object
includes a ScaleTransform() method that lets you scale
the output automatically, with separate scales in the X and Y
directions.
Discussion
Create a new Windows Forms application, and add the following
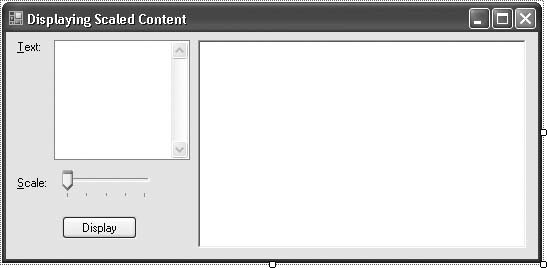
controls to Form1:
A
TextBoxcontrol namedDisplayText. Set itsMultilineproperty toTrueand itsScrollBarsproperty toVertical. Size it so that you can see multiple lines of user-entered text.A
TrackBarcontrol namedDisplayScale. Set itsMinimumproperty to1and itsMaximumproperty to5. TheTrackBarcontrol appears in the All Windows Forms section of the Toolbox by default.A
Buttoncontrol namedActDisplay. Set itsTextproperty toDisplay.A
PictureBoxcontrol namedDrawingArea. Set itsBackColorproperty toWhiteand itsBorderStyleproperty toFixed3D.
Add informational labels if desired. The form should look like Figure 9-17.
Now add the following source code to the form’s class template:
	Private Sub ActDisplay_Click(ByVal sender As System.Object, _
	      ByVal e As System.EventArgs) Handles ActDisplay.Click
	   ' ----- Force the text to redisplay.
	   DrawingArea.Invalidate()
	End Sub

	Private Sub DrawingArea_Paint(ByVal sender As Object, _
	      ByVal e As System.Windows.Forms.PaintEventArgs) _
	      Handles DrawingArea.Paint
	   ' ----- Refresh
the drawing area.
	   Dim titleFont As Font
	   Dim mainFont As Font
	   Dim titleArea As Rectangle
	   Dim textArea As Rectangle
	   Dim titleFormat As StringFormat
	   Const MainTitle As String = "Important Message"

	   ' ----- Clear any existing content.
	   e.Graphics.Clear(Color.White)

	   ' ----- Build some fonts used for the display text.
	   titleFont = New Font("Arial", 16, FontStyle.Bold)
	   mainFont = New Font("Arial", 12, FontStyle.Regular)

	   ' ----- Determine where the title and main text will go.
	   titleArea = New Rectangle(0, 0, _
	      DrawingArea.ClientRectangle.Width, titleFont.Height)
	   textArea = New Rectangle(0, titleFont.Height * 1.4, _
	      DrawingArea.ClientRectangle.Width, _
	      DrawingArea.ClientRectangle.Height - _
	      (titleFont.Height * 1.4))

	   ' ----- Scale according to the user's request.
	   e.Graphics.
ScaleTransform(DisplayScale.Value, _
	      DisplayScale.Value)

	   ' ----- Add a title to the content.
	   titleFormat = New StringFormat()
	   titleFormat.Alignment = StringAlignment.Center
	   e.Graphics.DrawString(MainTitle, titleFont, _
	      Brushes.Black, titleArea, titleFormat)
	   titleFormat.Dispose()

	   ' ----- Draw a nice dividing line.
	   e.Graphics.DrawLine(Pens.Black, 20, _
	      CInt(titleFont.Height * 1.2), _
	      DrawingArea.ClientRectangle.Width - 20, _
	      CInt(titleFont.Height * 1.2))

	   ' ----- Draw the main text.
	   e.Graphics.DrawString(DisplayText.Text, mainFont, _
	      Brushes.Black, textArea)

	   ' ----- Clean up.
	   mainFont.Dispose()
	   titleFont.Dispose()
	End Sub
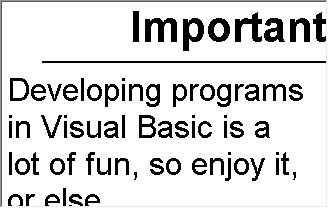
Run the program, enter some text in the TextBox control, adjust the DisplayScale control value, and click the
ActDisplay button. The drawing area zooms in on the content as you adjust
the scale. Figure 9-18
shows content without scaling (DisplayScale.Value =
1) and with a 2x scale (DisplayScale.Value = 2).

The ScaleTransform() method
scales everything: text and shape sizes, pen thickness, X and Y
positions, rectangular bounding boxes, and so on. The previous sample
code scaled the textArea bounding
box used to limit the extent of the main text to the output display
area. When the content was scaled, though, the bounding box was also
scaled, so that the content no longer fits the bounding box. If you
still want such bounding boxes to fit, you have to scale them by an
inverse factor:
	textArea = New Rectangle(0, titleFont.Height * 1.4, _
	   DrawingArea.ClientRectangle.Width / DisplayScale.Value, _
	   DrawingArea.ClientRectangle.Height - _
	   (titleFont.Height * 1.4))
Figure 9-19 shows the output from this revised block of code.
See Also
Recipe 9.4 discusses scaling based on inches and centimeters.
9.12. Using an Outline Path
Problem
You want to create a complex graphics drawing path that can simplify graphics drawing commands and can be reused repeatedly.
Solution
Sample code folder: Chapter 09 GraphicsPath
The GraphicsPath object lets
you create and store a complex sequence of graphics lines, rectangles,
ellipses, and polygons as a single object.
Discussion
The GraphicsPath is part of
the Drawing2D namespace, so be sure
to add the following Imports
statement to the top of your code:
Imports System.Drawing.Drawing2D
In this recipe we’ll use a GraphicsPath object to draw a checkerboard.
The drawing takes place in the form’s Paint event handler:
	Private Sub Form1_Paint(ByVal sender As Object, _
	      ByVal e As System.Windows.Forms.PaintEventArgs) _
	      Handles Me.Paint
To begin, the graphics surface for the form is referenced, and a
static GraphicsPath reference
variable (thePath) is created. The
path is created the first time the event handler gets called and is
used again on successive calls:
	  ' ----- Draw a checkerboard.
	  Dim across As Integer
	  Dim down As Integer
	  Dim canvas As Graphics = e.Graphics
	  Static thePath As GraphicsPath

	  ' ----- Draw the checkerboard the first time only.
	  If (thePath Is Nothing) Then
	     thePath = New GraphicsPath
	     For across = 0 To 7
	        For down = 0 To 7
	           If (((across + down) Mod 2) = 1) Then
	              thePath.AddRectangle( _
	                 New Rectangle(across, down, 1, 1))
	           End If
	        Next down
	     Next across
	  End If
The scaling needs to take place every time the Paint event is triggered because as the user changes the size of the form (and the graphics surface), the checkerboard stretches to fit it:
	  ' ----- Scale the form for the checkerboard.
	  Dim scaleX As Single
	  Dim scaleY As Single
	  scaleX = CSng(Me.ClientSize.Width / 10)
	  scaleY = CSng(Me.ClientSize.Height / 10)
	  canvas.ScaleTransform(scaleX, scaleY)
	  canvas.TranslateTransform(1, 1)
Finally, the path is drawn using a blue brush, and its outline is drawn around the edges:
	  ' ----- Draw and outline the checkerboard.
	  canvas.FillPath(Brushes.Blue, thePath)
	  canvas.DrawRectangle(New Pen(Color.Blue, -1), 0, 0, 8, 8)
	End Sub
The form’s Resize event needs
a command to cause the form to refresh as it is resized. This causes
the checkerboard to be redrawn on the fly as the form is stretched or
shrunk:
	Private Sub Form1_Resize(ByVal sender As Object, _
	      ByVal e As System.EventArgs) Handles Me.Resize

	   ' ----- Redraw the checkerboard.
	   Me.Refresh()
	End Sub
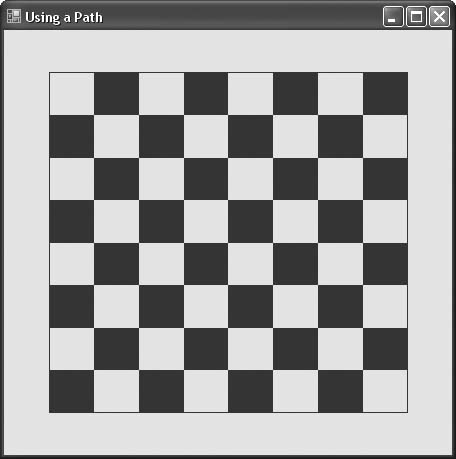
For maximum smoothness of the action, be sure to set the form’s
DoubleBuffered property to True.
Figure 9-20 shows the checkerboard when the form has been resized to fairly square dimensions.
9.13. Using Gradients for Smooth Color Changes
Problem
You want to fill a graphics area with colors that smoothly transition from one shade to another.
Solution
Sample code folder: Chapter 09SmoothColor
Create a GraphicsPath object,
use it to create and define a PathGradientBrush, set the various colors of
the brush, and then use the new gradient brush to fill a graphics
area.
Discussion
The PathGradientBrush object enables a lot of
creative color transitions in your graphics. The code in this recipe
provides a good starting point for further experimentation.
Some of these objects require referencing the Drawing2D namespace, so be sure to add the
following Imports statement to the
top of your source code:
Imports System.Drawing.Drawing2D
This example dynamically updates the gradient fill as you move
the mouse over the face of the form. To do this, the mouse position is
recorded with each MouseMove event,
and the form repaints itself by calling its Refresh() method:
	' ----- Keep track of the mouse position.
	Private MouseX As Integer
	Private MouseY As Integer

	Private Sub Form1_MouseMove(ByVal sender As Object, _
	      ByVal e As System.Windows.Forms.MouseEventArgs) _
	      Handles Me.MouseMove
	   ' ----- Record the mouse position.
	   MouseX = e.X
	   MouseY = e.Y

	   ' ----- Cause a repaint of the form.
	   Me.Refresh()
	End Sub
The form’s Paint event
handles the important details of the gradient color fill. Let’s take
this step by step.:
The
Paintevent is called with each move of the mouse:Private Sub Form1_Paint(ByVal sender As Object, _ ByVal e As System.Windows.Forms.PaintEventArgs) _ Handles Me.Paint
The graphics path can be any shape, even discontinuous rectangles, ellipses, and so on. In this case the path is defined as the rectangle around the edge of the form’s client area:
' ----- Create path around edge of form's client area. Dim thePath As New GraphicsPath thePath.AddRectangle(Me.ClientRectangle)
The
PathGradientBrushis created using the predefined path. The object uses this geometric information internally to determine smoothly transitioning colors for all pixel locations during drawing:' ----- Use the path to construct a gradient brush. Dim smoothBrush As PathGradientBrush = _ New PathGradientBrush(thePath)
You can define one point in the center of the brush area to have a specific color. Here, set the point under the mouse cursor to
White. Colors will transition away from white based on distance from the mouse cursor to the edges of the path:' ----- Set the color at the mouse point. smoothBrush.CenterPoint = New PointF(MouseX, MouseY) smoothBrush.CenterColor = Color.White
One or more colors can be set along the path using the
SurroundColorsproperty of thePathGradientBrushobject. Set an array of four colors, so each corner of the form provides a standard color:' ----- Set a color along the entire boundary of the path. Dim colorArray() As Color = _ {Color.Red, Color.Green, Color.Blue, Color.Yellow} smoothBrush.SurroundColors = colorArrayThe new
PathGradientBrushis used to fill the rectangular area of the form, and all pixels on the form are set to a smoothly transitioned shade depending on the geometry and settings made earlier in the code:' ----- Fill form with gradient path. e.Graphics.FillRectangle(smoothBrush, Me.ClientRectangle) End Sub
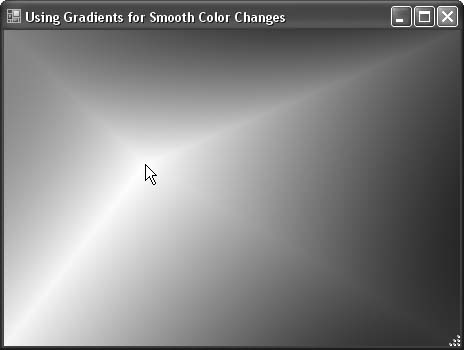
To have the effect update smoothly, set the form’s
DoubleBufferedproperty toTrue. Figure 9-21 shows the form’s appearance as the mouse is moved around on it.
9.14. Drawing Bezier Splines
Problem
You need to draw smooth curves between points, but you’d prefer not to delve into a lot of complex mathematical calculations.
Solution
Sample code folder: Chapter 09BezierSplines
The DrawBezier() graphics method draws a smooth
curve between two points, using two other points as control
points—or points that tug at the curve to change its shape
as desired.
Discussion
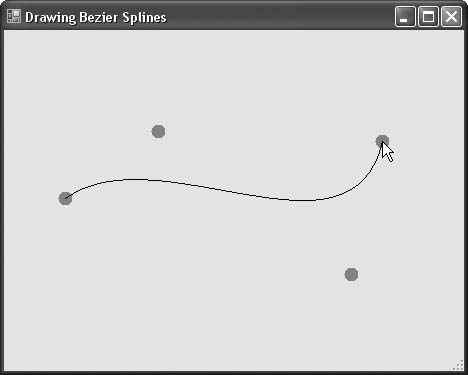
Bezier splines are defined by two endpoints and two control points. (The mathematical theory behind Bezier splines is beyond the scope of this book. For more information, check out the links in the “See Also” section at the end of this recipe.)
The example program shown here lets you experiment interactively
with the DrawBezier() graphics
method. First, make sure you import the Drawing2D namespace, as follows:
Imports System.Drawing.Drawing2D
Up to four mouse-click points will be recorded in an array of points. Keep track of the points using a generic list:
' ----- Keeps track of the mouse positions. Dim BendPoints As New Generic.List(Of Point)
As the mouse is clicked and new points are added to the array,
the form is told to refresh itself by calling its Refresh() method:
Private Sub Form1_MouseClick(ByVal sender As Object, _ ByVal e As System.Windows.Forms.MouseEventArgs) _ Handles Me.MouseClick ' ----- Record another mouse position. BendPoints.Add(New Point(e.X, e.Y)) ' ----- Update the display. Me.Refresh() End Sub
The form’s Paint event is
where the important action takes place:
Private Sub Form1_Paint(ByVal sender As Object, _ ByVal e As System.Windows.Forms.PaintEventArgs) _ Handles Me.Paint ' ----- Get the form's drawing surface. Dim canvas As Graphics = e.Graphics
Each point is drawn as a small solid-filled ellipse (circle).
When there are four points, they are passed to the DrawBezier() method to draw the curve using a
black pen. The first and fourth clicks are the endpoints. Clicking on
the form a fifth time erases all the points, and the curve starts
over:
	   Dim scanPoint As Point
	   Const PointSize As Integer = 7

	   ' ----- Draw available points.
	   If (BendPoints.Count <= 4) Then
	      For Each scanPoint In BendPoints
	         canvas.FillEllipse(Brushes.Red, _
	         scanPoint.X - PointSize, _
	         scanPoint.Y - PointSize, _
	         PointSize * 2, PointSize * 2)
	      Next scanPoint
	   End If

	   ' ----- Draw the spline if all points are there.
	   If (BendPoints.Count >= 4) Then
	      canvas.DrawBezier(Pens.Black, BendPoints(0), _
	         BendPoints(1), BendPoints(2), BendPoints(3))
	      BendPoints.Clear()
	   End If
	End Sub
Figure 9-22 shows the results after four points have been clicked.
See Also
See http://www.ibiblio.org/e-notes/Splines/Bezier.htm and http://mathforum.org/library/drmath/view/54434.html for more information on Bezier splines.
9.15. Drawing Cardinal Splines
Problem
You need a curve that goes smoothly through two or more points.
Solution
Sample code folder: Chapter 09CardinalSplines
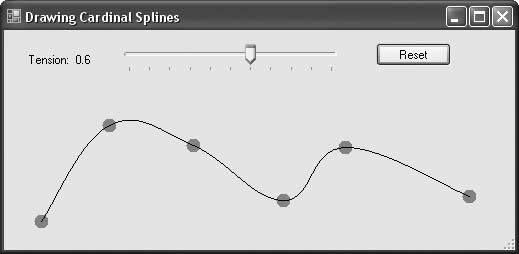
A Cardinal spline plots a curve through two or more points. Unlike the Bezier spline, the Cardinal spline intersects every point and does not use external control points.
Discussion
The mathematical description of the way the Cardinal spline works is beyond the scope of this book. For a more in-depth discussion and explanation of the math involved, see the links in the “See Also” section at the end of this recipe.
The following code demonstrates the Cardinal spline by
collecting points as they are clicked on the face of the form. A list
of the points is built up, and with each added point, the Cardinal
spline is drawn anew. A button at the top of the form lets you erase
all the points to start over, and a
TrackBar control lets you set the tension
parameter for the spline. The tension is a number ranging from 0 to 1
that is passed to the DrawCurve() method to determine the
smoothness of the curve as it passes through each point. The easiest
way to understand the effect of this parameter is to slide the
TrackBar and watch the curve change
shape.
Here’s the code that lets the form monitor for mouse clicks,
builds the set of points, and refreshes the form to activate its
Paint event:
	' ----- Keep track of the mouse positions.
	Private BendPoints As New Generic.List(Of Point)

	Private Sub Form1_MouseClick(ByVal sender As Object, _
	      ByVal e As System.Windows.Forms.MouseEventArgs) _
	      Handles Me.MouseClick
	   ' ----- Add a mouse position.
	   BendPoints.Add(New Point(e.X, e.Y))

	   ' ----- Update the display.
	   Me.Refresh()
	End Sub
The form’s Paint event is
where the drawing of the selected points and the spline connecting
them takes place. The event fires when the form is refreshed, which is
caused by calling the Refresh()
method when the mouse is clicked or the trackbar is adjusted.
This code draws each plotted point in red as the user clicks it.
Then, if there are two or more accumulated points, it draws the
Cardinal spline using the DrawCurve() method:
	Private Sub Form1_Paint(ByVal sender As Object, _
	      ByVal e As System.Windows.Forms.PaintEventArgs) _
	      Handles Me.Paint
	   ' ----- Draw the spline points and line.
	   Dim tension As Single
	   Dim canvas As Graphics
	   Dim scanPoint As Point
	   Const PointSize As Integer = 7

	   ' ----- Determine the tension.
	   tension = TensionLevel.Value / TensionLevel.Maximum
	   LabelTension.Text = "Tension: " & tension.ToString

	   ' ----- Draw the points on the surface.
	   canvas = e.Graphics
	   For Each scanPoint In BendPoints
	      canvas.FillEllipse(Brushes.Red, _
	         scanPoint.X - PointSize, _
	         scanPoint.Y - PointSize, _
	         PointSize * 2, PointSize * 2)
	   Next scanPoint

	   ' ----- Draw the Cardinal spline.
	   If (BendPoints.Count > 1) Then
	      canvas.DrawCurve(Pens.Black, _
	         BendPoints.ToArray, tension)
	   End If
	End Sub
When the Trackbar’s slider is
adjusted, the form’s Refresh()
method is called to trigger a repaint:
	Private Sub TensionLevel_ValueChanged( _
	      ByVal sender As Object, ByVal e As System.EventArgs) _
	      Handles TensionLevel.ValueChanged
	   ' ----- Update the tension and display.
	    Me.Refresh()
	End Sub
When the Reset button is clicked, the set of points is emptied, and the form is repainted to erase the points and the curve:
	Private Sub ActReset_Click(ByVal sender As System.Object, _
	      ByVal e As System.EventArgs) Handles ActReset.Click

	   ' ----- Clear all points.
	   BendPoints.Clear()
	   Me.Refresh()
	End Sub
Figure 9-23 shows a typical spline curve through six points with the tension set to 0.6. A lower tension results in sharp angles at the bend points, while higher tension gives a smoother curve.
See Also
See http://www.ibiblio.org/e-notes/Splines/Cardinal.htm and http://en.wikipedia.org/wiki/Cardinal_spline for more information on Cardinal splines.
9.16. Limiting Display Updates to Specific Regions
Problem
You want to clip your graphics using some complexly shaped area, without having to resort to difficult code to compute intersections and other clipping details.
Solution
Sample code folder: Chapter 09ClippingRegion
Create a Region object
defined by a path, set the Graphics
object’s Clip property to this
region, and draw any standard graphics on the Graphics object surface. Clipping takes
place using the path.
Discussion
A single path can range from a simple sequence of lines to an
elaborate mix of connected or disconnected rectangles, ellipses, or
polygons. This means that a path can take on a complex outline, and it
can involve a lot of independent parts. In the example presented here
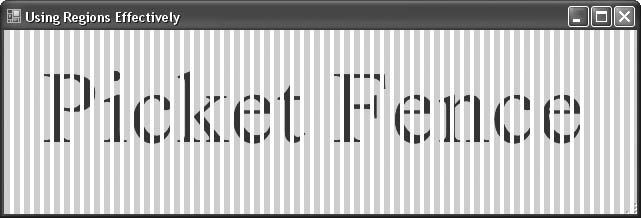
a large number of tall, thin rectangles are added to a single path,
and this path is then used to define a Region object that clips the drawing of a
string.
Several of the objects used in this example are in the Drawing2D namespace, so be sure to add the
following Imports statement to the
top of your source code:
Imports System.drawing.Drawing2D
The remaining code appears in the form’s Paint event handler. The first thing the
Paint handler does is access the
form’s graphics surface, passed as a member of the PaintEventArgs instance (e). The area is cleared to solid
white:
	Private Sub Form11_Paint(ByVal sender As Object, _
	      ByVal e As System.Windows.Forms.PaintEventArgs) _
	      Handles Me.Paint
	   ' ----- Draw using a region to restrict output.
	   Dim canvas As Graphics
	   Dim fencePath As GraphicsPath
	   Dim onePicket As Rectangle
	   Dim counter As Integer
	   Dim slottedRegion As Region

	   ' ----- Clear the background.
	   canvas = e.Graphics
	   canvas.Clear(Color.White)
Next, a GraphicsPath object
is created and filled with a lot of tall, thin rectangles, spaced
apart somewhat like the pickets on a picket fence. These rectangles
don’t touch each other, but they are all added to a single complex
path object:
	   ' ----- Create a picket fence path.
	   fencePath = New GraphicsPath
	   For counter = 0 To 200
	      onePicket = New Rectangle(counter * 10, 0, 6, 500)
	      fencePath.AddRectangle(onePicket)
	   Next counter
The path just created is then used to define a new Region object:
	   ' ----- Create a region from the path.
	   slottedRegion = New Region(fencePath)
The path itself can’t be used to define a clipping region, but a
Region object can. Even regions
defined by complexly shaped paths provide rapid clipping on the
graphics surface. To this end, we’ll now assign the slottedRegion to the Graphics object’s Clip property:
	   ' ----- Set clipping using the region.
	   canvas.Clip = slottedRegion
You can apply any graphics drawing methods you want at this
point, and everything drawn will be clipped as defined by the Graphics object’s Clip property. In this example we clear the
entire surface to a new color (given a white-cyan-white-cyan picket
fence image), and then draw a string of text using a large font:
	   ' ----- Draw some slotted
text.
	   canvas.Clear(Color.Aqua)
	   canvas.
DrawString("Picket Fence", _
	      New Font("Times New Roman", 77), _
	      Brushes.Blue, 20, 20)
	End Sub
Figure 9-24 shows how both graphics methods are clipped.
9.17. Drawing Text
Problem
You want to draw some nicely formatted text on the drawing surface.
Solution
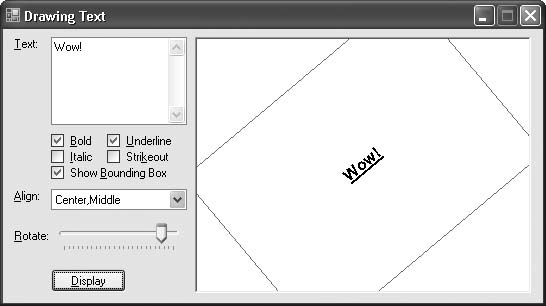
Sample code folder: Chapter 09DrawingText
The primary tool for drawing text is the Graphics.DrawString() method. To make
adjustments to the text, you can alter the font’s properties, apply
transformations to the canvas itself, or use a StringFormat object. This recipe’s sample
code uses each of these methods to display a string of text.
Discussion
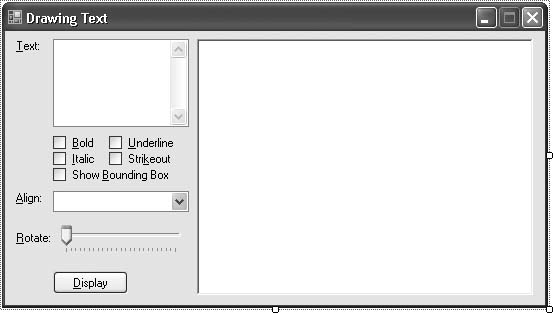
Create a new Windows Forms application, and add the following
controls to Form1:
A
TextBoxcontrol namedDisplayText. Set itsMultilineproperty toTrueand itsScrollBarsproperty toVertical. Size it so that you can see multiple lines of user-entered text.A
CheckBoxcontrol namedUseBold. Set itsTextproperty toBold.A
CheckBoxcontrol namedUseItalic. Set itsTextproperty toItalic.A
CheckBoxcontrol namedUseUnderline. Set itsTextproperty toUnderline.A
CheckBoxcontrol namedUseStrikeout. Set itsTextpropertyStrikeout.A
CheckBoxcontrol namedShowBoundingBox. Set its Text property toShow Bounding Box.A
ComboBoxcontrol namedDisplayAlign. Set itsDropDownStyleproperty toDropDownList.A
TrackBarcontrol namedDisplayRotate. Set itsMinimumproperty to 0, itsMaximumproperty to360, itsTickFrequencyproperty to15, itsSmallChangeproperty to15, and itsLargeChangeproperty to60. TheTrackBarcontrol appears in the All Windows Forms section of the Toolbox by default.A
Buttoncontrol namedActDisplay. Set itsTextproperty toDisplay.A
PictureBoxcontrol namedDrawingArea. Set itsBackColorproperty toWhiteand itsBorderStyleproperty toFixed3D.
Add informational labels if desired. The form should look like Figure 9-25.
Now add the following source code to the form’s class template:
	Private Sub ActDisplay_Click(ByVal sender As System.Object, _
	      ByVal e As System.EventArgs) Handles ActDisplay.Click
	   ' ----- Force the
text to redisplay.
	   DrawingArea.Invalidate()
	End Sub

	Private Sub DrawingArea_Paint(ByVal sender As Object, _
	      ByVal e As System.Windows.Forms.PaintEventArgs) _
	      Handles DrawingArea.Paint
	   ' ----- Refresh the drawing area.
	   Dim mainFont As Font
	   Dim
textArea As Rectangle
	   Dim textStyle As New FontStyle
	   Dim textFormat As StringFormat
	   Dim alignParts() As String

	   ' ----- Clear any existing content.
	   e.Graphics.Clear(Color.White)

	   ' ----- Build the font used for the display text.
	   textStyle = FontStyle.Regular
	   If (UseBold.Checked = True) Then _
	      textStyle = textStyle Or FontStyle.Bold
	   If (UseItalic.Checked = True) Then _
	      textStyle = textStyle Or FontStyle.Italic
	   If (UseUnderline.Checked = True) Then _
	      textStyle = textStyle Or FontStyle.Underline
	   If (UseStrikeout.Checked = True) Then _
	      textStyle = textStyle Or FontStyle.Strikeout
	   mainFont = New Font("Arial", 12, textStyle)

	   ' ----- Move the (0,0) origin to the center of the
	   '       display.
	   e.Graphics.TranslateTransform( _
	      DrawingArea.ClientRectangle.Width / 2, _
	      DrawingArea.ClientRectangle.Height / 2)

	   ' ----- Determine where the main text will go. The Offset
	   '       method repositions the rectangle's coordinates
	   '       by the given X and Y values.
	   textArea = New Rectangle(20, 20, _
	      DrawingArea.ClientRectangle.Width - 40, _
	      DrawingArea.ClientRectangle.Height - 40)
	   textArea.Offset( _
	      -CInt(DrawingArea.ClientRectangle.Width / 2), _
	      -CInt(DrawingArea.ClientRectangle.Height / 2))

	   ' ----- Prepare the alignment.
	   textFormat = New StringFormat
	   alignParts = Split(DisplayAlign.Text, ",")

	   Select Case alignParts(0)
	      Case "Left"

textFormat.Alignment = StringAlignment.Near
	      Case "Center"

textFormat.Alignment = StringAlignment.Center
	      Case "Right"
	         textFormat.Alignment = StringAlignment.Far
	   End Select
	   Select Case alignParts(1)
	      Case "Top"
	         textFormat.LineAlignment = StringAlignment.Near
	      Case "Middle"
	         textFormat.LineAlignment = StringAlignment.Center
	      Case "Bottom"
	         textFormat.LineAlignment = StringAlignment.Far
	   End Select

	   ' ----- Rotate the world if requested.
	   If (DisplayRotate.Value <> 0) Then
	      e.Graphics.RotateTransform(DisplayRotate.Value)
	   End If

	   ' ----- Draw the bounding box if requested.
	   If (ShowBoundingBox.Checked = True) Then
	      e.Graphics.DrawRectangle(Pens.Gray, textArea)
	   End If

	   ' ----- Draw the main text.
	   e.Graphics.DrawString(DisplayText.Text, mainFont, _
	      Brushes.Black, textArea, textFormat)

	   ' ----- Clean up.
	   mainFont.Dispose()
	End Sub

	Private Sub Form1_Load(ByVal sender As System.Object, _
	      ByVal e As System.EventArgs) Handles MyBase.Load
	   ' ----- Build the list of alignments.
	   DisplayAlign.Items.Add("Left,Top")
	   DisplayAlign.Items.Add("Left,Middle")
	   DisplayAlign.Items.Add("Left,Bottom")

	   DisplayAlign.Items.Add("Center,Top")
	   DisplayAlign.Items.Add("Center,Middle")
	   DisplayAlign.Items.Add("Center,Bottom")

	   DisplayAlign.Items.Add("Right,Top")
	   DisplayAlign.Items.Add("Right,Middle")
	   DisplayAlign.Items.Add("Right,Bottom")

	   DisplayAlign.SelectedIndex = 0
	End Sub
To use the program, enter some text in the TextBox field, and adjust the other controls
as desired to alter the text. Then click the Display button to refresh the displayed
text. Figure 9-26 shows
some sample text displayed through the program.
The Graphics. DrawString() method is pretty simple to use:
you pass it a text string, a position (or bounding rectangle), a font,
and a colored or patterned brush, and the text appears on the canvas.
Except for how the position and boundaries of the text are specified,
there isn’t that much flexibility in the method itself. However, there
is flexibility in the values passed to the method. Changes to the font
or font styles, as demonstrated in this code, clearly have an impact
on the results. Similarly, you can create any type of solid,
patterned, or image-based brush, and use it to draw the text
itself.
Transformations made to the canvas also impact the text output. This recipe’s code applies two transformations to the canvas: it repositions the X-Y coordinate system origin from the upper-left corner of the canvas to the center, and it rotates the canvas if requested by the user so that the text appears rotated. Recipe 9.18 discusses the reasons for these two transformations in more detail.
The Drawing.StringFormat class, used in this
sample to align the text within its bounding box, provides additional
text-drawing options. The StringFormat.FormatFlags property lets you
set options that adjust how the text appears in its bounding box. For
instance, you can indicate whether the text should automatically wrap
or not. The StringFormat.HotkeyPrefix property lets you
indicate which character should be used to draw shortcut-key
underlines below specific letters of the text, as is done using
“&” in Label and other
controls.
9.18. Rotating Text to Any Angle
Problem
You want to draw some text onto the output canvas and rotate it by a specific number of degrees.
Solution
Sample code folder: Chapter 09DrawingText
The code for Recipe 9.17 includes features that let you rotate text in 15-degree increments. The code will not be repeated in full in this recipe, but this recipe’s discussion will expand on the text-rotation features in more detail.
Discussion
The sample code in Recipe 9.17 includes two transformations to the canvas. As mentioned in other recipes, transformations impact every drawing command made to the canvas surface, preprocessing all drawing commands for size, position, and rotation before the output appears on the canvas. The sample code performs two transformations: one that repositions the (0,0) origin (or center point) from the upper-left corner of the canvas to the center of the canvas, and one that rotates the canvas by a user-specified amount. Here is the relevant code:
	' ----- Move the (0,0) origin to the center of the display.
	e.Graphics.TranslateTransform( _
	   DrawingArea.ClientRectangle.Width / 2, _
	   DrawingArea.ClientRectangle.Height / 2)

	' ----- Rotate the world if requested.
	If (DisplayRotate.Value <> 0) Then
	   e.Graphics.RotateTransform(DisplayRotate.Value)
	End If
Rotating text is a byproduct of canvas rotation; although the user sees the text rotate, your code acts as if the canvas itself is being rotated under the drawing pens. This means that it is not the text that is rotated, but the world of the canvas, and this rotation occurs around the (0,0) origin of the canvas.
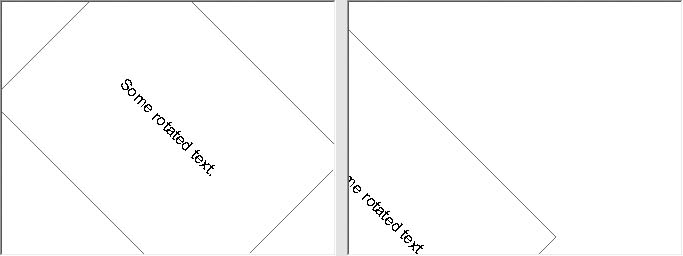
In the sample code, the goal is to rotate the text so that the
center of the text’s bounding box stays in the center of the display.
The movement of the origin through the
TranslateTransform() method call is required
to properly rotate the text about its center point. If the code had
left the origin at the upper-left corner of the canvas, the rotation
would have occurred around that point, and some rotation angles would
have moved the text right off the display. The left half of Figure 9-27 shows the out-put
of text rotated at a 45-degree angle according to the sample code: the
text rotates about its own center because the origin of the canvas
world was moved to that same position. The right half of the figure
shows what would have happened if the origin had remained at the
upper-left corner of the PictureBox
control.
Although the sample code allows rotations only in 15-degree
increments, you can pass any valid degree value to the RotateTransform() method.
See Also
Recipe 9.17 contains the code discussed in this recipe.
9.19. Mirroring Text on the Canvas
Problem
You want to mirror the text displayed on a graphics canvas.
Solution
Sample code folder: Chapter 09MirrorText
Use a custom matrix transformation through the Graphics object’s Transform property. This recipe’s sample
code mirrors text both vertically and horizontally.
Discussion
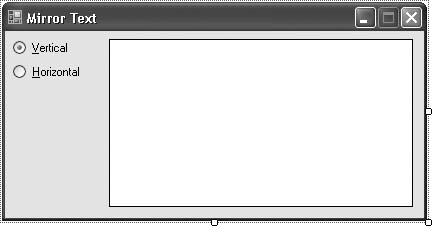
Create a new Windows Forms application, and add the following
controls to Form1:
A
RadioButtoncontrol namedVerticalMirrorSet itsTextproperty toVerticaland itsCheckedproperty toTrue.A
RadioButtoncontrol namedHorizontalMirror. Set itsTextproperty toHorizontal.A
PictureBoxcontrol namedMirroredText. Set itsBorderStyleproperty toFixedSingleand itsBackColorproperty toWhite. Size it so that it can show a sentence or two of text in either direction.
Figure 9-28 shows the layout of the controls on this form.
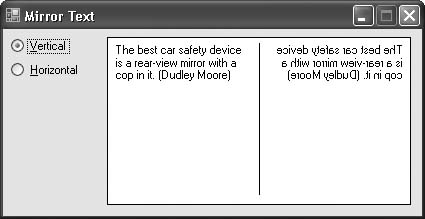
Now add the following source code to Form1’s class template:
	Private Const QuoteText As String = _
	   "The best car safety device is a rear-view mirror " & _
	   "with a cop in it. (Dudley Moore)"

	Private Sub VerticalMirror_CheckedChanged( _
	      ByVal sender As System.Object, _
 	      ByVal e As System.EventArgs) _
	      Handles VerticalMirror.CheckedChanged
	   ' ----- Update the display. This event indirectly
	   '       handles both radio buttons.
	   MirroredText.Invalidate()
	End Sub

	Private Sub MirroredText_Paint(ByVal sender As Object, _
	      ByVal e As System.Windows.Forms.PaintEventArgs) _
	      Handles MirroredText.Paint
	   ' ----- Draw the text and its reverse.
	   Dim drawingArea As Rectangle
	   Dim saveState As Drawing2D.GraphicsState
	   Dim mirrorMatrix As Drawing2D.Matrix

	   ' ----- Clear the background.
	   e.Graphics.Clear(Color.White)

	   ' ----- Deterine the drawing area.
	   If (VerticalMirror.Checked = True) Then
	      ' ----- Put text on the left and right of the mirror.
	      drawingArea = New Rectangle(5, 5, _
	         (MirroredText.ClientRectangle.Width  2) - 10, _
	         MirroredText.ClientRectangle.Height - 10)

	      ' ----- Draw the mirror line.
	      e.Graphics.DrawLine(Pens.Black, _
	         MirroredText.ClientRectangle.Width  2, _
	         5, MirroredText.ClientRectangle.Width  2, _
	         MirroredText.ClientRectangle.Height - 10)
	   Else
	      ' ----- Put text on the top and bottom of the mirror.
	      drawingArea = New Rectangle(5, 5, _
	         MirroredText.ClientRectangle.Width - 10, _
	         (MirroredText.ClientRectangle.Height  2) - 10)

	      ' ----- Draw the mirror line.
	      e.Graphics.DrawLine(Pens.Black, 5, _
	         MirroredText.ClientRectangle.Height  2, _
	         MirroredText.ClientRectangle.Width - 10, _
	         MirroredText.ClientRectangle.Height  2)
	   End If

	   ' ----- Draw the text.
	   e.Graphics.DrawString(QuoteText, MirroredText.Font, _
	      Brushes.Black, drawingArea)

	   ' ----- Mirror the display.
	   saveState = e.Graphics.Save()
	   If (VerticalMirror.Checked = True) Then
	      mirrorMatrix = New Drawing2D.Matrix(-1, 0, 0, 1, _
	         MirroredText.ClientRectangle.Width, 0)
	   Else
	      mirrorMatrix = New Drawing2D.Matrix(1, 0, 0, -1, _
	         0, MirroredText.ClientRectangle.Height)
	   End If
	   e.Graphics.Transform = mirrorMatrix

	   ' ----- Draw the text, this time, mirrored.
	   e.Graphics.DrawString(QuoteText, MirroredText.Font, _
	      Brushes.Black, drawingArea)

	   ' ----- Undo the mirror.
	   e.Graphics.Restore(saveState)
	End Sub
Run the program, and use the RadioButton controls to adjust the direction
of the mirror. Figure
9-29 shows the mirror in the vertical orientation.
The Graphics object includes methods that perform
basic scaling ( ScaleTransform())), repositioning ( TranslateTransform()), and rotating
transformations ( RotateTransform())). While these
transformations all seem quite different from each other, they all
actually use the same method to accomplish the canvas-level
adjustments. Each method sets up a matrix
transformation, a mathematical construct that maps points
in one coordinate system to another through a basic set of operations.
In college-level math courses, this system generally appears under the
topic of Linear Algebra.
In addition to the predefined transformations, you can define your own matrix calculation to transform the output in any way you need. This recipe’s sample code applies a custom matrix that reverses all coordinate system points in either the horizontal or vertical direction. The intricacies of matrix transformations and cross products are beyond the scope of this book. You can find some basic discussions of the math involved by searching for “matrix transformations” in the Visual Studio online help.
9.20. Getting the Height and Width of a Graphic String
Problem
You want to know how many pixels a text string will require in both the horizontal and vertical directions.
Solution
Sample code folder: Chapter 09MeasuringText
GDI+ includes several features that let you examine the width
and height of a string. Graphics.MeasureString() is a general-purpose
text-measurement method that bases its measurements on a font you pass
to it:
	Dim result As SizeF = _
	   e.
Graphics.MeasureString("How big am I?", Me.Font, _
	   Me.ClientRectangle.Width)
	MsgBox("Width = " & result.Width & vbCrLf & _
	   "Height = " & result.Height)
On our system, using the default form font of Microsoft Sans Serif 8.25 Regular, the message box displays the following response:
Width = 75.71989Height = 13.8252
Discussion
Font measurement is tricky. Fonts are more than just the width and height of their letters. The height is a combination of the core height, plus the height of ascenders (the part of the letter “d” that sticks up) and descenders (the part of the letter “p” that sticks down). The width of a character string is impacted by kerning, the adjustment of two letters that fit together better than others. To get a flavor of some of these measurements, consider the following code:
	Public Class Form1
	   Private Sub PictureBox1_Paint(ByVal sender As Object, _
	         ByVal e As System.Windows.Forms.PaintEventArgs) _
	         Handles PictureBox1.Paint
	      ' ----- Show vertical font measures.
	      Dim textArea As SizeF
	      Dim linePen As Pen
	      Dim largeFont As Font
	      Dim fontRatio As Single
	      Dim ascentSize As Single
	      Dim descentSize As Single
	      Dim emSize As Single
	      Dim cellHeight As Single
	      Dim internalLeading As Single
	      Dim externalLeading As Single

	      ' ----- Create the font to use for drawing.
	      '       Using "AntiAlias" to enable text smoothing
	      '       will result in more precise output.
	      e.Graphics.TextRenderingHint = _
	         Drawing.Text.TextRenderingHint.AntiAlias
	      largeFont = New Font("Times New Roman", 96, _
	         FontStyle.Regular)

	      ' ----- Fonts are measured in design units. We need to
	      '       convert to pixels to mix measurement systems.
	      '       Determine the ratio between the display line
	      '       height and the font design's line height.
	      fontRatio = largeFont.Height / _
	         largeFont.FontFamily.GetLineSpacing( _
	         FontStyle.Regular)

	      ' ----- Get the measurements.
	      textArea = e.
Graphics.MeasureString("Ag", largeFont)

	      ' ----- Offset everything for simplicity.
	      e.Graphics.TranslateTransform(20, 20)

	      ' ----- Draw the text.
	      e.Graphics.DrawString("Ag", largeFont, _
	      Brushes.Black, 0, 0)

	      ' ----- Create a line-drawing pen.
	      linePen = New Pen(Color.Gray, 1)
	      linePen.DashStyle = Drawing2D.DashStyle.Dash

	      ' ----- Calculate all of the various font measurements.
	      ascentSize = largeFont.FontFamily.GetCellAscent( _
	         FontStyle.Regular) * fontRatio
	      descentSize = largeFont.FontFamily.GetCellDescent( _
	         FontStyle.Regular) * fontRatio
	      emSize = largeFont.FontFamily.GetEmHeight( _
	         FontStyle.Regular) * fontRatio
	      cellHeight = ascentSize + descentSize
	      internalLeading = cellHeight - emSize
	      externalLeading = _
	         (largeFont.FontFamily.GetLineSpacing( _
	         FontStyle.Regular) * fontRatio) - cellHeight

	      ' ----- Draw the top and bottom lines.
	      e.Graphics.DrawLine(linePen, 0, 0, textArea.Width, 0)
	      e.Graphics.DrawLine(linePen, 0, textArea.Height, _
	         textArea.Width, textArea.Height)

	      ' ----- Draw the ascender and descender areas.
	      e.Graphics.DrawLine(linePen, 0, _
	         ascentSize, textArea.Width, ascentSize)
	      e.Graphics.DrawLine(linePen, 0, _
	         ascentSize + descentSize, textArea.Width, _
	         ascentSize + descentSize)

	      ' ----- Clean up.
	      linePen.Dispose()
	      largeFont.Dispose()
	      e.Graphics.ResetTransform()
	   End Sub
	End Class
We added this code to a form with a single PictureBox control. The results appear in
Figure 9-30.
The four lines from top to bottom are as follows:
The top of the “line height” box
The baseline, based on the ascender height
The bottom of the descender
The bottom of the “line height” box
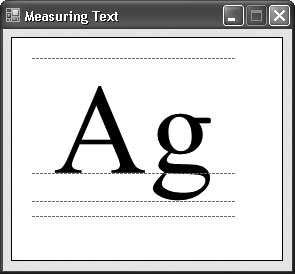
The code also includes calculations for other measurements, although they are not used in the output.
9.21. Drawing Text with Outlines and Drop Shadows
Problem
You want to draw some text but display only its outline, and you want the text to have a drop shadow.
Solution
Sample code folder: Chapter 09OutlineText
Use a GraphicsPath object to record the outside
edge of a text string, and then use that outside edge, or
path, to draw the actual drop shadow and outline
elements.
Discussion
Create a new Windows Forms application, and add a PictureBox control named PictureBox1 to the form. Set this control’s
BackColor property to White and its BorderStyle property to FixedSingle. Give it a size of approximately
400,150. Now add the following
source code to the form’s class template:
	Private Sub PictureBox1_Paint(ByVal sender As Object, _
	      ByVal e As System.Windows.Forms.PaintEventArgs) _
	      Handles PictureBox1.Paint
	   ' ----- Draw text using an outline.

	   Dim outlinePath As New Drawing2D.GraphicsPath
	   Dim useFont As Font

	   ' ----- Make some output adjustments to get a better
	   ' outline.
	   e.Graphics.TextRenderingHint = _
	      Drawing.Text.TextRenderingHint.AntiAlias
	   e.Graphics.SmoothingMode = _
	      Drawing2D.SmoothingMode.AntiAlias

	   ' ----- Draw the text into a path.
	   useFont = New Font("Times New Roman", _
	      96, FontStyle.Regular)
	   outlinePath.AddString("Outline", useFont.FontFamily, _
	      FontStyle.Regular, 96, New Point(0, 0), _
	      StringFormat.GenericTypographic)
	   useFont.Dispose()

	   ' ----- Replay the path to draw a drop shadow.
	   e.Graphics.TranslateTransform(25, 25)
	   e.Graphics.FillPath(Brushes.LightGray, outlinePath)

	   ' ----- Replay the path to the surface.
	   e.Graphics.TranslateTransform(-5, -5)
	   e.Graphics.FillPath(Brushes.White, outlinePath)
	   e.Graphics.DrawPath(Pens.Black, outlinePath)

	   ' ----- Finished.
	   outlinePath.Dispose()
	End Sub
Running this program displays the outline and drop shadow shown in Figure 9-31.
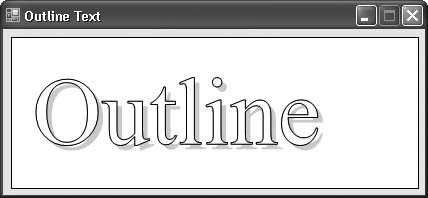
While the Font class includes
support for italic, bold, strikeout, and underline for-matting, it
does not include features that automatically enable outlining or drop
shadows. However, you can enable these features yourself using a
GraphicsPath object. A
graphics path is like a tape recording of a set
of drawing commands that records the outline of the drawn elements.
You use the GraphicsPath’s drawing
methods to record the outlines of shapes and text strings in the path.
You can then later use this path like a macro that can be replayed on
the graphics surface.
The GraphicsPath object’s
AddString() method adds the outer
edge of all characters in the supplied text string to the path. There
are additional methods that let you include other shapes, such as
AddLine(), AddRectangle(), and
AddEllipse().
See Also
Recipe 9.17 includes some similar alignment and rotation features.
9.22. Calculating a Nice Axis
Problem
You want to create a chart with a “nice” axis; that is, one with reasonable scaling numbers for a given number of tick marks and with a reasonably rounded increment for each tick value. These scale values should be chosen so the range of data points spans most of the length of the axis.
Solution
Sample code folder: Chapter 09NiceAxis
Use the NiceAxis() function
presented here to calculate a reasonable axis given the minimum and
maximum values of the data and the number of ticks along the
axis.
Discussion
This function was created to solve the tricky problem of determining a reasonable plotting axis for a range of numbers. When manually determining a scale, it’s easy to accidentally scrunch the data points too closely by choosing a scale with larger than necessary values or a scale with awkward fractional values at each tick mark that make mental interpolation of intermediate values nearly impossible.
This function solves these problems by automatically choosing reasonable values for a chart’s axis. In many cases you will want to call this function twice, once for the X-axis and once for the Y-axis.
Pass this function the minimum and maximum data values to be
plotted, and the number of divisions or tick marks along the axis. The
calculations in the function iterate to find division steps that are
reasonable and that still allow all data points to fall within the
range of the axis. Here’s the code for the NiceAxis() function:
	Public Function NiceAxis(ByVal minimumValue As Double, _
	      ByVal maximumValue As Double, _
	      ByVal divisions As Double) As Double()
	   ' ----- Determine reasonable tick marks along an axis.

	   '         Returns an array of three values:
	   '         0) minimum tick value
	   '         1) maximum tick value
	   '         2) tick mark step size
	   Dim axis(2) As Double
	   Dim trialDivisionSize As Double
	   Dim modFourCount As Double = 1
	   Dim divisionSize As Double

	   ' ----- Get the starting values.
	   divisionSize = (maximumValue - minimumValue) / divisions
	   trialDivisionSize = 10 ^ Int(Math.Log10(divisionSize))

	   ' ----- Iterate until we arrive at reasonable values.
	   Do While (maximumValue > (trialDivisionSize * _
	         Int(minimumValue / trialDivisionSize) + _
	         divisions * trialDivisionSize))
	      modFourCount += 1
	      If ((modFourCount Mod 4) > 0) Then
	         trialDivisionSize = 8 * trialDivisionSize / 5
	      End If
	      trialDivisionSize = 5 * trialDivisionSize / 4
	   Loop

	   ' ----- Return the results.
	   axis(0) = trialDivisionSize * _
	      Int(minimumValue / trialDivisionSize)
	   axis(1) = axis(0) + divisions * trialDivisionSize
	   axis(2) = (axis(1) - axis(0)) / divisions
	   Return axis
	End Function
This function shows a good example of returning an array. In this case the array returns the minimum and maximum values for the ends of the nice axis, and the step size for the numbers along the tick marks or divisions along the axis.
The following code provides a working example. NiceAxis() is called with minimum and
maximum data values of –3.4 and 3.27, and 10 tick marks are requested
along the scale of this axis. As shown in Figure 9-32, the function
returns the nearest whole-number values for each end of the axis (–4
and 6) and a recommended whole step size of 1 for each tick
mark:
	Dim result As New System.Text.StringBuilder
	Dim axis() As Double = NiceAxis(-3.4, 3.27, 10)

	result.AppendLine("Minimum Value: -3.4")
	result.AppendLine("Maximum Value: 3.27")
	result.AppendLine("Divisions: 10")
	result.AppendLine()

	result.Append("Axis Minimum: ")
	result.AppendLine(axis(0).ToString)
	result.Append("Axis Maximum: ")

	result.AppendLine(axis(1).ToString)
	result.Append("Division Steps: ")
	result.AppendLine(axis(2).ToString)

	MsgBox(result.ToString())
9.23. Drawing a Simple Chart
Problem
You want to create your own data charts, and you would like to have code for a sample chart as a starting point for your own customizations.
Solution
Sample code folder: Chapter 09 DrawingCharts
The simple chart presented in this recipe should provide plenty of creative ideas and useful techniques for designing your own custom charts.
Discussion
The chart presented here provides a good starting point for
drawing your own charts, but it shouldn’t be used as presented. For
one thing, the data values are hard-coded into an array in the form’s
Paint event, and you’ll likely want
to pass in your own data for plotting. The goal of this example is to
present several graphics techniques in an easy-to-follow way.
As in most of the graphics examples in this chapter, the drawing
takes place in the form’s Paint
event. The graphics drawing surface is referenced for easy use of its
drawing methods:
	Private Sub Form1_Paint(ByVal sender As Object, _
	      ByVal e As System.Windows.Forms.PaintEventArgs) _
	      Handles Me.Paint

	   ' ----- Draw a nice chart.
	    Dim canvas As Graphics = e.Graphics
For demonstration purposes, an array of Y data point values is hardcoded in this routine, and the corresponding X values are assumed to be evenly spaced 10 units apart in the range 0 to 100:
	   ' ----- Create an array of data points to plot.
	   Dim chartData() As Single = _
	      {20, 33, 44, 25, 17, 24, 63, 75, 54, 33}
We’ll use three pens: a red one, a black one, and a gray one. By setting each pen’s widths to –1, we guarantee the sketched lines to be one pixel wide even if the scaling changes, and in this example we do change the scaling to plot the entire chart on the form no matter what size the window is stretched to:
	   ' ----- Create some pens.
	   Dim penRed As New Pen(Color.Red, -1)
	   Dim penBlack As New Pen(Color.Black, -1)
	   Dim penShadow As New Pen(Color.Gray, -1)
The next lines create the font and brush used to draw the axis numbers along the tick marks. The font size is relative to the chart scaling, which means that as the chart window is resized, the numbers along the axis will grow and shrink proportionately:
	   ' ----- Prepare to add labels.
	   Dim labelFont As New Font("Arial", 3, FontStyle.Regular)
	   Dim labelBrush As New SolidBrush(Color.Blue)
Several variables are used during the scaling process and to plot the data points:
	   ' ----- Used to plot the various elements.
	   Dim x1, y1 As Single 'Lower left corner
	   Dim x2, y2 As Single 'Upper right corner
	   Dim scaleX, scaleY As Single
	   Dim xScan, yScan As Single
	   Dim oneBar As RectangleF
The chart is drawn in a rectangle from 0 to 100 in both the X
and Y directions. By scaling the graphics surface from –10 to 110, a
margin is left for the axis labels. By default, the Y scaling of a
graphics surface starts at the top-left corner and increases as you
move down in the area. A standard X-Y chart assumes an origin in the
bot-tom-left corner, with increasing values going up the graphics
surface. This requires the Y scaling factor in the ScaleTransform() method to be a negative
value, which inverts the scale. Also, once inverted, the scale origin
needs to be shifted, or trans-lated, appropriately to relocate the
origin to the bottom left of the graphics surface. This is
accomplished using the Graphics
object’s TranslateTransform() method:
	   ' ----- Set the scaling.
	   x1 = -10
	   y1 = -10
	   x2 = 110
	   y2 = 110
	   scaleX = Me.ClientSize.Width / (x2 - x1)
	   scaleY = Me.ClientSize.Height / (y2 - y1)
	   canvas.ScaleTransform(scaleX, -scaleY) '(inverted)
	   canvas.TranslateTransform(-x1, -y2) '(inverted)
The chart’s background color, outline, and gridlines are drawn in the following lines of code:
	   ' ----- Color the background.
	   canvas.Clear(Color.Cornsilk)

	   ' ----- Draw chart outline rectangle.
	   canvas.DrawRectangle(penBlack, New Rectangle(0, 0, 100, 100))

	   ' ----- Draw the chart grid.
	   For xScan = 10 To 90 Step 10
	      canvas.DrawLine(penBlack, xScan, 0, xScan, 100)
	   Next xScan
	   For yScan = 10 To 90 Step 10
	      canvas.DrawLine(penBlack, 0, yScan, 100, yScan)
	   Next yScan
We’ll use a 3D shadowed effect to draw the vertical data bars. First, draw each bar using a transparent shade of gray. To create the transparent gray color, set the alpha component of the solid brush’s color to 127. As you can see in Figure 9-33, the gridlines show through the transparent “shadows” created by these rectangles.
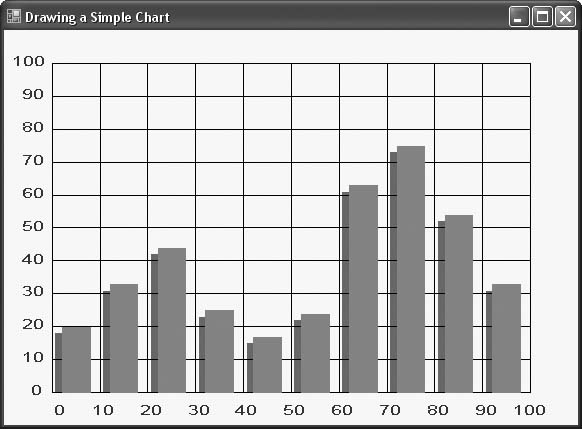
The data bar rectangles (they’re actually red) are then drawn on top of and slightly above and to the right of the transparent gray bars. This results in a nice 3D shadowed effect:
	   ' ----- Draw some shadowed bars.
	   For xScan = 0 To 90 Step 10
	      ' ----- Draw the shadow first.
	      oneBar.X = xScan + 0.6
	      oneBar.Y = 0
	      oneBar.Width = 6
	      oneBar.Height = chartData(xScan  10) - 2
	      canvas.FillRectangle(New SolidBrush(Color.FromArgb(127, _
	         Color.Gray)), oneBar)

	      ' ----- Now draw the bars in front.
	      oneBar.X = xScan + 2
	      oneBar.Y = 0
	      oneBar.Height = chartData(xScan  10)
	      canvas.FillRectangle(New SolidBrush(Color.Red), oneBar)
	   Next xScan
When drawing text, a complication arises if the scaling has been inverted: the text is drawn upside down! This might be useful in some situations, but to get the labels correct on this chart, the Y scaling transform must be reinverted to correctly plot the tick-mark numbers:
	   ' ----- Need to un-invert the scaling so text labels are
	   '       right-side-up.
	   canvas.ResetTransform()
	   canvas.ScaleTransform(ScaleX, ScaleY)
	   canvas.TranslateTransform(-x1, -y1)
Each number along the X and Y axes is drawn using the Graphics object’s
DrawString() method. Parameters passed to
this method include the string to draw, the font for the text, the
brush for the text’s color, and the coordinates at which to start
drawing the string. These coordinates are not pixel locations, because
the graphics have been scaled using transforms. Instead, they are
relative positions or units within the scaled world. This causes the
text to be plotted in the correct relative position, no matter what
size the window is stretched to:
	   ' ----- Label the Y-axis.
	   For yScan = 0 To 100 Step 10
	      canvas.DrawString(yScan.ToString, labelFont, labelBrush, _
	         -2 * yScan.ToString.Length - 3, 97 - yScan)
	   Next yScan

	   ' ----- Label the X-axis.
	   For xScan = 0 To 100 Step 10
	      canvas.DrawString(xScan.ToString, labelFont, labelBrush, _
	         xScan + 1.7 - 2 * xScan.ToString.Length, 103)
	   Next xScan
The last step is to clean up all of the graphics objects we’ve created:
	   ' ----- Clean up.
	   labelFont.Dispose()
	   labelBrush.Dispose()
	   penRed.Dispose()
	   penBlack.Dispose()
	   penShadow.Dispose()
	   canvas = Nothing
	End Sub
Figure 9-33 shows
the chart drawn on the form as a result of the previous code. Set-ting
the form’s DoubleBuffered property
to True ensures that the chart is
drawn smoothly and continuously as the form is resized when the
following code is included:
	Private Sub Form1_Resize(ByVal sender As Object, _
	      ByVal e As System.EventArgs) Handles Me.Resize
	   ' ----- Refresh on resize.
	   Me.Refresh()
	End Sub
9.24. Creating Odd-Shaped Forms and Controls
Problem
You’re tired of the plain rectangular forms and controls. You want to use irregular shapes for your form and the controls included on it.
Solution
Sample code folder: Chapter 09IrregularShapes
Use a GraphicsPath object to
define the new drawing and clipping region for the form and controls.
This recipe’s code uses an ellipse to define the boundaries of a form
and a control.
Discussion
Create a new Windows Forms application, and add a Button control named ActClose. Set its Text property to Close, and put the button somewhere in the
middle of the form. Then add the following source code to the form’s
class template:
	Private Sub ActClose_Click(ByVal sender As System.Object, _
	      ByVal e As System.EventArgs) Handles ActClose.Click
	   ' ----- Close the form.
	   Me.Close()
	End Sub

	Private Sub Form1_Load(ByVal sender As System.Object, _
	      ByVal e As System.EventArgs) Handles MyBase.Load

	   ' ----- Change the shape of the form and button.
	   Dim finalShape As Region
	   Dim shapePath As Drawing2D.GraphicsPath

	   ' ----- Reshape the form.
	   shapePath = New Drawing2D.GraphicsPath()
	   shapePath.AddEllipse(0, 0, Me.Width, Me.Height)
	   finalShape = New Region(shapePath)
	   Me.Region = finalShape
	   shapePath.Dispose()

	   ' ----- Reshape the button.
	   shapePath = New Drawing2D.GraphicsPath()
	   shapePath.AddEllipse(0, 0, ActClose.Width, ActClose.Height)
	   finalShape = New Region(shapePath)
	   ActClose.Region = finalShape
	   shapePath.Dispose()
	End Sub
When you run the program, both the form and the button appear with elliptical shapes. Figure 9-34 shows the form in use. We left the Visual Studio view of the source code in the background so that you can see the nonrectangular shape of the form.
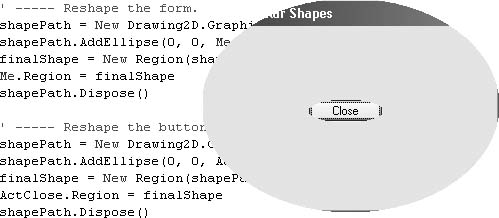
So what shapes can you use? If you can build it into a GraphicsPath object, you can use it to
define the boundaries of your form or control. Replacing the form or
control’s Region property results
in a new clipping region for the form (the clipping region is the area
outside which the form is not drawn; it’s not just hidden, it actually
doesn’t exist).
Since the new region indicates only which portions of the form
are drawn or not, you’ll find that any normal form or control
components that reside only partially within the clipping region will
appear cut off. Unfortunately, the result can be some-what ugly. For
example, the elliptical button created by this recipe’s sample code
doesn’t look very good because portions of the original rectangular
border still appear. You can also still see small portions of the form
border. In addition to providing a custom region, you may want to
provide custom drawing code for the control or form in its Paint event handler. For forms, setting the
FormBorderStyle to None lets you supply your own form
border.
Another way to change the shape of a form is by making a portion
of the form invisible. This is done by setting a specific form
color to the invisible color using the form’s TransparencyKey property.
See Also
Recipe 9.10 shows how to use transparency to make a portion of a form invisible.
9.25. Using the RGB, HSB (HSV), and HSL Color Schemes
Problem
You want to provide the user with options for color selection: RGB (red-green-blue), HSB (hue-saturation-brightness, also known as HSV for hue-saturation-value), and HSL (hue-saturation-luminosity).
Solution
Sample code folder: Chapter 09RGBandHSV
The easiest way to provide user-based color selection is to use
the ColorDialog control to prompt the user to
choose a color. This standard Windows dialog includes fields for RGB
numeric entry and for HSL entry. Each of the HSL scales ranges from 0
to 240 (239 for hue), and changes to those fields automatically update
the displayed RBG values (see Figure 9-35).
The ColorDialog control is
described in Recipe
9.3.
In addition to the ColorDialog control, the new .NET System.Drawing.Color structure provides
access to many predefined colors, plus methods to specify and obtain
color values. Three of its methods let you convert an instance’s RBG
value to distinct HSB values:
The
GetHue()method returns a value from 0 to 360 that indicates the hue of theColorobject’s current color.The
GetSaturation()method returns a value from 0.0 to 1.0 for the active color, in which 0.0 indicates the neutral grayscale value, and 1.0 is the most saturated value.The
GetBrightness()method returns a value from 0.0 (black) to 1.0 (white).
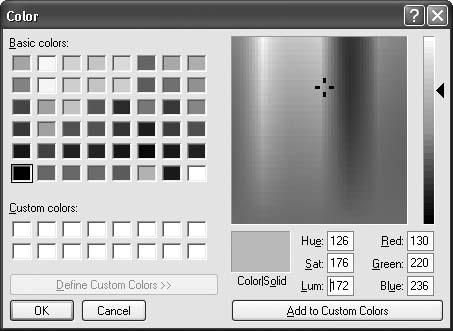
This recipe’s sample code lets the user select a color using either the RBG method or the HSB (a.k.a. HSV) method.
Discussion
Create a new Windows Forms application, and add the following
controls to Form1:
Three
HScrollBarcontrols with the namesValueRed, ValueGreen, andValueBlue. Set theirMaximumproperties to255.One
HScrollBarcontrol namedValueHue. Set itsMaximumproperty to360.Two
HScrollBarcontrols with the namesValueSaturationandValueBrightness. Set theirMaximumproperties to100.A
PictureBoxcontrol namedShowColor.Six Label controls with the names
NumberRed, NumberGreen, NumberBlue, NumberHue,
            NumberSaturation
, andNumberBrightness. Set theirTextproperties to 0.
Add descriptive labels if desired. The form should look like Figure 9-36.
Now add the following source code to the form’s class template:
	Private Sub RBG_Scroll(ByVal sender As System.Object, _
	      ByVal e As System.Windows.Forms.ScrollEventArgs) _
	      Handles ValueRed.Scroll, ValueGreen.Scroll, _
	      ValueBlue.Scroll
	   ' ----- Update the HSV values based on RBG.
	   Dim
rgbColor As Color

	   ' ----- The
color structure already has the formulas
	   ' built in.

rgbColor = Color.FromArgb(0, ValueRed.Value, _
	      ValueGreen.Value, ValueBlue.Value)
	   ValueHue.Value = CInt(rgbColor.GetHue())
	   ValueSaturation.Value = _
	      CInt(rgbColor.GetSaturation() * 100.0F)
	   ValueBrightness.Value = _
	      CInt(rgbColor.GetBrightness() * 100.0F)

	   ' ------ Refresh everything else.
	   RefreshDisplay()
	End Sub

	Private Sub ValueHue_Scroll(ByVal sender As Object, _
	      ByVal e As System.Windows.Forms.ScrollEventArgs) _
	      Handles ValueHue.Scroll, ValueSaturation.Scroll, _
	      ValueBrightness.Scroll
	   ' ----- Update the RBG values based on HSV.
	   Dim useRed As Integer
	   Dim useGreen As Integer
	   Dim useBlue As Integer
	   Dim useHue As Single
	   Dim useSaturation As Single
	   Dim useBrightness As Single
	   Dim hueSector As Integer
	   Dim factor As Single
	   Dim target1 As Single
	   Dim target2 As Single
	   Dim target3 As Single

	   ' ----- Convert to relative 0.0 to 1.0 values.
	   useHue = CSng(ValueHue.Value)
	   useSaturation = CSng(ValueSaturation.Value) / 100.0F
	   useBrightness = CSng(ValueBrightness.Value) / 100.0F

	   If (useSaturation = 0.0F) Then
	      ' ----- Pure grayscale.
	      useRed = CInt(useBrightness * 255)
	      useGreen = useRed
	      useBlue = useRed
	   Else
	      hueSector = CInt(useHue / 60.0F)
	      factor = Math.Abs((useHue / 60.0F) - CSng(hueSector))
	      target1 = useBrightness * (1 - useSaturation)
	      target2 = useBrightness * (1 - (factor * useSaturation))
	      target3 = useBrightness * (1 - ((1 - factor) * _
	         useSaturation))

	      Select Case hueSector
	         Case 0, 6
	            useRed = CInt(useBrightness * 255.0F)
	            useGreen = CInt(target3 * 255.0F)
	            useBlue = CInt(target1 * 255.0F)
	         Case 1
	            useRed = CInt(target2 * 255.0F)
	            useGreen = CInt(useBrightness * 255.0F)
	            useBlue = CInt(target1 * 255.0F)
	         Case 2
	            useRed = CInt(target1 * 255.0F)
	            useGreen = CInt(useBrightness * 255.0F)
	            useBlue = CInt(target3 * 255.0F)
	         Case 3
	            useRed = CInt(target1 * 255.0F)
	            useGreen = CInt(target2 * 255.0F)
	            useBlue = CInt(useBrightness * 255.0F)
	         Case 4
	            useRed = CInt(target3 * 255.0F)
	            useGreen = CInt(target1 * 255.0F)
	            useBlue = CInt(useBrightness * 255.0F)
	         Case 5
	            useRed = CInt(useBrightness * 255.0F)
	            useGreen = CInt(target1 * 255.0F)
	            useBlue = CInt(target2 * 255.0F)
	      End Select
	   End If

	   ' ----- Update the
RGB values.
	   ValueRed.Value = useRed
	   ValueGreen.Value = useGreen
	   ValueBlue.Value = useBlue

	   ' ------ Refresh everything else.
	   RefreshDisplay()
	End Sub

	Private Sub RefreshDisplay()
	   ' ----- Update the numeric display.
	   NumberRed.Text = CStr(ValueRed.Value)
	   NumberGreen.Text = CStr(ValueGreen.Value)
	   NumberBlue.Text = CStr(ValueBlue.Value)
	   NumberHue.Text = CStr(ValueHue.Value)
	   NumberSaturation.Text = _
	      Format(CDec(ValueSaturation.Value) / 100@, "0.00")
	   NumberBrightness.Text = _
	      Format(CDec(ValueBrightness.Value) / 100@, "0.00")

	   ' ----- Update the
color sample.
	   ShowColor.BackColor = Color.FromArgb(255, _
	      ValueRed.Value, ValueGreen.Value, ValueBlue.Value)
	End Sub

	Private Sub Form1_Load(ByVal sender As System.Object, _
	      ByVal e As System.EventArgs) Handles MyBase.Load
	   ' ----- Set the initial color.
	   RBG_Scroll(ValueRed, _
	      New Windows.Forms.ScrollEventArgs( _
	      ScrollEventType.EndScroll, 0))
	End Sub
Run the program, and use the six scrollbars to adjust the color selection.
The RGB model for describing colors numerically has become common for use in Microsoft Windows, but it is not always the most convenient method for certain applications or for output to devices other than computer monitors. The HSB/HSV system is more useful in selecting colors for computer-based artwork.
The System.Drawing.Color
structure includes methods that let you extract the HSB components of
an RGB color, but it doesn’t work in the other direction.
Therefore, the sample code includes the calculation for HSB-to-RGB
conversions.
See Also
A useful web site that discusses color models is EasyRGB, found at http://www.easyrgb.com.
See Recipe 9.3
for details on using the ColorDialog control.
9.26. Creating a Rubber-Band Rectangular Selection
Problem
You want to add " rubber-band selection” to your graphics, giving the user the ability to click and drag with the mouse to select a rectangular region of an image.
Solution
Sample code folder: Chapter 09RubberBand
Use the RubberBand class
presented here to use one of three different-appearing rubber-band selection algorithms.
Discussion
You’ve probably seen rubber-band selection in action when cropping images or
working with screen-grabbing programs, paint programs, and so on. The
RubberBand class presented here can
be included in any project in which you want to let the user select a
rectangular area of an image in this way.
The complete code for the class is presented below. The RubberBandStyle enumeration and the public
Style property work together to let
you set the RubberBand object’s
appearance while in operation. While the user drags the mouse, the
selected area is outlined with either a dashed-line rectangle (as in
Figure 9-37, below), a
solid line with inverted colors, or a solid-filled box with inverted
colors.
There are two overloaded constructors in this class, which let
you instantiate a RubberBand object
in three different ways. (The plan was to have only one constructor
with two optional arguments, but Visual Basic does not permit
structure objects—Color, in this
case—to be optional.) You can set the RubberBand’s Style and BackColor properties when you create the
object, or you can set these properties later. You do need to indicate
the control on which the RubberBand
is to operate, so the painting on the screen can coordinate with the
surface of the control. The Start(),
Stretch(), and Finish()
methods are called from the program that creates the RubberBand object to update the rectangular
selection. Once “rubberbanding” is complete, the Rectangle property returns the results.
These methods are demonstrated in the calling code presented
later.
Here’s the code for the RubberBand class:
	Public Class RubberBand
	   ' ----- The three types of rubber bands.
	   Public Enum RubberBandStyle
	      DashedLine
	      ThickLine
	      SolidBox
	   End Enum

	   ' ----- The current drawing state.
	   Public Enum RubberBandState
	      Inactive
	      FirstTime
	      Active
	   End Enum

	   ' ----- Class-level variables.
	   Private BasePoint As Point
	   Private ExtentPoint As Point
	   Private CurrentState As RubberBandState
	   Private BaseControl As Control
	   Public Style As RubberBandStyle
	   Public BackColor As Color
	   Public Sub New(ByVal useControl As Control, _
	         Optional ByVal useStyle As RubberBandStyle = _
	         RubberBandStyle.DashedLine)
	      ' ----- Constructor with one or two parameters.
	      BaseControl = useControl
	      Style = useStyle
	      BackColor = Color.Black
	   End Sub

	   Public Sub New(ByVal useControl As Control, _
	         ByVal useStyle As RubberBandStyle, _
	         ByVal useColor As Color)
	      ' ----- Constructor with three parameters.
	      BaseControl = useControl
	      Style = useStyle
	      BackColor = useColor
	   End Sub

	   Public ReadOnly Property Rectangle() As Rectangle
	      Get
	         ' ----- Return the bounds of the
rubber-band area.
	         Dim result As Rectangle

	         ' ----- Ensure the coordinates go left to
	         ' right, top to bottom.
	         result.X = IIf(BasePoint.X < ExtentPoint.X, _
	            BasePoint.X, ExtentPoint.X)
	         result.Y = IIf(BasePoint.Y < ExtentPoint.Y, _
	            BasePoint.Y, ExtentPoint.Y)
	         result.Width = Math.Abs(ExtentPoint.X - BasePoint.X)
	         result.Height = Math.Abs(ExtentPoint.Y - BasePoint.Y)
	         Return result
	      End Get
	   End Property

	   Public Sub Start(ByVal x As Integer, ByVal y As Integer)
	      ' ----- Start drawing the rubber band. The user must
	      '       call Stretch() to actually draw the first
	      '       band image.
	      BasePoint.X = x
	      BasePoint.Y = y
	      ExtentPoint.X = x
	      ExtentPoint.Y = y
	      Normalize(BasePoint)
	      CurrentState = RubberBandState.FirstTime
	   End Sub

	   Public Sub Stretch(ByVal x As Integer, ByVal y As Integer)
	      ' ----- Change the size of the rubber band.
	      Dim newPoint As Point

	      ' ----- Prepare the new stretch point.
	      newPoint.X = x
	      newPoint.Y = y
	      Normalize(newPoint)

	      Select Case CurrentState
	         Case RubberBandState.Inactive
	            ' ----- Rubber band not in use.
	            Return
	         Case RubberBandState.FirstTime
	            ' ----- Draw the initial rubber band.
	            ExtentPoint = newPoint
	            DrawTheRectangle()
	            CurrentState = RubberBandState.Active
	         Case RubberBandState.Active
	            ' ----- Undraw the previous band, then
	            '       draw the new one.
	            DrawTheRectangle()
	            ExtentPoint = newPoint
	            DrawTheRectangle()
	      End Select
	   End Sub

	   Public Sub Finish()
	      ' ----- Stop drawing the rubber band.
	      DrawTheRectangle()
	      CurrentState = 0
	   End Sub

	   Private Sub Normalize(ByRef whichPoint As Point)
	      ' ----- Don't let the rubber band go outside the view.
	      If (whichPoint.X < 0) Then whichPoint.X = 0
	      If (whichPoint.X >= BaseControl.ClientSize.Width) _
	         Then whichPoint.X = BaseControl.ClientSize.Width - 1

	      If (whichPoint.Y < 0) Then whichPoint.Y = 0
	      If (whichPoint.Y >= BaseControl.ClientSize.Height) _
	         Then whichPoint.Y = BaseControl.ClientSize.Height - 1
	   End Sub

	   Private Sub DrawTheRectangle()
	      ' ----- Draw the rectangle on the control or
	      '       form surface.
	      Dim drawArea As Rectangle
	      Dim screenStart, screenEnd As Point

	      ' ----- Get the square that is the
rubber-band area.
	      screenStart = BaseControl.PointToScreen(BasePoint)
	      screenEnd = BaseControl.PointToScreen(ExtentPoint)
	      drawArea.X = screenStart.X
	      drawArea.Y = screenStart.Y
	      drawArea.Width = (screenEnd.X - screenStart.X)
	      drawArea.Height = (screenEnd.Y - screenStart.Y)

	      ' ----- Draw using the user-selected style.
	      Select Case Style
	         Case RubberBandStyle.DashedLine
	            ControlPaint.DrawReversibleFrame( _
	               drawArea, Color.Black, FrameStyle.Dashed)
	         Case RubberBandStyle.ThickLine
	            ControlPaint.DrawReversibleFrame( _
	               drawArea, Color.Black, FrameStyle.Thick)
	         Case RubberBandStyle.SolidBox
	            ControlPaint.FillReversibleRectangle( _
	               drawArea, BackColor)
	      End Select
	   End Sub
	End Class
To demonstrate the RubberBand
class, the following code creates an instance and calls its Start(), Stretch(), and Finish() methods based on the user’s mouse
activities. When the mouse button is first depressed, the code calls
the Start() method. As the mouse is
moved, the Stretch() method is
called to continuously update the visible selection rectangle. When
the mouse button is released, the Finish() method completes the selection
process. At this point, the read-only Rectangle property returns a complete
description of the selected area:
	Public Class Form1
	   ' ----- Adust the second and third arguments to
	   ' see different methods.
	   Dim SelectionArea As RubberBand = New RubberBand(Me, _
	      RubberBand.RubberBandStyle.DashedLine, Color.Gray)

	   Private Sub Form1_MouseDown(ByVal sender As Object, _
	         ByVal e As System.Windows.Forms.MouseEventArgs) _
	         Handles MyBase.MouseDown
	      ' ----- Start
rubber-band tracking.
	      SelectionArea.Start(e.X, e.Y)
	   End Sub

	   Private Sub Form1_MouseMove(ByVal sender As Object, _
	         ByVal e As System.Windows.Forms.MouseEventArgs) _
	         Handles MyBase.MouseMove
	      ' ----- Update the rubber-band display area.
	      SelectionArea.Stretch(e.X, e.Y)
	   End Sub

	   Private Sub Form1_MouseUp(ByVal sender As Object, _
	         ByVal e As System.Windows.Forms.MouseEventArgs) _
	         Handles MyBase.MouseUp
	      ' ----- Finished with the selection.
	      SelectionArea.Finish()
	      Me.Refresh()
	   End Sub

	   Private Sub Form1_Paint(ByVal sender As Object, _
	         ByVal e As System.Windows.Forms.PaintEventArgs) _
	         Handles MyBase.Paint
	      ' ----- Add some interest to the form surface.
	      Dim canvas As Graphics = e.Graphics
	      Dim polygonPoints() As Point = {New Point(300, 150), _
	         New Point(200, 300), New Point(400, 300)}

	      ' ----- Draw some shapes and text.
	      canvas.FillEllipse(New SolidBrush(Color.Red), _
	         10, 20, 200, 150)
	      canvas.FillRectangle(New SolidBrush(Color.Blue), _
	         100, 100, 250, 100)
	      canvas.FillPolygon(New SolidBrush(Color.Green), _
	         polygonPoints)
	      canvas.DrawString(
SelectionArea.Rectangle.ToString, _
	         New Font("Arial", 12), Brushes.Black, 0, 0)
	   End Sub
	End Class
Figure 9-37 shows the results of running this demonstration code to select a rectangular area on the form. In this case the mouse was dragged down and to the right to select the area, but the code compensates for dragging in any direction and returns a proper rectangle.
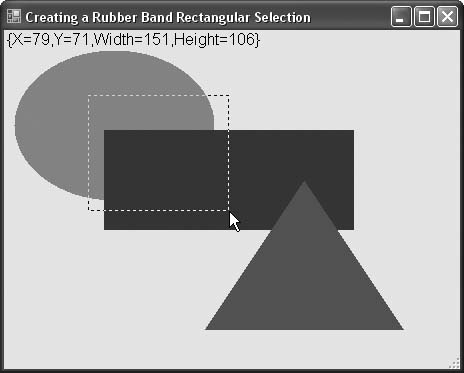
9.27. Animating with Transparency
Problem
You want to add some simple animation to a form and make it interesting enough to catch the user’s eye without being overbearing or distracting.
Solution
Sample code folder: Chapter 09 TransparentAnimation
One idea is to use a timer to redraw graphics whose transparency varies over time.
Discussion
There are many ways to add simple animation to your graphics, and adjusting the transparency is just one simple trick that can add an interesting and creative effect to your images. This example also demonstrates how the alpha setting of a color changes drawings through the full range of transparency, from completely invisible to completely opaque.
Create a new Windows Forms application, and add a Timer control named Timer1. Set its Interval property to 10 (milliseconds) and
its Enabled property to True. Also, set the form’s DoubleBuffered property to True.
A good way to drive the animation action is by redrawing with
each tick of a timer. Notice that the drawing commands are not done in
the timer’s Tick event. Instead,
you tell the form to refresh itself and add the graphics commands
where they really belong—in the form’s Paint event. Add the following code to the
form’s class template to have the timer trigger screen updates:
	Private Sub Timer1_Tick(ByVal sender As System.Object, _
	      ByVal e As System.EventArgs) Handles Timer1.Tick
	   ' ----- Update the animated display.
	   Me.Refresh()
	End Sub
The form’s Paint event is
called at the rate set by the Interval property of the timer. The
10-milliseconds setting provides a fairly smooth and noticeable
transparency transition. Use a larger number for slower, more subtle
action.
The currentSetting variable
increments or decrements each time through the Paint event handler, with the change amount
reversing direction when 0 or 255 is reached:
	Private Sub Form1_Paint(ByVal sender As Object, _
	      ByVal e As System.Windows.Forms.PaintEventArgs) _
	      Handles Me.Paint
	   ' ----- Display the next step in the animation.
	   Static currentSetting As Integer = 0
	   Static changeFactor As Integer = 1
	   Dim transparentGreen As Color
	   Dim canvas As Graphics = e.Graphics
	   Dim trianglePoints() As Point = {New Point(180, 50), _
	      New Point(30, 280), New Point(330, 280)}

	   ' ----- Adjust the transparency factor.
	   currentSetting += changeFactor
	   If (currentSetting = 0) Or (currentSetting = 255) Then
	      ' ----- Change direction.
	      changeFactor = -changeFactor
	   End If
The following line is the heart of this example; it shows how to
create a color with a controllable degree of transparency. You can
pass just red, green, and blue values to Color.FromArgb() to create a solid shade, or
you can add the fourth parameter, called alpha, to control the color’s transparency.
The values of all four parameters range from 0 to 255. Anything drawn
with the designated color will be drawn with the indicated amount of
transparency:
	   ' ---- Set the transparent green color.
	   transparentGreen = Color.FromArgb(currentSetting, 0, 255, 0)
These statements draw the solid geometric objects in the background, in preparation for drawing a transparent triangle in front of them:
	   ' ----- Draw some geometric figures.
	   canvas.FillEllipse(New SolidBrush(Color.Red), _
	      10, 20, 200, 150)
	   canvas.FillRectangle(New SolidBrush(Color.Blue), _
	      100, 100, 250, 100)
There is no GDI+ method to draw a triangle, per se. But a
triangle is just a three-sided polygon, so it’s easy to use the
DrawPolygon() or FillPolygon() methods to do the trick. In
this case we fill a polygon (triangle) using a solid brush comprised
of our current shade of transparent green:
	   ' ----- Draw a transparent green triangle in front.
	   canvas.FillPolygon(New SolidBrush(transparentGreen), _
	      trianglePoints)
	End Sub
Figure 9-38 shows the graphics with the triangle drawn using an intermediate transparency.
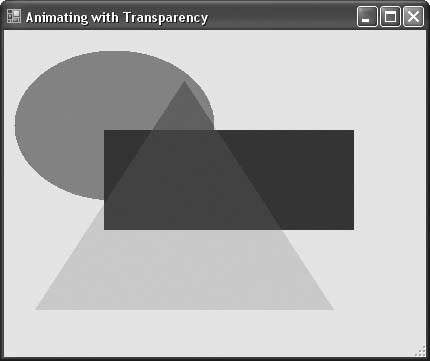
9.28. Substitutions for Obsolete Visual Basic 6.0 Features
Problem
You used to use a lot of form-based drawing features in Visual Basic 6.0, but many of them seem to be missing from the .NET versions of Visual Basic.
Solution
Sample code folder: Chapter 09VB6Replacements
GDI+ is a full-featured drawing package that provides easier access to form-based drawing than Visual Basic 6.0 did. Unfortunately, finding the replacements for some of VB 6’s form-based drawing features takes a bit of work. This recipe discusses some of the more significant replacements.
Discussion
Most of the replacement features involve GDI+ drawing, although you can simulate some older features using Label controls. The features discussed in this section focus on those methods and controls that were used directly on a form. In .NET, any of the drawing commands that you use on the form’s surface can also be used on any control.
Any discussion that mentions “drawing on the form” refers to
drawing through the form’s Graphics object. Such drawing is usually done
in the form’s Paint event handler,
which provides you with a Graphics
object:
	Private Sub Form1_Paint(ByVal sender As Object, _
	      ByVal e As System.Windows.Forms.PaintEventArgs) _
	      Handles Me.Paint
	   ' ----- Draw a
line.
	   e.Graphics.DrawLine(…)
	End Sub
You can also create a Graphics object at any time in other event
handlers and methods using the form’s CreateGraphics() method:
	Dim formCanvas As Graphics = Me.CreateGraphics()
	e.Graphics.DrawLine(…)

	' ----- Properly dispose of the graphics canvas.
	formCanvas.Dispose()
Let’s look at some of the specific replacements:
LinecontrolsThere are two replacements for Visual Basic 6.0
Linecontrols. If your line is horizontal or vertical, you can use aLabelcontrol with theBackColorproperty set to the line color you need. Adjust the width or height of the label as needed to increase the thickness of the line. Be sure to clear theTextproperty and set theAutoSizeproperty toFalse.If you need diagonal lines, you can draw them on the form surface in the form’s
Paintevent using theDrawLine()method.ShapecontrolsThere is no direct control replacement for the Visual Basic 6.0
Shapecontrols. Rectangular or elliptical shapes can be drawn directly on the form using theDrawRectangle()andDrawEllipse()methods. The relatedFillRectangle()andFillEllipse()methods draw filled shapes, with no edge lines.There is no drawing command that can generate a rectangle with rounded corners. You must create it yourself using
DrawLine()andDrawArc()method calls. You can also build this shape as aGraphicsPathobject. Here is a method that draws a rounded rectangle directly on a graphics surface. The rounded corner has a radius of five pixels (units, actually):Private Sub DrawRoundedRectangle( _ ByVal sourceRectangle As Rectangle, _ ByVal canvas As Graphics, ByVal usePen As Pen) ' ----- Draw a rounded rectangle. Dim saveState As Drawing2D.GraphicsState ' ----- Move the origin to the upper-left corner ' of the rectangle. saveState = canvas.Save() canvas.TranslateTransform(sourceRectangle.Left, _ sourceRectangle.Top) With sourceRectangle ' ----- Draw the four edges, starting from the top ' and moving clockwise. canvas.DrawLine(usePen, 5, 0, .Width - 5, 0) canvas.DrawLine(usePen, .Width, 5, .Width, .Height - 5) canvas.DrawLine(usePen, .Width - 5, .Height, 5, .Height) canvas.DrawLine(usePen, 0, .Height - 5, 0, 5) ' ----- Draw the four corners, starting from the ' upper left and moving clockwise. canvas.DrawArc(usePen, 0, 0, 10, 10, 180, 90) canvas.DrawArc(usePen, .Width - 10, 0, 10, 10, 270, 90) canvas.DrawArc(usePen, .Width - 10, .Height - 10, _ 10, 10, 0, 90) canvas.DrawArc(usePen, 0, .Height - 10, 10, 10, 90, 90) End With ' ----- Restore the original graphics canvas. canvas.Restore(saveState) End Sub
This code draws a 100-by-100-unit rounded rectangle at position (10,10) on the form’s surface:
	Private Sub Form1_Paint(ByVal sender As Object, _
	      ByVal e As System.Windows.Forms.PaintEventArgs) _
	      Handles Me.Paint
	   DrawRoundedRectangle(New Rectangle(10, 10, 100, 100), _
	      e.Graphics, Pens.Black)
	End Sub
Figure 9-39 shows the output from this code.
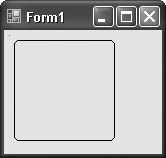
Cls()methodTo clear the entire graphics surface, use the
Clear()method. You pass it the color used to clear the surface:e.Graphics.Clear(Color.White)
Scale()methodTo change the coordinate system on the form’s surface, use the
Graphicsobject’sScaleTransform()method. You can also supply a custom matrix transformation by assigning theGraphicsobject’sTransformproperty.PSet()methodThere is no method that can draw a single pixel on a graphics surface. You can simulate it using the
DrawLine(), DrawRectangle(), orFillRectangle()methods and providing very precise coordinates. Another way to draw a single point is to create a single-point bitmap and draw the bitmap onto the canvas. TheBitmapclass does have aSetPixelmethod:' ----- Draw a red pixel at (5,5). Dim tinyBitmap As New Bitmap(1, 1) tinyBitmap.SetPixel(0, 0, Color.Red) e.Graphics.DrawImageUnscaled(tinyBitmap, 5, 5) tinyBitmap.Dispose()
Point()methodWhile the
Graphicsobject does not let you query the color of an individual pixel, you can do so with aBitmapobject. This object’sGetPixel()method returns aColorobject for the specified pixel.Line()methodReplaced by the
DrawLine()method.Circle()methodReplaced by the
DrawEllipse()andFillEllipse()methods.PaintPicture()methodReplaced by the
DrawImage()method.