


From a non-virtualized to a virtualized infrastructure
In this chapter, we focus on:
•Motivation to move from a non-virtualized to a virtualized infrastructure:
– Evolution in the SAP landscape
– Motivation for server virtualization
•Examples of virtualization advantages:
– Landscape consolidation
– Load shifting
– Processing chain
– Concurrent load prioritization
1.1 Motivation
In this section, we focus on the evolutionary trends in the SAP landscape and the motivation for server virtualization.
1.1.1 Evolution trends in the SAP landscape
The classic architecture of an SAP system is a client/server design. The building blocks of a traditional SAP system comprise a database and a number of application servers. One of these application servers (apps svr), the central instance or CI, contains resources that are unique to the SAP system: the object locking mechanism (enq_server) and the system communications mechanism (msg_server). You can construct the system in either 2-tier (all components on a single server) or 3-tier (application servers distributed over multiple servers), as shown in Figure 1-1 on page 2 where the presentation layer (front-end users) counts as one separate tier.
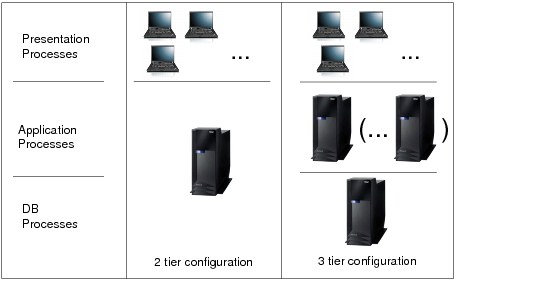
Figure 1-1 2-tier or 3-tier configuration
In a 2-tier configuration, we see a better resource utilization and the overall administration is easier. The 3-tier system architecture necessarily increases the number of systems that must be maintained and the number of operating system (OS) images. Nevertheless, a 3-tier can offer benefit in a number of ways: the ability of scale-out and in reducing the exposure in the case of a single-server failure and the granularity for a fail-over scenario.
You must also consider that an SAP production system never comes alone. In a normal SAP landscape, each production system represents a string of at least three systems: development, quality assurance, and production, as shown in Figure 1-2.
The development system is often much smaller than the production system; however, the test or quality assurance system is used to simulate production and, at least during major tests, must have the full capacity of the production system.

Figure 1-2 SAP system landscape
Up to now, we only looked at the traditional landscape for a single system. An SAP landscape normally contains a number of core systems of this kind that cover different application areas, depending on the industry, which includes, but is not limited to: Enterprise Resource Planning (ERP/ECC1), Supply Chain Management (SCM), Customer Relationship Management (CRM), Supplier Relationship Management (SRM), Business Intelligence (BI), and systems that are used for supporting functionality, such as the SAP Solution Manager. These systems are joined by functionality for interoperability, such as Process Integration (PI) for inter-system communication, and the Enterprise Portal (EP) for front-end communication, which each require development, test, and production systems. Figure 1-3 and Figure 1-4 are taken from an actual SAP two-site landscape design and demonstrates the evolving complexity and proliferation of systems and servers.

Figure 1-3 Site 1, multiple physical systems running multiple applications

Figure 1-4 Site 2, multiple physical systems running multiple applications
Over the system life cycle and the production day, the utilization of these systems will vary considerably. Development and training are normally active during the day, quality assurance testing is a periodic activity, and production systems normally have different capacity requirements, depending on the time of day, day of month, and type of system. A number of studies show that the average processor utilization of a server in an SAP landscape is surprisingly low, in the order of 15-20%. With each system residing on its own dedicated server (or group of servers in 3-tier), idle resources remain dedicated to idle systems.
1.1.2 Motivation for server virtualization
There are a number of motivations for moving to virtualized server resources, the primary focus for all of them is on reduction of complexity and the total cost of ownership of the IT landscape, which you can realize through consolidation to achieve a more efficient utilization of hardware resources. SAP systems are normally sized for the capacity that is required to meet the critical peak workload, which often represents only a small part of the system’s productive day, month, or year. By consolidating a large number of dedicated servers, each running at an average low utilization with only periodic peaks, into a shared infrastructure, less capacity is required in total. This consolidation normally reduces the system management and maintenance overhead too by reducing the number of servers. A recent aspect to this calculation, which plays an ever increasing role, is also the fact that server consolidation can also reduce the number of servers that idly consume power and space.
1.1.3 Beyond the server
Each SAP system has an associated storage requirement because each has at least one database. The proliferation in the direction of the storage infrastructure reflects the same type of complexity that you see in the landscape itself. In this area, the move from dedicated storage is replaced by shared storage servers, and a networked storage infrastructure becomes the norm. Nevertheless, most servers have their own dedicated access paths and statically dedicated storage capacity that generates maintenance overhead per system. The use of virtual I/O servers (which allow sharing of the I/O access paths) and virtual storage implementations (which provide a layer of abstraction between the logical storage view and the actual storage hardware) begin to address this complexity. These solutions help to reduce scheduled downtime and provide a high degree of flexibility in storage maintenance. We do not cover storage virtualization in this book.
1.2 Examples of virtualization advantages
We use the four examples in this section to demonstrate a variety of situations in which virtualization is used to a proven advantage.
1.2.1 Landscape consolidation
There are multiple examples where customers consolidated dozens or even hundreds of systems, running on individual physical servers, into a few large servers. These few servers can then carry all of the consolidated workload, which was previously distributed over the many small servers, each with reserve capacity to cover an individual workload peak. This consolidation reduced the number of servers and the need for idle capacity and cost for power and cooling. Figure 1-5 on page 5 shows an example of the individual load profiles for various systems running on dedicated servers and the results of these loads when combined using processor sharing into a single hardware server.

Figure 1-5 Possible consolidation scheme of an SAP system landscape
1.2.2 Load shifting
You can use virtualization to cope with shifting load requirements during the processing life cycle. You find this type of behavior in an integrated SAP landscape, where business processes span a number of SAP systems, shifting the processing load from one system to another. By using virtualization, the resources can follow the load shift and meet the peak load in each of the SAP systems. Compared to dedicated servers, where each server is individually sized to cover the peak load of one SAP system, the same implementation in a virtualized landscape needs to cover only the highest peak at any point-in-time, which can provide a big benefit.
Figure 1-6 shows an example of this type of consolidation in the business processes for service parts management (SPM) for automotive. Here the business processes for the order fulfilment span three SAP systems: CRM, SCM, and ECC. Each unit-of-work executes a process sequence that drives the workload in each of the three systems. The result is simultaneous workload on all three servers.

Figure 1-6 Example of the components of an SAP service parts management solution in the automotive industry
Figure 1-7 on page 6 shows measurements of the peak and average processor requirements during the order fulfilment run for a high-volume system test. Individually SCM needed a maximum of 31 processors. ECC needed 16 processors and CRM 28 processors. In this case, to cover the peak requirements of all components in a dedicated server landscape, 76 processors are required. Using the process in Figure 1-7, processor virtualization covered all peaks for each system in this integrated environment with 64 processors.
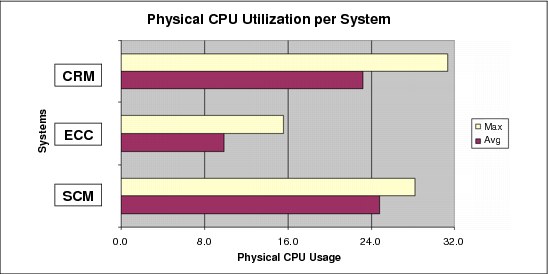
Figure 1-7 Distribution of processor utilization in the service parts management scenario
Figure 1-8 shows the capacity utilization for the same order fulfilment run that Figure 1-7 shows, as it looks when recorded in two minute intervals. The maximum or peak utilization (the y-axis shows processor utilization in %) for each of the systems is averaged over two minutes in this graph. The distribution of the load over the three systems appears to be a homogenous pattern.
The resource distribution in the shared processor pool is implemented in 10 ms time slices. The result of this fine granularity of the resource sharing is that even heavily competing peak loads gain considerable benefit.

Figure 1-8 Monitoring snapshot in two minute intervals
If the finest granularity of the monitoring tool is used to observe the load behavior of the SAP systems, it becomes clearer how this is achieved. Figure 1-9 on page 7 is another example of the workload running on the SCM and ECC systems in the same SPM scenario of Figure 1-8 on page 6, but in a separate test.

Figure 1-9 Processor utilization from lparstat in one second intervals
Figure 1-9 is taken from the high-load test, which required the CRM system to be moved to a second p595. In this graph, we track only the ECC and SCM systems that share this physical machine.
The measurements are taken in one second intervals (every mark on the graphs is a one second average). The “combined” line represents the sum of the peaks at the given interval for both SCM and ECC. In this graph, we see how the volatile load peaks mesh together. The combined load, evaluated in the short one second interval, reaches 68 processors. Because there are only 64 processors in the system, this shows that the peaks occur at an even more granular level than one second at different times, hence the two workloads balance each other out.
If we drilled down and viewed the systems in 10 ms intervals, we might see the further intensity of this load fluctuation.
1.2.3 Processing chain
There is also a benefit in virtualization for a multi-step processing chain that has different requirements at each stage of processing. In this case, the highest peak must be covered, but the resources not required by the less intensive steps are shared with the other workload.
Figure 1-10 is taken from a proof-of-concept for road billing implementation. In this scenario, there are a total of 15 processing steps that are executed in a sequential chain, nine of which are documented in this proof of concept.
Figure 1-10 End-to-end business process chain for “Service to cash”
Figure 1-11 on page 8 shows the processor requirements of each of the sequential steps in Figure 1-10, broken down in requirements for the database and for the application servers. During the high-volume processing run in this utilization chart, several of the critical steps require significant processor power and a number are comparatively light. To complete the work within the required batch processing window, the machine capacity must cover the peaks of the high load steps, which results in a good deal of idle capacity, even during the critical batch processing window. This is capacity potentially available for other workload.
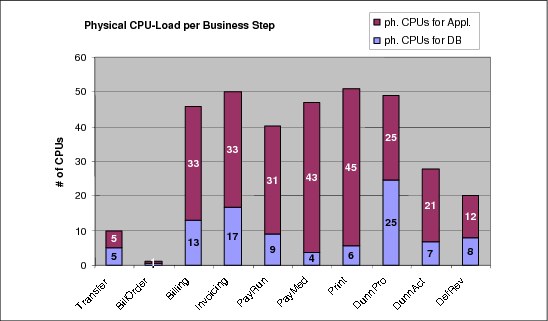
Figure 1-11 Processor utilization for the different business processes
Additionally, let us consider the shift in requirements over these steps in the distribution of the resources between the database and application servers. This shift is as great as 7:1 (application server processor to DB server processor ratio) in Correspondence Printing (Print) versus 1:1 in Dunning Proposal Activities (DunnPro). The ECC system that runs this load is implemented as a 3-tier configuration, which occurred in consideration of the high-availability fail-over scenario for the database and central instance. In this case, the database and the production application servers are in two different LPARs. In a dedicated 3-tier architecture of this design, for the sizing consider the peak requirements of each of these components. In this case, the requirement is for 70 processors (rather than the 51 used or nearly 40% more capacity) because the application peak is at 45 processors and the DB peak is 25 processors, albeit at different stages of processing.
1.2.4 Concurrent load prioritization
Many SAP systems are not dealing with a single load type, but concurrent loads of different profiles and priorities. The mix often comprises online transactional load, batch processing, and administration activities, such as inter-system data transfers or online database backups. Virtualization can also be used here to separate and prioritize the load types according to the business requirements to take full advantage of the available processing capacity.
As an example, Figure 1-12 on page 9 is taken from a high-end SAP Business Intelligence proof-of-concept. This system represents a 24x7 “follow the sun” implementation with four primary workload considerations: online transaction processing, batch data loading, aggregation of loaded data, and administration. In this implementation, the load types were separated into dedicated application server LPARs, which were prioritized using a combination of guaranteed and shared resources. Using a simple-to-implement scheme, the batch processing can utilize all “left over” processing cycles without measurable impact to the online or database activities. Using this approach, batch loading can continue at full throttle concurrent with online user activities.
Additionally, resources that are normally reserved for administration activities, such as the “data movers” that perform the backup of a system flash-copy to tape each eight hours, are available for production activities outside of the (relatively small) backup window. They are guaranteed to the data movers but available to other shared processor LPARs (SPLPARs, for details see 2.9, “Micropartitioning and Shared Processor LPARs” on page 17) when not in use.

Figure 1-12 Power Systems 595 with a schema of the various load types
These are a few examples of where you can use virtualization to achieve the best utilization of resources, reduce unnecessary idle capacity, reduce the landscape hardware distribution, and reduce the total cost-of-ownership. In the next chapters, we describe the technology in detail and position the virtualization technology into the SAP landscape.
1 ECC = ERP Central Component
..................Content has been hidden....................
You can't read the all page of ebook, please click here login for view all page.