One course open to the defensive investor is to put his money into investment-company shares. Those that are redeemable on demand by the holder, at net asset value, are commonly known as “mutual funds” (or “open-end funds”). Most of these are actively selling additional shares through a corps of salesmen. Those with nonredeemable shares are called “closed-end” companies or funds; the number of their shares remains relatively constant. All of the funds of any importance are registered with the Securities & Exchange Commission (SEC), and are subject to its regulations and controls.*
The industry is a very large one. At the end of 1970 there were 383 funds registered with the SEC, having assets totaling $54.6 billions. Of these 356 companies, with $50.6 billions, were mutual funds, and 27 companies with $4.0 billions, were closed-end.†
There are different ways of classifying the funds. One is by the broad division of their portfolio; they are “balanced funds” if they have a significant (generally about one-third) component of bonds, or “stock-funds” if their holdings are nearly all common stocks. (There are some other varieties here, such as “bond funds,” “hedge funds,” “letter-stock funds,” etc.)* Another is by their objectives, as their primary aim is for income, price stability, or capital appreciation (“growth”). Another distinction is by their method of sale. “Load funds” add a selling charge (generally about 9% of asset value on minimum purchases) to the value before charge.1 Others, known as “no-load” funds, make no such charge; the managements are content with the usual investment-counsel fees for handling the capital. Since they cannot pay salesmen’s commissions, the size of the no-load funds tends to be on the low side.† The buying and selling prices of the closed-end funds are not fixed by the companies, but fluctuate in the open market as does the ordinary corporate stock.
Most of the companies operate under special provisions of the income-tax law, designed to relieve the shareholders from double taxation on their earnings. In effect, the funds must pay out virtually all their ordinary income—i.e., dividends and interest received, less expenses. In addition they can pay out their realized long-term profits on sales of investments—in the form of “capital-gains dividends”—which are treated by the shareholder as if they were his own security profits. (There is another option here, which we omit to avoid clutter.)† Nearly all the funds have but one class of security outstanding. A new wrinkle, introduced in 1967, divides the capitalization into a preferred issue, which will receive all the ordinary income, and a capital issue, or common stock, which will receive all the profits on security sales. (These are called “dual-purpose funds.”)*
Many of the companies that state their primary aim is for capital gains concentrate on the purchase of the so-called “growth stocks,” and they often have the word “growth” in their name. Some specialize in a designated area such as chemicals, aviation, overseas investments; this is usually indicated in their titles.
The investor who wants to make an intelligent commitment in fund shares has thus a large and somewhat bewildering variety of choices before him—not too different from those offered in direct investment. In this chapter we shall deal with some major questions, viz:
1. Is there any way by which the investor can assure himself of better than average results by choosing the right funds? (Subquestion: What about the “performance funds”?)†
2. If not, how can he avoid choosing funds that will give him worse than average results?
3. Can he make intelligent choices between different types of funds—e.g., balanced versus all-stock, open-end versus closed-end, load versus no-load?
Investment-Fund Performance as a Whole
Before trying to answer these questions we should say something about the performance of the fund industry as a whole. Has it done a good job for its shareholders? In the most general way, how have fund investors fared as against those who made their investments directly? We are quite certain that the funds in the aggregate have served a useful purpose. They have promoted good habits of savings and investment; they have protected countless individuals against costly mistakes in the stock market; they have brought their participants income and profits commensurate with the overall returns from common stocks. On a comparative basis we would hazard the guess that the average individual who put his money exclusively in investment-fund shares in the past ten years has fared better than the average person who made his common-stock purchases directly.
The last point is probably true even though the actual performance of the funds seems to have been no better than that of common stocks as a whole, and even though the cost of investing in mutual funds may have been greater than that of direct purchases. The real choice of the average individual has not been between constructing and acquiring a well-balanced common-stock portfolio or doing the same thing, a bit more expensively, by buying into the funds. More likely his choice has been between succumbing to the wiles of the doorbell-ringing mutual-fund salesman on the one hand, as against succumbing to the even wilier and much more dangerous peddlers of second- and third-rate new offerings. We cannot help thinking, too, that the average individual who opens a brokerage account with the idea of making conservative common-stock investments is likely to find himself beset by untoward influences in the direction of speculation and speculative losses; these temptations should be much less for the mutual-fund buyer.
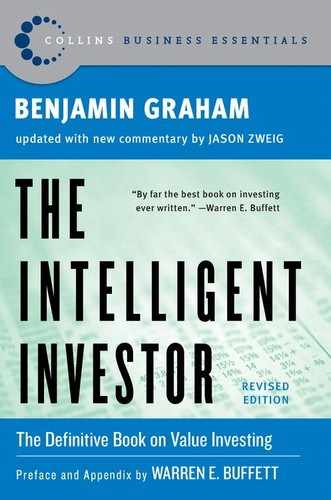
But how have the investment funds performed as against the general market? This is a somewhat controversial subject, but we shall try to deal with it in simple but adequate fashion. Table 9-1 gives some calculated results for 1961–1970 of our ten largest stock funds at the end of 1970, but choosing only the largest one from each management group. It summarizes the overall return of each of these funds for 1961–1965, 1966–1970, and for the single years 1969 and 1970. We also give average results based on the sum of one share of each of the ten funds. These companies had combined assets of over $15 billion at the end of 1969, or about one-third of all the common-stock funds. Thus they should be fairly representative of the industry as a whole. (In theory, there should be a bias in this list on the side of better than industry performance, since these better companies should have been entitled to more rapid expansion than the others; but this may not be the case in practice.)
Some interesting facts can be gathered from this table. First, we find that the overall results of these ten funds for 1961–1970 were not appreciably different from those of the Standard & Poor’s 500-stock composite average (or the S & P 425-industrial stock average). But they were definitely better than those of the DJIA. (This raises the intriguing question as to why the 30 giants in the DJIA did worse than the much more numerous and apparently rather miscellaneous list used by Standard & Poor’s.)* A second point is that the funds’ aggregate performance as against the S & P index has improved somewhat in the last five years, compared with the preceding five. The funds’ gain ran a little lower than S & P’s in 1961–1965 and a little higher than S & P’s in 1966–1970. The third point is that a wide difference exists between the results of the individual funds.
We do not think the mutual-fund industry can be criticized for doing no better than the market as a whole. Their managers and their professional competitors administer so large a portion of all marketable common stocks that what happens to the market as a whole must necessarily happen (approximately) to the sum of their funds. (Note that the trust assets of insured commercial banks included $181 billion of common stocks at the end of 1969; if we add to this the common stocks in accounts handled by investment advisers, plus the $56 billion of mutual and similar funds, we must conclude that the combined decisions of these professionals pretty well determine the movements of the stock averages, and that the movement of the stock averages pretty well determines the funds’ aggregate results.)
Are there better than average funds and can the investor select these so as to obtain superior results for himself? Obviously all investors could not do this, since in that case we would soon be back where we started, with no one doing better than anyone else. Let us consider the question first in a simplified fashion. Why shouldn’t the investor find out what fund has made the best showing of the lot over a period of sufficient years in the past, assume from this that its management is the most capable and will therefore do better than average in the future, and put his money in that fund? This idea appears the more practicable because, in the case of the mutual funds, he could obtain this “most capable management” without paying any special premium for it as against the other funds. (By contrast, among noninvestment corporations the best-managed companies sell at correspondingly high prices in relation to their current earnings and assets.)
The evidence on this point has been conflicting over the years. But our Table 9-1 covering the ten largest funds indicates that the results shown by the top five performers of 1961–1965 carried over on the whole through 1966–1970, even though two of this set did not do as well as two of the other five. Our studies indicate that the investor in mutual-fund shares may properly consider comparative performance over a period of years in the past, say at least five, provided the data do not represent a large net upward movement of the market as a whole. In the latter case spectacularly favorable results may be achieved in unorthodox ways—as will be demonstrated in our following section on “performance” funds. Such results in themselves may indicate only that the fund managers are taking undue speculative risks, and getting away with same for the time being.
“Performance” Funds
One of the new phenomena of recent years was the appearance of the cult of “performance” in the management of investment funds (and even of many trust funds). We must start this section with the important disclaimer that it does not apply to the large majority of well-established funds, but only to a relatively small section of the industry which has attracted a disproportionate amount of attention. The story is simple enough. Some of those in charge set out to get much better than average (or DJIA) results. They succeeded in doing this for a while, garnering considerable publicity and additional funds to manage. The aim was legitimate enough; unfortunately, it appears that, in the context of investing really sizable funds, the aim cannot be accomplished without incurring sizable risks. And in a comparatively short time the risks came home to roost.
Several of the circumstances surrounding the “performance” phenomenon caused ominous headshaking by those of us whose experience went far back—even to the 1920s—and whose views, for that very reason, were considered old-fashioned and irrelevant to this (second) “New Era.” In the first place, and on this very point, nearly all these brilliant performers were young men—in their thirties and forties—whose direct financial experience was limited to the all but continuous bull market of 1948–1968. Secondly, they often acted as if the definition of a “sound investment” was a stock that was likely to have a good rise in the market in the next few months. This led to large commitments in newer ventures at prices completely disproportionate to their assets or recorded earnings. They could be “justified” only by a combination of naïve hope in the future accomplishments of these enterprises with an apparent shrewdness in exploiting the speculative enthusiasms of the uninformed and greedy public.
This section will not mention people’s names. But we have every reason to give concrete examples of companies. The “performance fund” most in the public’s eye was undoubtedly Manhattan Fund, Inc., organized at the end of 1965. Its first offering was of 27 million shares at $9.25 to $10 per share. The company started out with $247 million of capital. Its emphasis was, of course, on capital gains. Most of its funds were invested in issues selling at high multipliers of current earnings, paying no dividends (or very small ones), with a large speculative following and spectacular price movements. The fund showed an overall gain of 38.6% in 1967, against 11% for the S & P composite index. But thereafter its performance left much to be desired, as is shown in Table 9-2.

The portfolio of Manhattan Fund at the end of 1969 was unorthodox to say the least. It is an extraordinary fact that two of its largest investments were in companies that filed for bankruptcy within six months thereafter, and a third faced creditors’ actions in 1971. It is another extraordinary fact that shares of at least one of these doomed companies were bought not only by investment funds but by university endowment funds, the trust departments of large banking institutions, and the like.* A third extraordinary fact was that the founder-manager of Manhattan Fund sold his stock in a separately organized management company to another large concern for over $20 million in its stock; at that time the management company sold had less than $1 million in assets. This is undoubtedly one of the greatest disparities of all times between the results for the “manager” and the “managees.”
A book published at the end of 19692 provided profiles of nineteen men “who are tops at the demanding game of managing billions of dollars of other people’s money.” The summary told us further that “they are young…some earn more than a million dollars a year…they are a new financial breed…they all have a total fascination with the market…and a spectacular knack for coming up with winners.” A fairly good idea of the accomplishments of this top group can be obtained by examining the published results of the funds they manage. Such results are available for funds directed by twelve of the nineteen persons described in The Money Managers. Typically enough, they showed up well in 1966, and brilliantly in 1967. In 1968 their performance was still good in the aggregate, but mixed as to individual funds. In 1969 they all showed losses, with only one managing to do a bit better than the S & P composite index. In 1970 their comparative performance was even worse than in 1969.
We have presented this picture in order to point a moral, which perhaps can best be expressed by the old French proverb: Plus ça change, plus c’est la même chose. Bright, energetic people—usually quite young—have promised to perform miracles with “other people’s money” since time immemorial. They have usually been able to do it for a while—or at least to appear to have done it—and they have inevitably brought losses to their public in the end.* About a half century ago the “miracles” were often accompanied by flagrant manipulation, misleading corporate reporting, outrageous capitalization structures, and other semifraudulent financial practices. All this brought on an elaborate system of financial controls by the SEC, as well as a cautious attitude toward common stocks on the part of the general public. The operations of the new “money managers” in 1965–1969 came a little more than one full generation after the shenanigans of 1926–1929.† The specific malpractices banned after the 1929 crash were no longer resorted to—they involved the risk of jail sentences. But in many corners of Wall Street they were replaced by newer gadgets and gimmicks that produced very similar results in the end. Outright manipulation of prices disappeared, but there were many other methods of drawing the gullible public’s attention to the profit possibilities in “hot” issues. Blocks of “letter stock”3 could be bought well below the quoted market price, subject to undisclosed restrictions on their sale; they could immediately be carried in the reports at their full market value, showing a lovely and illusory profit. And so on. It is amazing how, in a completely different atmosphere of regulation and prohibitions, Wall Street was able to duplicate so much of the excesses and errors of the 1920s.
No doubt there will be new regulations and new prohibitions. The specific abuses of the late 1960s will be fairly adequately banned from Wall Street. But it is probably too much to expect that the urge to speculate will ever disappear, or that the exploitation of that urge can ever be abolished. It is part of the armament of the intelligent investor to know about these “Extraordinary Popular Delusions,”4 and to keep as far away from them as possible.
The picture of most of the performance funds is a poor one if we start after their spectacular record in 1967. With the 1967 figures included, their overall showing is not at all disastrous. On that basis one of “The Money Managers” operators did quite a bit better than the S & P composite index, three did distinctly worse, and six did about the same. Let us take as a check another group of performance funds—the ten that made the best showing in 1967, with gains ranging from 84% up to 301% in that single year. Of these, four gave a better overall four-year performance than the S & P index, if the 1967 gains are included; and two excelled the index in 1968–1970. None of these funds was large, and the average size was about $60 million. Thus, there is a strong indication that smaller size is a necessary factor for obtaining continued outstanding results.
The foregoing account contains the implicit conclusion that there may be special risks involved in looking for superior performance by investment-fund managers. All financial experience up to now indicates that large funds, soundly managed, can produce at best only slightly better than average results over the years. If they are unsoundly managed they can produce spectacular, but largely illusory, profits for a while, followed inevitably by calamitous losses. There have been instances of funds that have consistently outperformed the market averages for, say, ten years or more. But these have been scarce exceptions, having most of their operations in specialized fields, with self-imposed limits on the capital employed—and not actively sold to the public.*
Closed-End versus Open-End Funds
Almost all the mutual funds or open-end funds, which offer their holders the right to cash in their shares at each day’s valuation of the portfolio, have a corresponding machinery for selling new shares. By this means most of them have grown in size over the years. The closed-end companies, nearly all of which were organized a long time ago, have a fixed capital structure, and thus have diminished in relative dollar importance. Open-end companies are being sold by many thousands of energetic and persuasive salesmen, the closed-end shares have no one especially interested in distributing them. Consequently it has been possible to sell most “mutual funds” to the public at a fixed premium of about 9% above net asset value (to cover salesmen’s commissions, etc.), while the majority of close-end shares have been consistently obtainable at less than their asset value. This price discount has varied among individual companies, and the average discount for the group as a whole has also varied from one date to another. Figures on this point for 1961–1970 are given in Table 9-3.
It does not take much shrewdness to suspect that the lower relative price for closed-end as against open-end shares has very little to do with the difference in the overall investment results between the two groups. That this is true is indicated by the comparison of the annual results for 1961–1970 of the two groups included in Table 9-3.
Thus we arrive at one of the few clearly evident rules for investors’ choices. If you want to put money in investment funds, buy a group of closed-end shares at a discount of, say, 10% to 15% from asset value, instead of paying a premium of about 9% above asset value for shares of an open-end company. Assuming that the future dividends and changes in asset values continue to be about the same for the two groups, you will thus obtain about one-fifth more for your money from the closed-end shares.
The mutual-fund salesman will be quick to counter with the argument: “Ah, but if you own closed-end shares you can never be sure what price you can sell them for. The discount can be greater than it is today, and you will suffer from the wider spread. With our shares you are guaranteed the right to turn in your shares at 100% of asset value, never less.” Let us examine this argument a bit; it will be a good exercise in logic and plain common sense. Question: Assuming that the discount on closed-end shares does widen, how likely is it that you will be worse off with those shares than with an otherwise equivalent purchase of open-end shares?
TABLE 9-3 Certain Data on Closed-End Funds, Mutual Funds, and S & P Composite Index

This calls for a little arithmetic. Assume that Investor A buys some open-end shares at 109% of asset value, and Investor B buys closed-end shares at 85% thereof, plus 1½% commission. Both sets of shares earn and pay 30% of this asset value in, say, four years, and end up with the same value as at the beginning. Investor A redeems his shares at 100% of value, losing the 9% premium he paid. His overall return for the period is 30% less 9%, or 21% on asset value. This, in turn, is 19% on his investment. How much must Investor B realize on his closed-end shares to obtain the same return on his investment as Investor A? The answer is 73%, or a discount of 27% from asset value. In other words, the closed-end man could suffer a widening of 12 points in the market discount (about double) before his return would get down to that of the open-end investor. An adverse change of this magnitude has happened rarely, if ever, in the history of closed-end shares. Hence it is very unlikely that you will obtain a lower overall return from a (representative) closed-end company, bought at a discount, if its investment performance is about equal to that of a representative mutual fund. If a small-load (or no-load) fund is substituted for one with the usual “8½%” load, the advantage of the closed-end investment is of course reduced, but it remains an advantage.

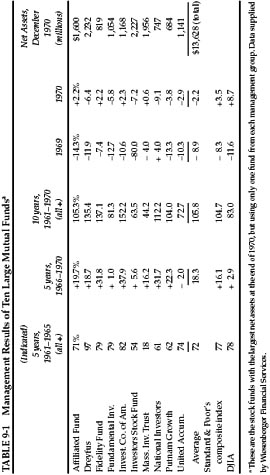
The fact that a few closed-end funds are selling at premiums greater than the true 9% charge on most mutual funds introduces a separate question for the investor. Do these premium companies enjoy superior management of sufficient proven worth to warrant their elevated prices? If the answer is sought in the comparative results for the past five or ten years, the answer would appear to be no. Three of the six premium companies have mainly foreign investments. A striking feature of these is the large variation in prices in a few years’ time; at the end of 1970 one sold at only one-quarter of its high, another at a third, another at less than half. If we consider the three domestic companies selling above asset value, we find that the average of their ten-year overall returns was somewhat better than that of ten discount funds, but the opposite was true in the last five years. A comparison of the 1961–1970 record of Lehman Corp. and of General American Investors, two of our oldest and largest closed-end companies, is given in Table 9-5. One of these sold 14% above and the other 7.6% below its net-asset value at the end of 1970. The difference in price to net-asset relationships did not appear warranted by these figures.
Investment in Balanced Funds
The 23 balanced funds covered in the Wiesenberger Report had between 25% and 59% of their assets in preferred stocks and bonds, the average being just 40%. The balance was held in common stocks. It would appear more logical for the typical investor to make his bond-type investments directly, rather than to have them form part of a mutual-fund commitment. The average income return shown by these balanced funds in 1970 was only 3.9% per annum on asset value, or say 3.6% on the offering price. The better choice for the bond component would be the purchase of United States savings bonds, or corporate bonds rated A or better, or tax-free bonds, for the investor’s bond portfolio.
Commentary on Chapter 9
The schoolteacher asks Billy Bob: “If you have twelve sheep and one jumps over the fence, how many sheep do you have left?”
Billy Bob answers, “None.”
“Well,” says the teacher, “you sure don’t know your subtraction.”
“Maybe not,” Billy Bob replies, “but I darn sure know my sheep.”
—an old Texas joke
Almost Perfect
A purely American creation, the mutual fund was introduced in 1924 by a former salesman of aluminum pots and pans named Edward G. Leffler. Mutual funds are quite cheap, very convenient, generally diversified, professionally managed, and tightly regulated under some of the toughest provisions of Federal securities law. By making investing easy and affordable for almost anyone, the funds have brought some 54 million American families (and millions more around the world) into the investing mainstream—probably the greatest advance in financial democracy ever achieved.
But mutual funds aren’t perfect; they are almost perfect, and that word makes all the difference. Because of their imperfections, most funds underperform the market, overcharge their investors, create tax headaches, and suffer erratic swings in performance. The intelligent investor must choose funds with great care in order to avoid ending up owning a big fat mess.
Top of the Charts
Most investors simply buy a fund that has been going up fast, on the assumption that it will keep on going. And why not? Psychologists have shown that humans have an inborn tendency to believe that the long run can be predicted from even a short series of outcomes. What’s more, we know from our own experience that some plumbers are far better than others, that some baseball players are much more likely to hit home runs, that our favorite restaurant serves consistently superior food, and that smart kids get consistently good grades. Skill and brains and hard work are recognized, rewarded—and consistently repeated—all around us. So, if a fund beats the market, our intuition tells us to expect it to keep right on outperforming.
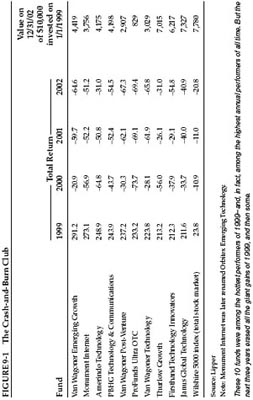
Unfortunately, in the financial markets, luck is more important than skill. If a manager happens to be in the right corner of the market at just the right time, he will look brilliant—but all too often, what was hot suddenly goes cold and the manager’s IQ seems to shrivel by 50 points. Figure 9-1 shows what happened to the hottest funds of 1999.
This is yet another reminder that the market’s hottest market sector—in 1999, that was technology—often turns as cold as liquid nitrogen, with blinding speed and utterly no warning.1 And it’s a reminder that buying funds based purely on their past performance is one of the stupidest things an investor can do. Financial scholars have been studying mutual-fund performance for at least a half century, and they are virtually unanimous on several points:
- the average fund does not pick stocks well enough to overcome its costs of researching and trading them;
- the higher a fund’s expenses, the lower its returns;
- the more frequently a fund trades its stocks, the less it tends to earn;
- highly volatile funds, which bounce up and down more than average, are likely to stay volatile;
- funds with high past returns are unlikely to remain winners for long.2
Your chances of selecting the top-performing funds of the future on the basis of their returns in the past are about as high as the odds that Bigfoot and the Abominable Snowman will both show up in pink ballet slippers at your next cocktail party. In other words, your chances are not zero—but they’re pretty close. (See sidebar, p. 255.)
But there’s good news, too. First of all, understanding why it’s so hard to find a good fund will help you become a more intelligent investor. Second, while past performance is a poor predictor of future returns, there are other factors that you can use to increase your odds of finding a good fund. Finally, a fund can offer excellent value even if it doesn’t beat the market—by providing an economical way to diversify your holdings and by freeing up your time for all the other things you would rather be doing than picking your own stocks.
The First shall be Last
Why don’t more winning funds stay winners?
The better a fund performs, the more obstacles its investors face:
Migrating managers. When a stock picker seems to have the Midas touch, everyone wants him—including rival fund companies. If you bought Transamerica Premier Equity Fund to cash in on the skills of Glen Bickerstaff, who gained 47.5% in 1997, you were quickly out of luck; TCW snatched him away in mid-1998 to run its TCW Galileo Select Equities Fund, and the Transamerica fund lagged the market in three of the next four years. If you bought Fidelity Aggressive Growth Fund in early 2000 to capitalize on the high returns of Erin Sullivan, who had nearly tripled her shareholders’ money since 1997, oh well: She quit to start her own hedge fund in 2000, and her former fund lost more than three-quarters of its value over the next three years.3
Asset elephantiasis. When a fund earns high returns, investors notice—often pouring in hundreds of millions of dollars in a matter of weeks. That leaves the fund manager with few choices—all of them bad. He can keep that money safe for a rainy day, but then the low returns on cash will crimp the fund’s results if stocks keep going up. He can put the new money into the stocks he already owns—which have probably gone up since he first bought them and will become dangerously overvalued if he pumps in millions of dollars more. Or he can buy new stocks he didn’t like well enough to own already—but he will have to research them from scratch and keep an eye on far more companies than he is used to following.
Finally, when the $100-million Nimble Fund puts 2% of its assets (or $2 million) in Minnow Corp., a stock with a total market value of $500 million, it’s buying up less than one-half of 1% of Minnow. But if hot performance swells the Nimble Fund to $10 billion, then an investment of 2% of its assets would total $200 million—nearly half the entire value of Minnow, a level of ownership that isn’t even permissible under Federal law. If Nimble’s portfolio manager still wants to own small stocks, he will have to spread his money over vastly more companies—and probably end up spreading his attention too thin.
No more fancy footwork. Some companies specialize in “incubating” their funds—test-driving them privately before selling them publicly. (Typically, the only shareholders are employees and affiliates of the fund company itself.) By keeping them tiny, the sponsor can use these incubated funds as guinea pigs for risky strategies that work best with small sums of money, like buying truly tiny stocks or rapid-fire trading of initial public offerings. If its strategy succeeds, the fund can lure public investors en masse by publicizing its private returns. In other cases, the fund manager “waives” (or skips charging) management fees, raising the net return—then slaps the fees on later after the high returns attract plenty of customers. Almost without exception, the returns of incubated and fee-waived funds have faded into mediocrity after outside investors poured millions of dollars into them.
Rising expenses. It often costs more to trade stocks in very large blocks than in small ones; with fewer buyers and sellers, it’s harder to make a match. A fund with $100 million in assets might pay 1% a year in trading costs. But, if high returns send the fund mushrooming up to $10 billion, its trades could easily eat up at least 2% of those assets. The typical fund holds on to its stocks for only 11 months at a time, so trading costs eat away at returns like a corrosive acid. Meanwhile, the other costs of running a fund rarely fall—and sometimes even rise—as assets grow. With operating expenses averaging 1.5%, and trading costs at around 2%, the typical fund has to beat the market by 3.5 percentage points per year before costs just to match it after costs!
Sheepish behavior. Finally, once a fund becomes successful, its managers tend to become timid and imitative. As a fund grows, its fees become more lucrative—making its managers reluctant to rock the boat. The very risks that the managers took to generate their initial high returns could now drive investors away—and jeopardize all that fat fee income. So the biggest funds resemble a herd of identical and overfed sheep, all moving in sluggish lockstep, all saying “baaaa” at the same time. Nearly every growth fund owns Cisco and GE and Microsoft and Pfizer and Wal-Mart—and in almost identical proportions. This behavior is so prevalent that finance scholars simply call it herding.4 But by protecting their own fee income, fund managers compromise their ability to produce superior returns for their outside investors.
FIGURE 9-2 The Funnel of Fund Performance
Looking back from December 31, 2002, how many U.S. stock funds outperformed Vanguard 500 Index Fund?
One year:
1,186 of 2,423 funds (or 48.9%)
Three years:
1,157 of 1,944 funds (or 59.5%)
Five years:
768 of 1,494 funds (or 51.4%)
Ten years:
227 of 728 funds (or 31.2%)
Fifteen years:
125 of 445 funds (or 28.1%)
Twenty years:
37 of 248 funds (or 14.9%)
Source: Lipper Inc.
Because of their fat costs and bad behavior, most funds fail to earn their keep. No wonder high returns are nearly as perishable as unrefrigerated fish. What’s more, as time passes, the drag of their excessive expenses leaves most funds farther and farther behind, as Figure 9.2 shows.5
What, then, should the intelligent investor do?
First of all, recognize that an index fund—which owns all the stocks in the market, all the time, without any pretense of being able to select the “best” and avoid the “worst”—will beat most funds over the long run. (If your company doesn’t offer a low-cost index fund in your 401(k), organize your coworkers and petition to have one added.) Its rock-bottom overhead—operating expenses of 0.2% annually, and yearly trading costs of just 0.1%—give the index fund an insurmountable advantage. If stocks generate, say, a 7% annualized return over the next 20 years, a low-cost index fund like Vanguard Total Stock Market will return just under 6.7%. (That would turn a $10,000 investment into more than $36,000.) But the average stock fund, with its 1.5% in operating expenses and roughly 2% in trading costs, will be lucky to gain 3.5% annually. (That would turn $10,000 into just under $20,000—or nearly 50% less than the result from the index fund.)
Index funds have only one significant flaw: They are boring. You’ll never be able to go to a barbecue and brag about how you own the top-performing fund in the country. You’ll never be able to boast that you beat the market, because the job of an index fund is to match the market’s return, not to exceed it. Your index-fund manager is not likely to “roll the dice” and gamble that the next great industry will be teleportation, or scratch-’n’-sniff websites, or telepathic weight-loss clinics; the fund will always own every stock, not just one manager’s best guess at the next new thing. But, as the years pass, the cost advantage of indexing will keep accruing relentlessly. Hold an index fund for 20 years or more, adding new money every month, and you are all but certain to outper-forms the vast majority of professional and individual investors alike. Late in his life, Graham praised index funds as the best choice for individual investors, as does Warren Buffett.6
Tilting the Tables
When you add up all their handicaps, the wonder is not that so few funds beat the index, but that any do. And yet, some do. What qualities do they have in common?
Their managers are the biggest shareholders. The conflict of interest between what’s best for the fund’s managers and what’s best for its investors is mitigated when the managers are among the biggest owners of the fund’s shares. Some firms, like Longleaf Partners, even forbid their employees from owning anything but their own funds. At Longleaf and other firms like Davis and FPA, the managers own so much of the funds that they are likely to manage your money as if it were their own—lowering the odds that they will jack up fees, let the funds swell to gargantuan size, or whack you with a nasty tax bill. A fund’s proxy statement and Statement of Additional Information, both available from the Securities and Exchange Commission through the EDGAR database at www.sec.gov, disclose whether the managers own at least 1% of the fund’s shares.
They are cheap. One of the most common myths in the fund business is that “you get what you pay for”—that high returns are the best justification for higher fees. There are two problems with this argument. First, it isn’t true; decades of research have proven that funds with higher fees earn lower returns over time. Secondly, high returns are temporary, while high fees are nearly as permanent as granite. If you buy a fund for its hot returns, you may well end up with a handful of cold ashes—but your costs of owning the fund are almost certain not to decline when its returns do.
They dare to be different. When Peter Lynch ran Fidelity Magellan, he bought whatever seemed cheap to him—regardless of what other fund managers owned. In 1982, his biggest investment was Treasury bonds; right after that, he made Chrysler his top holding, even though most experts expected the automaker to go bankrupt; then, in 1986, Lynch put almost 20% of Fidelity Magellan in foreign stocks like Honda, Norsk Hydro, and Volvo. So, before you buy a U.S. stock fund, compare the holdings listed in its latest report against the roster of the S & P 500 index; if they look like Tweedledee and Tweedledum, shop for another fund.7
They shut the door. The best funds often close to new investors—permitting only their existing shareholders to buy more. That stops the feeding frenzy of new buyers who want to pile in at the top and protects the fund from the pains of asset elephantiasis. It’s also a signal that the fund managers are not putting their own wallets ahead of yours. But the closing should occur before—not after—the fund explodes in size. Some companies with an exemplary record of shutting their own gates are Longleaf, Numeric, Oakmark, T. Rowe Price, Vanguard, and Wasatch.
They don’t advertise. Just as Plato says in The Republic that the ideal rulers are those who do not want to govern, the best fund managers often behave as if they don’t want your money. They don’t appear constantly on financial television or run ads boasting of their No. 1 returns. The steady little Mairs & Power Growth Fund didn’t even have a website until 2001 and still sells its shares in only 24 states. The Torray Fund has never run a retail advertisement since its launch in 1990.
What else should you watch for? Most fund buyers look at past performance first, then at the manager’s reputation, then at the riskiness of the fund, and finally (if ever) at the fund’s expenses.8
The intelligent investor looks at those same things—but in the opposite order.
Since a fund’s expenses are far more predictable than its future risk or return, you should make them your first filter. There’s no good reason ever to pay more than these levels of annual operating expenses, by fund category:
- Taxable and municipal bonds: 0.75%
- U.S. equities (large and mid-sized stocks): 1.0%
- High-yield (junk) bonds: 1.0%
- U.S. equities (small stocks): 1.25%
- Foreign stocks: 1.50%9
Next, evaluate risk. In its prospectus (or buyer’s guide), every fund must show a bar graph displaying its worst loss over a calendar quarter. If you can’t stand losing at least that much money in three months, go elsewhere. It’s also worth checking a fund’s Morningstar rating. A leading investment research firm, Morningstar awards “star ratings” to funds, based on how much risk they took to earn their returns (one star is the worst, five is the best). But, just like past performance itself, these ratings look back in time; they tell you which funds were the best, not which are going to be. Five-star funds, in fact, have a disconcerting habit of going on to underperform one-star funds. So first find a low-cost fund whose managers are major shareholders, dare to be different, don’t hype their returns, and have shown a willingness to shut down before they get too big for their britches. Then, and only then, consult their Morningstar rating.10
Finally, look at past performance, remembering that it is only a pale predictor of future returns. As we’ve already seen, yesterday’s winners often become tomorrow’s losers. But researchers have shown that one thing is almost certain: Yesterday’s losers almost never become tomorrow’s winners. So avoid funds with consistently poor past returns—especially if they have above-average annual expenses.
The Closed World of Closed-End Funds
Closed-end stock funds, although popular during the 1980s, have slowly atrophied. Today, there are only 30 diversified domestic equity funds, many of them tiny, trading only a few hundred shares a day, with high expenses and weird strategies (like Morgan Fun-Shares, which specializes in the stocks of “habit-forming” industries like booze, casinos, and cigarettes). Research by closed-end fund expert Donald Cassidy of Lipper Inc. reinforces Graham’s earlier observations: Diversified closed-end stock funds trading at a discount not only tend to outper-forms those trading at a premium but are likely to have a better return than the average open-end mutual fund. Sadly, however, diversified closed-end stock funds are not always available at a discount in what has become a dusty, dwindling market.11
But there are hundreds of closed-end bond funds, with especially strong choices available in the municipal-bond area. When these funds trade at a discount, their yield is amplified and they can be attractive, so long as their annual expenses are below the thresholds listed above.12
The new breed of exchange-traded index funds can be worth exploring as well. These low-cost “ETFs” sometimes offer the only means by which an investor can gain entrée to a narrow market like, say, companies based in Belgium or stocks in the semiconductor industry. Other index ETFs offer much broader market exposure. However, they are generally not suitable for investors who wish to add money regularly, since most brokers will charge a separate commission on every new investment you make.13
Know When to Fold ’Em
Once you own a fund, how can you tell when it’s time to sell? The standard advice is to ditch a fund if it underperforms the market (or similar portfolios) for one—or is it two?—or is it three?—years in a row. But this advice makes no sense. From its birth in 1970 through 1999, the Sequoia Fund underperformed the S & P 500 index in 12 out of its 29 years—or more than 41% of the time. Yet Sequoia gained more than 12,500% over that period, versus 4,900% for the index.14
The performance of most funds falters simply because the type of stocks they prefer temporarily goes out of favor. If you hired a manager to invest in a particular way, why fire him for doing what he promised? By selling when a style of investing is out of fashion, you not only lock in a loss but lock yourself out of the all-but-inevitable recovery. One study showed that mutual-fund investors underperformed their own funds by 4.7 percentage points annually from 1998 through 2001—simply by buying high and selling low.15
So when should you sell? Here a few definite red flags:
- a sharp and unexpected change in strategy, such as a “value” fund loading up on technology stocks in 1999 or a “growth” fund buying tons of insurance stocks in 2002;
- an increase in expenses, suggesting that the managers are lining their own pockets;
- large and frequent tax bills generated by excessive trading;
- suddenly erratic returns, as when a formerly conservative fund generates a big loss (or even produces a giant gain).
WHY WE LOVE OUR OUIJA BOARDS
Believing—or even just hoping—that we can pick the best funds of the future makes us feel better. It gives us the pleasing sensation that we are in charge of our own investment destiny. This “I’m-in-control-here” feeling is part of the human condition; it’s what psychologists call overconfidence. Here are just a few examples of how it works:
- In 1999, Money Magazine asked more than 500 people whether their portfolios had beaten the market. One in four said yes. When asked to specify their returns, however, 80% of those investors reported gains lower than the market’s. (Four percent had no idea how much their portfolios rose—but were sure they had beaten the market anyway!)
- A Swedish study asked drivers who had been in severe car crashes to rate their own skills behind the wheel. These people—including some the police had found responsible for the accidents and others who had been so badly injured that they answered the survey from their hospital beds—insisted they were better-than-average drivers.
- In a poll taken in late 2000, Time and CNN asked more than 1,000 likely voters whether they thought they were in the top 1% of the population by income. Nineteen percent placed themselves among the richest 1% of Americans.
- In late 1997, a survey of 750 investors found that 74% believed their mutual-fund holdings would “consistently beat the Standard & Poor’s 500 each year”—even though most funds fail to beat the S & P 500 in the long run and many fail to beat it in any year.1
While this kind of optimism is a normal sign of a healthy psyche, that doesn’t make it good investment policy. It makes sense to believe you can predict something only if it actually is predictable. Unless you are realistic, your quest for self-esteem will end up in self-defeat.
As the investment consultant Charles Ellis puts it, “If you’re not prepared to stay married, you shouldn’t get married.”16 Fund investing is no different. If you’re not prepared to stick with a fund through at least three lean years, you shouldn’t buy it in the first place. Patience is the fund investor’s single most powerful ally.