
Case Study 2
Normalizing Tool Data in a Security Posture Assessment
This case study from Mike Burg shows how difficult it can be to get to the point at which you have something meaningful to measure. Mike has been involved in vulnerability assessments for many years and was extremely proficient in delivering results based on the data outputs of a variety of tools. It was only when he was asked to perform some analyses that involved synthesizing (rather than reporting) different data sets that Mike discovered how intractable some problems can be. We often neglect to consider our data before we begin measuring something, but unless our data is completely homogenous (which almost never happens), our analysis and conclusions can suffer significantly.
Mike provides some good examples of “hacking” data sources to make them work better together. Mike is one of the most tenacious problem solvers I know, and when he sinks his teeth into a challenge, he rarely lets go. Understanding how he recursively solved his data normalization problems, where each breakthrough seemed to lead only to a new hurdle to be overcome, is a fascinating story. Hopefully, you will benefit from Mike’s examples and save yourself some of the heartburn he experienced.
Case Study 2: Normalizing Tool Data in a Security Posture Assessment
by Mike Burg
One of the challenges that many organizations face in the course of implementing a security program based on metrics is cleaning and normalizing the enormous amount of data collected by today’s security tools so that it can be effectively analyzed and used. Whether they realize it or not, most organizations collect disparate types of security-centric technical data. Each of the different data types output by different tools has its own structure and is often output in different formats (XML, CSV, HTML, or proprietary formats). This case study considers one specific type of data—vulnerability assessment data—and outlines the problems associated with normalizing the data output by these diverse toolsets without negatively affecting its integrity. This case study specifically focuses on Cisco’s Security Posture Assessment (SPA) team’s experiences with handling and analyzing vulnerability assessment data.
Background: Overview of the SPA Service
In 1997, Cisco Systems acquired the Wheel Group, a small independent security company based in San Antonio, Texas. The Wheel Group had a small penetration testing team mainly composed of ex-military information security officers from the U.S. Air Force. This team developed a SPA methodology based on their work at the Air Force and the private sector, and Cisco Systems has continued to offer this SPA service for the 11 years since the acquisition.
The SPA is a vulnerability assessment/penetration testing service that aims to discover and enumerate vulnerabilities in servers, workstations, and network devices on an IP network. SPA engineers then make recommendations as to how to prioritize resources to address these vulnerabilities based on business objectives and risk. Although the service has changed and developed since the Wheel Group was acquired, the main objective of the SPA is still the same. Cisco offers five different types of SPA: Internal, Internet Perimeter, Wireless, Dial, and Web Application.
The Internal and Internet Perimeter SPAs are still the most common assessments performed, and the examples in this case study focus on these services. The assessments are similar in nature except for their attack vectors: the Internal SPA is performed from the perspective of an average corporate user connected to the internal network, whereas the Internet Perimeter SPA is performed from outside the corporate network perimeter, assuming the same view as the average Internet user. The only information (other than logistics) that is provided by the customer prior to the SPA engineers arriving onsite at the client location (if an internal assessment) are the network address ranges that are to be assessed.
Assessments are accomplished in four phases:
1. Discovery.
2. Confirm.
3. Analysis.
4. Report.
The four phases are the same for all of the SPA offerings. Cisco SPA engineers use a variety of different tools in each one of these phases that are described in the following sections.
The Discovery phase of the assessment is where the process begins. The goal of this phase is to gain an understanding of how the network is designed and what types of devices and services are present on the network. During this phase, all IP addresses that are in scope of the assessment are scanned to discover information including the following:
![]() Determining whether a device is present at the scanned IP address
Determining whether a device is present at the scanned IP address
![]() Determining on what TCP/UDP ports the device is listening
Determining on what TCP/UDP ports the device is listening
![]() Determining what type of device it is (server, workstation, network device, printer)
Determining what type of device it is (server, workstation, network device, printer)
![]() Determining the operating system
Determining the operating system
This information is then used as input for the next tests that will be run against the active devices.
Phase two of the process is the Confirm phase. The goal of this phase is to use the information that was obtained in the Discovery phase and attempt to compromise any exploitable vulnerability that may exist. The key objective in this phase is not only to try and exploit vulnerabilities but, just as important, to confirm manually whether or not the identified potential vulnerabilities actually exist. The manual confirmation of the vulnerabilities removes uncertainty about the findings and uncovers false positives reported from the toolset.
Following are some of the activities that are performed in this phase:
![]() Brute force login attempts
Brute force login attempts
![]() Default username and password login attempts
Default username and password login attempts
![]() SNMP easily guessable read and write strings
SNMP easily guessable read and write strings
![]() Cross-site scripting web sites
Cross-site scripting web sites
![]() Buffer overflows attempts
Buffer overflows attempts
After the SPA team gains access to a device, they search for information that may help to exploit the network further. This information might be obtained from unsecured sensitive files that contain passwords, by observing users on their desktops via an exploited or unsecured remote control program, or by dumping the username/password databases and then cracking passwords. Armed with this new data, secondary and tertiary exploitation takes place.
The third phase of the process is the Analysis phase. The objective of this phase is to document the process and steps that were used to compromise the network and analyze the data from the tools using up-to-date security intelligence. Generating descriptive statistics from the obtained data is a primary function of this phase. The SPA team uses these statistics to help the client understand the types of information and vulnerabilities that were discovered during the assessment. They also use the information to help prioritize the vulnerabilities based upon stated business objectives and risks.
The final phase of the process is the Report phase. A detailed report is created that contains a full summary of the assessment. Included in the report is information about each device that was assessed as well as methods to use to mitigate the risks that were present. A final set of CSV (comma-separated values) files are provided to the customers that contain all the information that was gathered from the tools. These files can then be incorporated into the organization’s existing metrics programs.
Many customers have us perform Security Posture Assessments on a periodic basis (usually annually). In general, three different outcomes are associated with repeated SPAs. Some organizations look to identify the root cause of the discovered vulnerabilities and attempt to correct those causes (which are usually process or governance related) in addition to remediating the discrete vulnerabilities. These companies are generally very successful in increasing their security posture, and follow-on assessments usually uncover fewer vulnerabilities. The second type of organization looks only to correct the discrete vulnerabilities that were identified and nothing else (for example, by applying security patches to fix the identified vulnerabilities, not attempting to determine or correct why or how the process broke down). More often than not, subsequent assessments performed for this type of customer uncover the same classes of vulnerabilities uncovered in the previous assessment (even if the previously identified vulnerabilities were fixed), because little or nothing was done to correct the process failures that allowed the introduction of the vulnerabilities in the first place. The final type of customer simply looks to satisfy a requirement to have an assessment performed and does little or nothing to correct even the technical (as opposed to process) weaknesses that were identified.
SPA Tools
Several different tools are used during the four phases of the process. These tools are a combination of open source (a few of which are described in the following sections) and custom programs written in Perl, Python, and Bourne shell scripts. One advantage of using open source tools is that you can modify them. Because the SPA service has evolved over time, so has the toolset, including added third-party tools.
Nmap is one of the primary open source tools used during the Discovery phase. Nmap is specifically used to determine active IP addresses, to fingerprint operating systems, and to enumerate open ports. The SPA team has modified Nmap and other open source tools better to align with the SPA methodology. Where possible, these modifications are submitted to the relevant open source project maintaining the tool so that they can be eventually incorporated into future releases.
Metasploit is another open source tool used during the Confirm phase. The SPA team created a detailed process for researching, identifying, coding, and testing exploits, and Metasploit is used to supplement this process. This community-maintained tool includes many different types of exploits that are usable against network-accessible services. Each of these exploits is rigorously tested in the SPA labs against target devices and validated for expected operation.
The SPA team also uses third-party tools for the Discovery, Confirm, and Analysis phases. One of these tools offers built-in vulnerability identification and classification information. A key advantage of using the third-party tool is that the vendor is dedicated to identifying the most current threats and has resources to incorporate new vulnerability checks and exploits into the tool. Each of the tools described has its own unique challenges when it comes to data output; these are described in detail in the following section.
Data Structures
The primary challenge we faced when integrating many different types of tools into a complex process such as the SPA was to understand the data structure’s output by each tool. In the case of open source software, this can be challenging, because numerous developers often contribute to the code. Third-party tools can also be problematic, because their data structures may be obscure and not easy to manipulate, and the vendors do not provide source code.
To deal with all these different tool outputs during the course of a SPA, we decided to normalize all the different output into a CSV type format. A different set of tools was developed for the SPA service to parse the data output of each vulnerability tool and normalize it.
We needed to understand the type of information to be analyzed and reported on. This was the second challenge that was addressed by the team. The SPA methodology focuses on 14 major items, each containing subsections. Figure 1 displays these sections and some examples of the metadata contained within them. In most cases, the metadata within the subsections is structured, but as you will see, this did not always hold true.
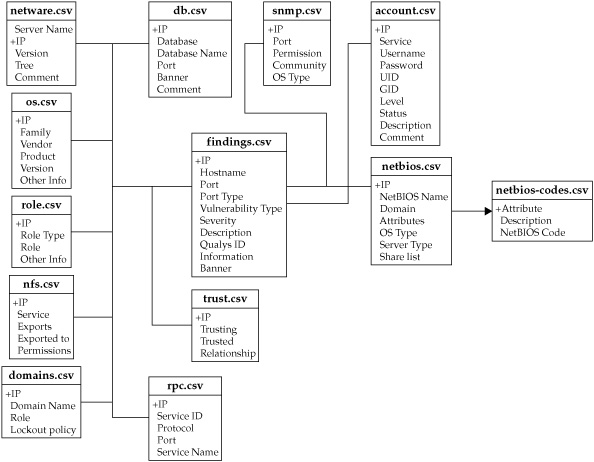
Figure 1. SPA data structure
Objectives of the Case Study
In an effort to improve the SPA service and as a result of some specific customer need, we needed to change and expand our data analysis efforts and process. Our customer requested that we build more measurement and trending capabilities into the service and the findings of our relatively “snapshot-like” assessments. They also wanted more insight into how different entities and systems could be compared against one another and against developed baselines. This case study explores some of the data normalization and analysis challenges that we experienced as we attempted to bring together output from multiple tools in multiple formats and to make that data usable for analysis and “apples-to-apples” comparisons.
The first phase of this assessment focused on two different business units in one country. One of the key requirements from the customer was an analysis of the differences (if any) of the security posture and vulnerability severity of the different business units using the SPA data.
Methodology
The SPA service includes several ways of characterizing identified vulnerabilities, including severity metrics based on the Common Vulnerability Scoring System (CVSS), an industry-recognized framework for assessing the severity of identified security vulnerabilities. CVSS scores describe how severe an IT system vulnerability is considered to be based on a cross-industry consensus of security experts. These scores determine how much concern a particular vulnerability warrants and support efforts to prioritize vulnerability remediation.
Three CVSS metrics exist (although the Cisco assessment team used only Base and Temporal scores for this assessment):
![]() Base Intrinsic qualities of the vulnerability
Base Intrinsic qualities of the vulnerability
![]() Temporal Qualities that evolve over the lifetime of the vulnerability
Temporal Qualities that evolve over the lifetime of the vulnerability
![]() Environmental Qualities that depend upon environment or implementation
Environmental Qualities that depend upon environment or implementation
Challenges
Having provided background regarding the service, I can now discuss some of the data normalization challenges that we encountered. In particular I will focus on challenges related to the scoring system and the data structures.
Scoring
Using CVSS scores presented certain challenges when we tried to pull this information from several different sources; we discovered that the links between vulnerability identification information and the CVSS scores themselves were not always directly linked. In some instances, items that we classified as vulnerabilities within the SPA tools were not represented in the CVSS database. Many of these unscored vulnerabilities were exploited in the assessment, and we had to decide whether or not to include the findings in the analysis. If these findings were disregarded, we would be missing out on a large chunk of data for both states that were assessed; if they were included, we would need to assign CVSS scores. We ultimately decided that the vulnerabilities would be included in the findings.
A complex formula and scoring guideline can be used to determine Base, Temporal, and Environmental scores. Using these guidelines, we were able to assign custom scores for both Base and Temporal Metrics to the unscored vulnerabilities. To ensure that the new scores were reasonable, we compared them to similar types of vulnerabilities with assigned CVSS scores. After this sanity check was complete, the new values were entered into our vulnerability data set. Unfortunately, any score that we generated would not be industry recognized, but a full write-up of the adjusted CVSS scores was included in the final report to the customer.
The scoring challenge illustrates the problem that occurs when data is not standardized completely across sources. Different data sources in the assessment treated CVSS scores in different ways and the result was that some links between vulnerabilities and CVSS scores were not present or not reliable. In this case, we could either omit any non-standard data or map that data to CVSS. Our solution was to include rather than disregard non-standard data even if that meant creating CVSS scores that were not industry recognized. The benefit of creating these scores for vulnerabilities was that the data could be normalized against the CVSS standard, but it was very important that we explained what we had done and provided details on how we created the non-standard scores so that the customer was aware of why we scored vulnerabilities in certain ways.
Data Structure
While scoring was a challenge for normalizing what data meant, the harder challenge was normalizing data sources that were structured differently. As discussed earlier, the outputs of the SPA tools are flat CSV-formatted files. The SPA tools are designed to combine the CSV files and generate an HTML report, which is structured so that specific details about the individual hosts and vulnerabilities can be accessed for detailed analysis. While this HTML structure works well for traditional SPA analyses, it did not work so well for this specialized SPA analysis, because the structure of HTML does not lend itself to efficient data management and manipulation.
We decided that the specialized SPA analysis would include the following variables:
![]() IP address
IP address
![]() Operating system type
Operating system type
![]() Location
Location
![]() Vulnerability
Vulnerability
![]() SPA identification number
SPA identification number
![]() Vulnerability name
Vulnerability name
![]() CVSS base
CVSS base
![]() CVSS temporal scores
CVSS temporal scores
Each variable for a SPA is normally stored as metadata within multiple CSV files. We encountered problems with this type of native structure. First, the flat file nature of CSV does not present the most efficient way to handle large sets of data. If the CSV files were used for the service, a script would have to be created to gather the data that was needed from the appropriate files. Second, comparing and contrasting different CSV files across multiple customers can be quite cumbersome.
While a CSV file could work fine for smaller or single stand-alone engagements, we decided instead to use a MySQL database for this customer. MySQL is an open source relational database management system (RDBMS) that has made its source code available using the GNU general public license. MySQL can import raw CSV files into tables, which makes the move from CSV file format to a database format much easier.
After we decided to use a relational database, we next created the database structure. The customer database contained tables that included the data from each of the CSV files that the SPA tools generated. Everything seemed straightforward enough to proceed with the creation of the database according to our new structure. After the database was created, we began to populate the tables with the appropriate corresponding CSV file, and at this point, we began running into issues with several of the vulnerability data files.
The first file that we imported into the database was called findings.csv, and contained the following five fields that we were interested in analyzing:
![]() IP Address
IP Address
![]() Port
Port
![]() Vulnerability Type
Vulnerability Type
![]() Description
Description
![]() Vulnerability ID
Vulnerability ID
Two of the five fields in this CSV did not cause any problems (IP Address and Description). Port, Vulnerability Type, and Vulnerability ID, however, were different stories. Some of our tools ended up contributing to our data normalization challenges due to the way they reported services and vulnerabilities.
findings.csv File (Port) The Port field of the findings.csv file is designed to provide a listing of the open TCP/IP ports on an IP-connected device. The field lists TCP and UDP ports that are represented by up to five digits followed by the protocol. For example, 111TCP represents TCP port 111. Unfortunately, there were exceptions to this structure that we discovered as we populated the database. One of the tools that we used to determine ports not only classified ports by numbers (which is standard), but could also classify them as a vulnerability type or service. One of our tools refers to this type of classification as “pseudo ports.” Although these designations are not standard ports as previously discussed, the tool makes use of them in an attempt to identify the nature of the service for the vulnerabilities identified.
One of the reasons the tool listed out the nature of the service or vulnerability as opposed to the port on which it was received was that, in many cases, the service or vulnerability was gathered from many different ports that had been scanned, and then a backend process was run to group the ports together into a single service or vulnerability.
To understand this, let’s take a closer look at this port identification process. During the Discovery phase of a SPA, information is sent to listening network services on hosts, which may cause the backend service to return some type of information. A clear and easy example that will illustrate this is to take a look at the response from a Windows XP client machine. This example uses the open source tool Nmap:
sh-3.2$ nmap -sC smb-enum-sessions 172.16.2.128
Starting Nmap 5.00 ( http://nmap.org ) at 2009-12-17 10:25 MST
Interesting ports on xp-machine (172.16.2.128):
Not shown: 997 closed ports
PORT STATE SERVICE
135/tcp open msrpc
139/tcp open netbios-ssn
445/tcp open microsoft-ds
Host script results:
|_ nbstat: NetBIOS name: REDZVM, NetBIOS user: <unknown>, NetBIOS MAC:
00:0c:29:91:e9:ee
| smb-os-discovery: Windows XP
| LAN Manager: Windows 2000 LAN Manager
| Name: WORKGROUPREDZVM
|_ System time: 2009-12-17 10:25:28 UTC-7
Nmap done: 1 IP address (1 host up) scanned in 1.28 seconds
A few items are important in this scan. Note that both TCP port 139 and TCP port 445 are open. These are Microsoft NetBIOS ports. NetBIOS provides a mechanism that allows applications on different Windows hosts to communicate with each other over the network.
139/tcp open netbios-ssn
445/tcp open microsoft-ds
The remaining information from the scan is obtained from the same tool connecting to those ports.
|_ nbstat: NetBIOS name: REDZVM, NetBIOS user: <unknown>, NetBIOS MAC:
00:0c:29:91:e9:ee
| smb-os-discovery: Windows XP
| LAN Manager: Windows 2000 LAN Manager
| Name: WORKGROUPREDZVM
|_ System time: 2009-12-17 10:25:28 UTC-7
In this example, it is possible to access the NetBIOS service anonymously to enumerate potentially sensitive information about system resources present on the host, including items such as user accounts or shared resources, as shown. This sort of vulnerability can be exploited on both TCP ports 139 and 445. The third-party tool we used would classify this as a pseudo service called “Windows” as opposed to individually listing the ports and associating the vulnerability with each of them.
Another example of a pseudo service is easily guessable TCP sequence numbers. This sort of vulnerability is a result of a poorly written TCP/IP stack for an operating system. If the TCP sequence numbers are guessed by an attacker while two other IP-connected hosts are communicating, the only difference between the legitimate connection and a malicious connection initiated by the attacker is that the attacker will not see the replies returned to the authorized user whose IP address was forged. This type of vulnerability is not tied to any single specific TCP port; instead, it would affect all ports because it is a problem with the underlying TCP/IP stack. The pseudo service that the third-party tool assigns to this vulnerability is “TCP/IP”.
Another reason the tool we use focuses on the service rather than the port during analysis has to do with the tool’s methodology and design. Some tools take a “vulnerability-centric” approach to reporting vulnerabilities. This vulnerability-centric approach means that declaring on what port a particular vulnerability was identified is not as important as the vulnerability itself. The SPA philosophy for reporting vulnerabilities differs from this: it is a “port-centric” assessment. There is no necessarily right or wrong answer regarding how to classify vulnerabilities from a philosophical point of view—these are just two different ways of approaching that classification.
As you can see from the examples, the pseudo services created a normalization problem and we were faced with an important decision: whether or not to include pseudo services in our analysis. We had three different options, of which only two seemed reasonable. The first option was to try to determine the actual port or ports on which a given vulnerability was identified and then replace the vendor information (pseudo service) with standard port numbers and protocols. Unfortunately, this was impossible because some of our tools were proprietary and we could not access this information.
The second option was simply to remove any row that contained anything other than the standard TCP/IP port and protocol. Remember that the “nature of the services or vulnerability” designators may have vulnerabilities associated with them in the same manner as a line that had the standard TCP/IP ports. If these rows were removed, we would also be removing any potential vulnerability/vulnerabilities that were associated with them, which in turn might skew the data.
The final option (which was the one that we settled on) was simply to include the information in that data set. The decision not to alter the data enabled us to report on all the vulnerabilities without sacrificing anything. This decision did require us to put a detailed explanation of the pseudo services in the final SPA service report delivered to customers. In this case we kept data regarding ports that was not normalized in order to be comprehensive and we provided the customer with extra information to help them understand the pseudo services descriptions.
findings.csv File (Vulnerability Type) The Vulnerability Type field presented a unique challenge within the data set. The format of the data in our findings.csv file was standard for a CSV file. The file contained columns, or fields, separated by rows that contained the appropriate information gathered from the tool. Each column within the CSV file showed quotation marks around the data in that column, which represented a separate field for the SPA data. But it turned out that it was possible to have values within the Vulnerability Type field that contained commas. Having commas within a field was a problem. To input data into a MySQL database, you must declare how the fields are separated. CSV columns are separated by commas, and if commas appear within a field (as opposed to separating the field only), each item on either side of the comma is treated as a new field, which can throw off the whole structure of the import.
Here’s an example to demonstrate this problem. Suppose that a CSV file is located at/tmp/import-data.csv and has three fields (IP Address, OS, Vulnerability Name). This file contains the following values:
"1.1.1.1","windows","ISAPI Extension Service Buffer Overflow"
"2.2.2.2","windows","iisadmin Directory Present Vulnerability"
In addition, we create a MySQL database called test with columns for IP address, OS, and vulnerability name that contains a table called values.
mysql>create database test;
mysql>use test;
mysql>create table test_values (ip varchar(15), os varchar(20),
vulnerability varchar(60), id int not null auto_increment, primary key
(id));
Next, we load the CSV file into the newly created table. The following command will parse through the CSV file, split the file based on the commas, and then enter the values into the appropriate field of the table in the database. In this case, the data will be imported without issue into the tables:
mysql>load data local infile '/tmp/import-data.csv' into table
values fields terminated by ',' lines terminated by '
' (ip, os,
vulnerability);
The table will appear as shown in Figure 2.
Now let’s modify our CSV file and add a comma into the vulnerability column. Our new CSV file looks like this:
"1.1.1.1","windows","ISAPI, Extension for Windows Media Service Buffer Overflow"
"2.2.2.2","windows","iisadmin Directory Present Vulnerability"
Notice the comma after ISAPI in the vulnerability column. When this CSV is imported into the database, it will generate a warning stating that the row was truncated because it contained more data than there were input columns. The value in the vulnerability field for the first row in the table contains only ISAPI and one quotation mark. The rest of the data in the column is truncated. If we were to select everything in the table, the results would look like Figure 3.
As you can imagine from the example, this outcome represented a problem for the SPA and we needed to come up with a solution on how to fix the CSV import. To overcome this issue with our data, we decided to write a quick script to open the file and delete any commas that followed an alphabetic character. The regex substitution string looked like this:
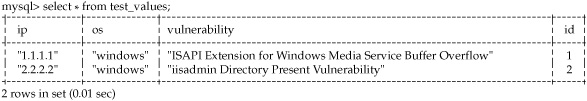
Figure 2. MySQL clean CSV import
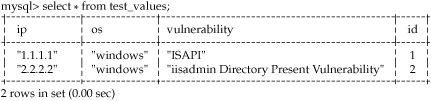
Figure 3. MySQL truncated CSV import
`s/[a-zA-Z],//g`
This script worked well, and we were finally in a position to import the CSV files into the database cleanly. As much as I wish that this was the end of our difficulties, we quickly ran into another issue.
findings.csv File (VID) One of the key fields that we wanted to analyze was the CVSS score discussed previously. Two important files were needed to obtain this information. The findings.csv contained information such as IP address, hostname, confirmation status, and vid (a field containing an identification number). The vulns-vids.csv file contained a mapping of vid identification numbers to vulnerabilities. This file also contained, among other things, the vulnerability name, the CVSS base scores, and CVSS temporal scores.
With these two files imported into the database, it should have been simple enough to cross-reference the two tables matching on vid. It turns out that it was simple, but it also revealed another problem with the data: inside the findings.csv file, it was possible to have more than one vid per IP address. This would have been acceptable if each vid was represented on a separate line of its own. But that would not have made for a very interesting case study. In fact, the vid column in the findings.csv could contain multiple vids separated by a semicolon. Although this did not present an error during the import, it did present a problem when running a query. The query would always match on the first entry in the string and ignore the rest.
Let’s take a look at another example that helps illustrates this new issue. We will start with two CSV files that contain the type of data I just described. Building from our previous CSV files, the first CSV file will be the test_findings.csv file, which contains the following information:
"1.1.1.1","windows","ISAPI Extension for Windows Media Service Buffer
Overflow","1234"
"2.2.2.2","windows","iisadmin Directory Present Vulnerability","4321"
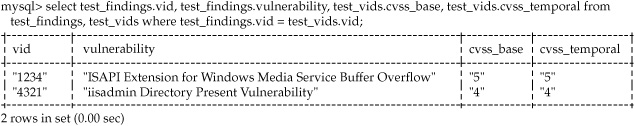
Figure 4. MySQL query matching vid field
The second CSV file will be the test_vids.csv and it contains the following information.
"1234","ISAPI Extension for Windows Media Service Buffer
Overflow","5","5"
"4321","iisadmin Directory Present Vulnerability","4 ","4"
A simple query in the database that matches up the vid field in both tables will work correctly and display two rows as is shown in Figure 4.
Now we will modify the test_findings.csv file such that multiple vids appear in the vid column separated by a semicolon:
"1.1.1.1","windows","ISAPI Extension for Windows Media Service Buffer
Overflow","1234;4321"
"2.2.2.2","windows","iisadmin Directory Present Vulnerability","4321"
In a perfect world, we would like to see a result with three rows, because now three total vulnerabilities appear across two hosts. Unfortunately, the query returns only one row, as can be seen in Figure 5. The match only occurs where the vids match exactly, which in this example occurs only on the second line.
Once again the example illustrates a real problem that we were having with the data in our SPA that we had to fix. Our solution was to write a script that parsed through each row of the CSV file and created a new line containing a duplicate of the data in the row and one of the vids. The script ran through each row until they all had only one vid. Applied to our example here, the results of the script are seen in our new test_findings.csv file:
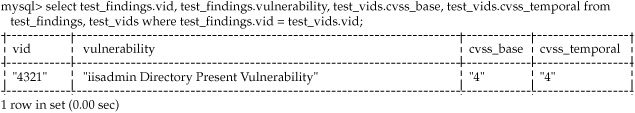
Figure 5. MySQL query matching vid field truncated
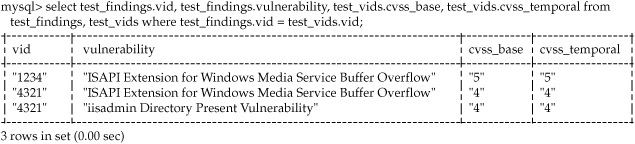
Figure 6. MySQL query matching vid field final
"1.1.1.1","windows","ISAPI Extension for Windows Media Service Buffer
Overflow","1234"
"1.1.1.1","windows","ISAPI Extension for Windows Media Service Buffer
Overflow","4321"
"2.2.2.2","windows","iisadmin Directory Present Vulnerability","4321"
With the data in the proper format, we can import it back into the database. This time when the query is run the results are in the expected three rows, as shown in Figure 6. We used this script in the SPA to overcome our data import problems in much the same way.
os.csv and role.csv Files A last piece of the equation for our SPA data efforts was to add a bit more data about the hosts. We wanted to be able to report on the primary function of the devices that were scanned as well as what type of operating system they were running. This information was split into two different CSV files: os.csv and role.csv. The issues with operating systems and roles were not as bad as the structural issues we encountered but they still required us to make some normalization decisions about how we would handle the data.
A few different methods can be used to obtain the operating system and role of a machine during a SPA. One of the easiest ways is to banner grab from an open TCP port. A quick example of this would be to connect to an open port on a machine and then make a judgment of the operating system based on the returned output.
For this example, I will simulate a web browser connection using the open source tool Netcat to connect to www.mhprofessional.com on port 80. Netcat is a feature-rich networking utility that is used to establish connections to network services.
sh-3.2$ nc www.mhprofessional.com 80
HEAD / HTTP/1.0
HTTP/1.1 301 Moved Permanently
Date: Thu, 17 Dec 2009 19:35:27 GMT
Server: Apache
Location: http://www.mhprofessional.com/
Connection: close
Content-Type: text/html; charset=iso-8859-1
Notice in this example that the server has declared itself as Apache, which is a type of web server that can run on many different operating systems:
Server: Apache
This field will also often contain the version number of the service that is running. Sometimes it is easy to identify the operating system (or at least the manufacturer) based on the banner. For instance if the Server field returned “Microsoft-IIS/5.0,” we could assume that the device was running a flavor of Microsoft Windows (as that is all that IIS will run on). It is also important to understand for this example that the Server field is a configurable parameter and may not be representative of the type of server that is actually running. It would be difficult to determine the primary role for this host with just the banner. A host may be running web services for many reasons. For instance, the web services could be for remote monitoring or could be embedded in another type of software for remote control purposes, as opposed to strictly serving web pages.
Another way to obtain operating system and role information from a system is to use OS fingerprinting, a technique that sends TCP and UDP packets to a host and then examines the return traffic for patterns. The TCP stacks on operating systems are not all built alike, and many of them have their own unique way of responding to packets that are sent to it. Tools that have fingerprinting capabilities match the response patterns to a backend database for OS identification.
The following example demonstrates OS fingerprinting of a host using Nmap:
sh-3.2$ sudo nmap -O 192.168.105.76
Interesting ports on 192.168.105.76:
Not shown: 964 closed ports, 31 filtered ports
PORT STATE SERVICE
22/tcp open ssh
88/tcp open kerberos-sec
3306/tcp open mysql
3689/tcp open rendezvous
5900/tcp open vnc
MAC Address: 00:26:BB:1D:E9:F3 (Unknown)
Device type: general purpose
Running: Apple Mac OS X 10.5.X
OS details: Apple Mac OS X 10.5 - 10.5.6 (Leopard)
Network Distance: 1 hop
Nmap done: 1 IP address (1 host up) scanned in 8.05 seconds
The results of this fingerprint show that the host is an Apple workstation running Mac OS 10.5.X:
Running: Apple Mac OS X 10.5.X
OS details: Apple Mac OS X 10.5 - 10.5.6 (Leopard)
What is unclear, though, is the role or function this device serves. This could be a database server, because it is running MySQL (TCP/3306) and also has SSH (TCP/22) running on it. It could also be just a workstation that happens to be running those services as well.
These examples show that there are multiple ways to get OS and role data for machines, using different tools and different types of data. In our SPA we had to decide how to normalize the data from any tool we used in order to produce standard OS and role information. Our toolset contains logic that determines the OS and role of a device from the data gathered, but the downside to the identification process is that there are many different possible results from the tool. As the SPA engineer reviews and confirms the results of the scans, they also enter information about the host, which hopefully should, but may not always conform to standard SPA notation.
Some of the results for the role and OS are very generic, while others may be very detailed and include such data as version numbers such as those displayed in the preceding example. Another good example of this is to consider how a UNIX device may be displayed in the role.csv file. While the device role would be “Server” and the role type would be “UNIX,” it could have detailed values such as “Linux,” “Redhat Linux 7.2 kernel-2.4.20-28.7,” “Solaris,” “9.3.1,” or even “None.”
To normalize the data in our SPA that went into identifying role and OS, and to overcome the challenge of multiple data sources in the previous examples we had to determine how much information we wanted to include about the operating system and role of identified systems in our SPA reporting. Ultimately, we decided that a more generic approach would suffice. We kept the role and OS data general, removing any detailed information about operating system versions or specific role functions from our data set. We only used data that was the same across any particular tool output. This ensured that we had normalized data, because the generic role and OS information from our tools was always populated and consistent. You can compare this strategy with our decision to include inconsistent data regarding the pseudo services I described previously. In that case we deliberately kept data in the set even if it was non-standard because we felt it was needed to understand the results. In the case of role and OS information only general data was necessary to understand the results.
I am happy to tell you that this was the last of the data issues that we encountered for this part of the SPA. We had gone through a difficult process of deciding what we needed and then trying to make the data meet those needs. As each new need was identified it seemed that we found structural problems in our data gathering tools and methods that made it difficult for us to use our data to meet the need. The biggest team takeaway from these activities was that our initial assumptions about the structure of our data were wrong. It seemed logical for us to assume that, because the process works flawlessly inside the current toolset for the SPA service, it would not be much of a leap to produce new data and statistics.
As a result of the difficulties in making our data work for this new type of SPA, I became interested to learn how the tool manages the individual flat files and the logic behind parsing the data. A large portion of the tool code was solely dedicated to normalizing the data to generate the specific output and format for SPA reports, which were always done a certain way. As new tools were and are incorporated into the toolset, the SPA developers add new sections of data manipulation code to compensate for the specific output structure. What this means is that every time the SPA team added a new tool, someone had to go through an exercise like I had done to figure out what data they needed and then create hacks and workarounds to make sure all the data worked properly. I suppose it was a little reassuring to find out that I was not alone in the data normalization game, but it also showed just how much time and effort had to go into making our data useful. The SPA engineers only had to make data work with a well-understood analysis and reporting format, so it was easier. When I had tried to create new metrics and reports that were different from the traditional SPA, normalization became a real nightmare.
A Final Objective
You might think that after all this effort I would have wanted to stop worrying about data altogether. But we had a final objective in the project that was completely new for the SPA: developing a way to let customers know how they ranked from a security standpoint compared to their peers. We needed a solid foundation of data from which to draw upon for the comparison. To begin with, we needed to determine how many years of past data we needed to collect for our baseline. For the data, we would use a general, sanitized archive of historical SPA information that included the types and quantities of vulnerabilities and where/how they were found (internal or Internet Perimeter).
We decided that five years of historical data would be sufficient for correlation. This sample size allowed us to have a large base that still contained data that was relevant in today’s environment.

NOTE Although it might be hard to believe, we still find vulnerabilities in many customer environments that are five years old. This is usually due to a failure of process, procedures, and governance at a much higher level—but, alas, that is a story for another day.
With the historical timeframe selected, we began to parse through the data in the archive and classify it into a few different categories including the following:
![]() Internal or Internet perimeter assessment
Internal or Internet perimeter assessment
![]() Size of the engagement
Size of the engagement
![]() Integrity of the data
Integrity of the data
Sorting through the data in this manner was a lengthy task, but it did not require any sort of data manipulation. However, other problems soon became apparent.
I already talked about how the SPA toolset has evolved over time and with these changes came changes to the format of the data. Many different types of vulnerabilities in the past were perhaps classified one way (from a severity point of view) in older versions of our tools, but would be classified much differently in more recent versions of the toolset, because of the age of the vulnerability and newer ways to mitigate the threats. Fortunately, the categories of the vulnerabilities have remained consistent over time. The categories include information such as the type of vulnerability (for example, buffer overflow, cross-site scripting, default accounts), and the operating system on which it was found and exploited.
In the current version of the toolset, many types of files contain information about assessed hosts that did not exist a few years back. In some cases, the file structures were the same but new columns had been added to include these new types of information. The next challenge of our data analysis was to determine which values to use from the data sets and whether they had been consistent through the years or would require normalization. Some of the values that we chose to use for a historical baseline and statistical analysis were the following:
![]() Operating system
Operating system
![]() Vulnerabilities
Vulnerabilities
![]() Role
Role
![]() Vulnerability severity
Vulnerability severity
These values covered technical details, but did not give information that let us compare different types of organizations. The next thing to sort out was how to classify organizations so that we could compare vulnerabilities within the same industry. This type of information was not being gathered by the toolset, which meant that we would have to determine the different parameters we needed to compare and then determine where to obtain the information we needed. We wanted to be able to answer the question, “How do I compare to my peers?” that is often asked by our clients. It was important that we gathered enough data about the organization to create a useful classification system. We believed that the following categories would provide the correct amount of data for classification:
![]() Company Vertical
Company Vertical
![]() Total Annual Revenue
Total Annual Revenue
![]() Geographical Locations
Geographical Locations
![]() Total Number of Employees
Total Number of Employees
The next step was to create the classification system. In other words, we needed to populate each one of the categories with metadata. Consider Company Vertical for example. Examples of metadata in this category include
![]() Health Care
Health Care
![]() Retail
Retail
![]() Service Provider
Service Provider
![]() Manufacturing
Manufacturing
![]() Education
Education
Total Annual Revenue and Total Number of Employees would need to have ranges associated with them. Examples of these ranges include
![]() 1–100
1–100
![]() 100–5000
100–5000
![]() 5000–10,000
5000–10,000
![]() 10,000–20,000
10,000–20,000
And Geographical Locations could have metadata including:
![]() Country
Country
![]() State
State
![]() Region
Region
The last step in creating the new classification system was to group together each of the categories and their metadata and provide a unique identifier, in this case an alphanumeric ID system. For example, a healthcare company with 50,000 employees in the United States that does $8.4 million in sales was classified as HC5USM. A retail company with 133,000 employees, a global presence, and $19 million in sales would be classified as RT9GLM. The IDs themselves were just our notation and are not important except to show that they allowed us to classify each company in a way that we could use for comparison. The classification matrix then needed to be stored in a new table of the database that we previously created for the new SPA.
Finally, we needed to assign these same classifications to all of the historical data in the archive. This part required some time, as each SPA in the historical archive would have to be looked up so that we could gather the appropriate information for classification. This was a long and tedious process but was ultimately worth the time. We were able to provide our customer with the additional analysis and trending information that they needed. We then added code to the SPA toolset that automatically gathered this type of information at the beginning of an assessment and added it to the data files.
Summary
Companies today are faced with an increasing amount of data that comes from a variety of sources, including security tools or devices, and each may have a different standard for output format. This case study describes in detail the process that we undertook to solve a particular data challenge. Many different types of obstacles needed to be overcome as they related to the data with which we had to work.
When embarking on a project such as this, your most important thing to remember is that patience is the key to success. Start with well-defined goals and realize that along the way, you may have to make decisions about whether or not the data will support those goals. Many factors need to be considered, and you will have to become very familiar with the type and format of the data that you are looking to normalize.
Many important questions regarding the data will need to be answered. Here are examples of some of these questions:
![]() What format do I need my data in for analysis?
What format do I need my data in for analysis?
![]() From how many different sources do I need to pull data?
From how many different sources do I need to pull data?
![]() Do the fields in the data sources contain unexpected characters?
Do the fields in the data sources contain unexpected characters?
![]() Do all of the data sources contain the appropriate variables?
Do all of the data sources contain the appropriate variables?
![]() Will the manipulations that are needed compromise the integrity of the data?
Will the manipulations that are needed compromise the integrity of the data?
Hopefully, you now understand that normalizing data is not rocket science, but it requires a keen eye and plenty of patience.