
CHAPTER 9
Measuring Security Cost and Value
One of the most promising aspects of using more sophisticated IT security metrics is the possibility of developing more sophisticated assessments of how much security costs and how much value security activities bring to an organization. At the end of the day, if a CISO cannot articulate what security means in tangible terms (such as money), his value will be limited in the eyes of other business leaders who think in these terms.
This does not mean that all security metrics should have a monetary goal, any more than all metrics should have a quantitative result. But techniques that can measure these values become important components of the security metrics toolbox. Measuring cost and value is an activity that remains tightly coupled with measuring risk, as fluctuations in cost and value can negatively impact everything from the company bottom line to the ability of the security team to resource their operations adequately.
Understanding how much security actually costs an enterprise is the first step toward understanding how to reduce those costs and what that money is actually buying. How to show the value of security is one of the most common questions I am asked by clients engaging in security work, but often security value remains tied to the concept of preventing attacks and losses. Other cost and value metrics, such as total cost of ownership and return on investment in security technologies, often are left to vendors and analysts and do not enter into the everyday analyses of the security team.
Sample Measurement Projects for Compliance and Conformance
This chapter will explain, using simple examples, several interesting methods for measuring cost and value that are used widely in other industries and could benefit IT security programs. These methods are not the only such measurement and modeling techniques available, but they do illustrate some metrics practices that you may not have considered. I will describe three methods for measuring the cost and value of security:
![]() The Poisson distribution
The Poisson distribution
![]() Monte Carlo simulation
Monte Carlo simulation
![]() Security process cost analysis
Security process cost analysis
Measuring the Likelihood of Reported Personally Identifiable Information (PII) Disclosures
The first security measurement project I describe uses a technique known as the Poisson distribution, which was developed by Siméon Poisson, a nineteenth-century French mathematician. The Poisson distribution provides insight into how many events occur within a given time period, region of space, or particular process or product. One characteristic of the Poisson distribution is that the events under consideration are rare, and that they are assumed to be random and to occur independently of one another.
History and Applications of the Poisson Distribution
The most famous application of the Poisson distribution, which is often used to explain it, is an 1898 study of fatal horse kicks in the Prussian cavalry. A goal of the study was to determine whether these deaths were randomly occurring. The data used in the study tracked the number of cavalry soldiers kicked to death by horses every year during a 20-year period, which was found to follow a Poisson distribution. The distribution applies to more than just horse kicks, and allows us to quantify the probability that an event will occur based on previous occurrences.
Modern applications of Poisson include understanding how many people or vehicles will arrive at a given location in a certain time period, or the number of defective rivets in an airplane fuselage. By incorporating existing data regarding occurrences or events, the Poisson distribution can be used to predict the probability of future events of the same type. The distribution has been used for everything from optimizing schedules based on likely customer traffic, to designing more efficient parking lots, to identifying how many injuries are likely during sporting activities. The Poisson distribution’s emphasis on the occurrence of random, rare events makes it quite applicable to measuring certain problems in IT security.
Using the Poisson Distribution to Predict Reported PII Disclosures
In this example, the company that conducted the measurement project, for regulatory purposes, tracked all reported disclosures of personally identifiable information (PII) by the enterprise from any source. PII breach disclosure was a company-wide endeavor, with stakeholders coming together from Finance, Legal, IT, and the business units involved to form a quick response team to investigate the breach, track causes, and send appropriate notifications to affected individuals. An analyst from the security group represented the CISO on the quick response team, and this individual was chosen on an ad hoc basis depending on who was available at the time. The company had collected data on these reported breaches since the beginning of 2006 on a quarterly basis, as shown in Table 9-1. Based on historical data, the security team determined that the average resource cost for participating in the tiger team was 40 full-time equivalent (FTE) hours per reported incident and included meetings, investigations, and reporting requirements.
Given the increasing regulatory scrutiny of PII disclosure and breach notification at the state and federal levels, the board had grown concerned about delays in the breach notification process. The CISO decided after a senior management offsite that she wanted to assign a dedicated analyst to PII disclosure efforts to ensure that the security group was not the cause of any delays by a breach quick response team, and she requested input from her staff. About half the CISO’s team recommended that she assign a full-time resource to PII disclosure response team duties. The logic behind the recommendation was that as many as 14 breaches had occurred in a quarter, which resulted in an average of 560 hours of effort representing the response teams—more than justifying a full-time resource. A significant minority of the staff recommended a 50 percent assignment to a single analyst, basing their recommendation on the average number of breaches per quarter (7.75). The logic of this recommendation was very few breaches occurred during a quarter and a full-time resource would be underutilized.
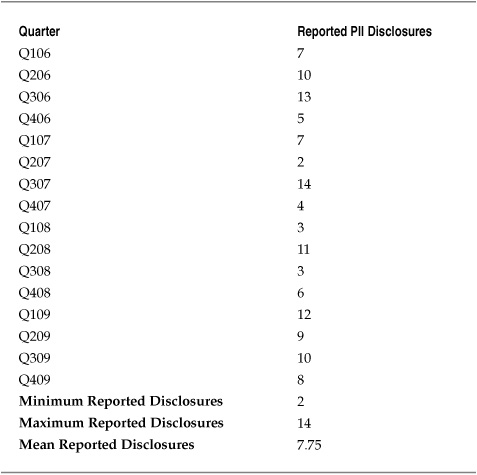
Table 9-1. Example Data on Reported PII Disclosures by Quarter
The CISO wanted to make sure that she was appropriately addressing an issue with board-level visibility, but she did not want to waste her people’s time unnecessarily. One member of the CISO staff suggested setting up a security measurement project to determine the probability that the company would experience 14 reported disclosures in a single quarter and to identify the likely number of reported disclosures against which the CISO should budget the team’s time. The GQM Template for this measurement project is shown in Table 9-2.
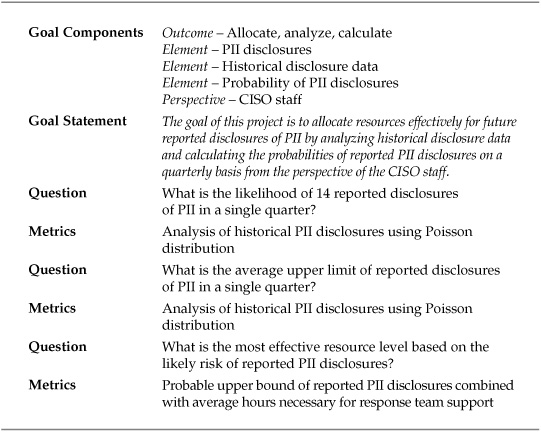
Table 9-2. GQM Template for PII Disclosure Measurement Project
A formula can be used for calculating the probability of a certain number of events occurring, using the Poisson distribution:
P(x; µ)=(e–µ) (µx) / x!
where
![]() P(x; µ) is the probability that x events occur if the mean number of events in the sample is µ
P(x; µ) is the probability that x events occur if the mean number of events in the sample is µ
![]() e ≈ 2.7183 (the base of the natural logarithm)
e ≈ 2.7183 (the base of the natural logarithm)
So to answer one of the project questions, the probability that 14 reported PII disclosures will occur in a single quarter, the project team could have used the formula:
P(14; 7.75) = (2.7183-7.75) (7.7514) / 14! = 0.01393 = 1.39 percent
The calculation shows that the probability of getting 14 reported PII disclosures in a quarter, when the mean number of reported disclosures per quarter is 7.75, is pretty low. I like the Poisson formula because it is not that difficult to understand, as intimidating as it may look at first. But being a security professional and not a mathematician by trade, I don’t like doing calculations by hand. And besides, the formula did not intuitively help the project team answer its second question about the likely high point of reported disclosures. This is where software comes to the rescue.
Minitab software provides several tests for Poisson probabilities, including calculating the likelihood of getting a particular number of events such as those described. Minitab’s Poisson tests can also be used to construct confidence intervals and bounds for the true mean of the population being sampled.
Applied to this PII disclosure project, Minitab was used to calculate the likelihood of getting 14 reported PII disclosures within a single quarter (as was calculated manually) as well as to identify the average upper limit of disclosures. Looking at the second question first, Minitab was used to calculate the average upper limit (or “bound”) of the quarterly reported PII disclosures with 95 percent confidence.
Figure 9-1 shows the Minitab interface as a Poisson test is conducted. In the session window, Minitab has calculated the various descriptive statistics for the quarterly disclosures and computed the 95 percent upper bound at approximately nine disclosures per quarter. This figure may be interpreted as meaning that the project team could say with 95 percent certainty that the true mean number of the disclosures was no more than nine per quarter.
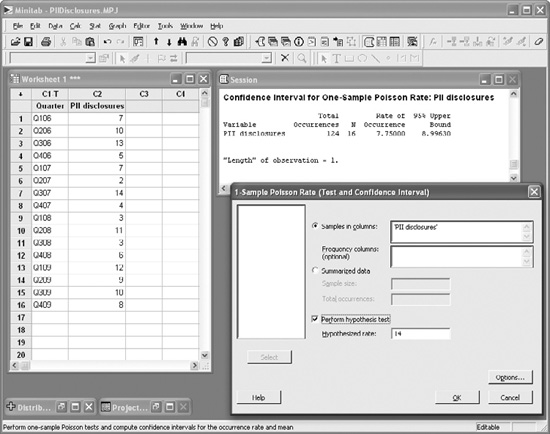
Figure 9-1. Minitab Poisson results for 95 percent upper bound of mean PII disclosures
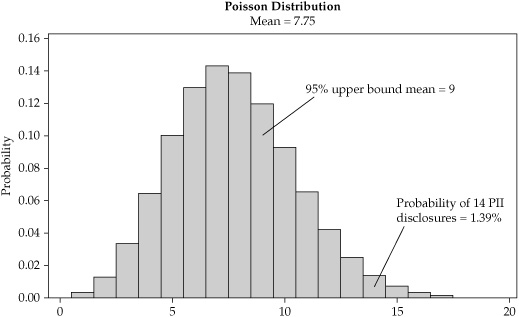
Figure 9-2. Poisson distribution histogram for reported PII disclosures per quarter
Going back to the first question of the probability of getting 14 reported PII disclosures in a given quarter, Minitab can also provide this information and can even construct a histogram to display the probabilities for all the possible values, as shown in Figure 9-2. A review of the chart shows the 1.39 percent probability for getting 14 reported PII disclosures during the quarter, and that the highest probability for quarterly disclosures is 7 (14.4 percent likelihood). Other interesting insights available from this chart for the purposes of the CISO’s staffing decisions include the following:
![]() The likelihood of getting 14 or more reported disclosures in a quarter was less than 3 percent.
The likelihood of getting 14 or more reported disclosures in a quarter was less than 3 percent.
![]() The likelihood of getting less than 5 reported disclosures in a quarter was only about 10 percent.
The likelihood of getting less than 5 reported disclosures in a quarter was only about 10 percent.
Supporting Decision-Making with the PII Disclosure Project Results
Using the Poisson distribution to calculate the likely number of reported disclosures allowed the CISO to reduce the level of uncertainty she faced in terms of how to staff the quick response teams. Given the 95 percent upper bound of nine reported disclosures per quarter, the CISO decided to dedicate 0.75 FTE analysts to PII disclosure projects and thus be reasonably sure that she was adequately protecting the security group from becoming a bottleneck. The likelihood that this resource would be completely overwhelmed or completely underutilized in any given quarter was sufficiently low as to be an acceptable risk.
This example has been deliberately simplified somewhat, and other dynamics would be at work that need to be considered in a real-world measurement project. Similarly, since the Poisson distribution deals with probabilities rather than certainties and is subject to new data, as more quarters passed, the CISO would want to repeat the tests to ensure that her assumptions remained accurate. A change in the mean reported disclosures per quarter, for example, would change the distribution and the probabilities associated with it.
Measuring the Cost Benefits of Outsourcing a Security Incident Monitoring Process
The Poisson test allows us to calculate the probabilities for the occurrence of future discrete events based on our knowledge of past events. Many aspects of security cost and value are not as simple as measuring how often one thing occurs. Costs can be a factor of several uncertain variables coming together to make a complex set of parameters that are beyond the predictive capabilities of the Poisson distribution. Monte Carlo simulations allow us to model these complex uncertainties by repeating variations of specific scenarios thousands of times using random variable inputs.
History and Applications of Monte Carlo Simulations
Like the story of the Poisson test and the Prussian cavalry, Monte Carlo simulations gained fame through their military applications. The Manhattan Project, which developed the first atomic bomb, developed the Monte Carlo simulation technique to model the complex activities that occurred during nuclear reactions. The simulation involves heavy application of random chance, and the scientists who invented it named it after the city of Monte Carlo, which is famous for its casino. Monte Carlo simulations have a history that can be traced back before the Manhattan Project, but it was only after the invention of computers that the techniques involved for these simulations began to be studied in earnest. Since then, Monte Carlo simulations have been widely adopted across many fields as a tool for modeling uncertainty and risk.
Among the many applications of Monte Carlo simulations, they are used to make decisions regarding financial investments, to optimize production capacity for manufacturing, and to estimate product-related costs and risks. When applied to problems involving large measures of complexity and uncertainty, a Monte Carlo simulation does a good job of predicting outcomes for decision-making purposes, which makes it a good candidate for inclusion in a security metrics toolbox.
Using Monte Carlo Simulations to Evaluate Outsourcing Returns
This measurement project concerns a company that was considering outsourcing its security incident monitoring and response to a managed security services firm. The CISO knew his team spent quite a bit of time chasing down security incidents each month, a process that involved investigating the source and cause of the incident, undertaking necessary remediation work, and creating reports for senior management review and compliance requirements. For the 12 months before the project began, the security team had been tracking and collecting data regarding the resources required for security incident management and was now ready to consider a managed services vendor that would take over this function. Table 9-3 shows the collected historical data regarding IT security incidents at the company, which accompanying descriptive statistical analysis.
Using this data, the CISO wanted to understand how outsourcing his incident management process would affect his bottom line. The problem involved several “moving parts,” as all four aspects of incident management are variable. Although fewer incidents may occur in a month, they could all be severe and require more investigation and remediation. On the other hand, in some months, the security team felt as though they were dying by a thousand cuts, as many minor incidents distracted team members constantly, but no single incident required a great deal of effort. One way of estimating the monthly costs of the security incident management process would be to simply play the averages:
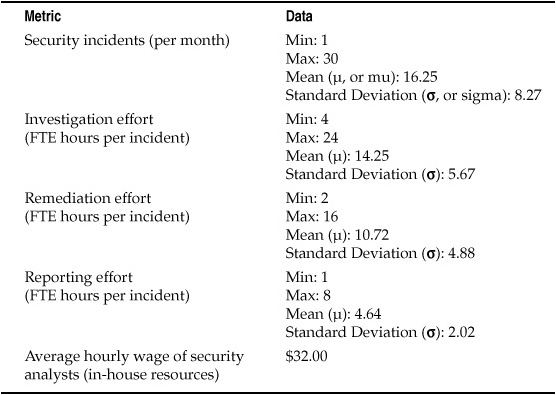
Table 9-3. Historical Data for Monthly Security Incident Resource Efforts
(Mean Investigation+Mean Remediation+Mean Reporting)xMean Incident Rate
or
(14.25 hours+10.72 hours+4.64 hours)x$32.00x16.25 incidents=$15,397.20
By this calculation, the average cost of the security incident management efforts of the team totals more than $184,000 annually. Senior security staff believed that outsourcing this particular function would free up resources and save the CISO (and by extension, the company) money. After evaluating several vendors, the team received a bid for an annual managed security services fee of $180,000 to take over incident management and response, including investigation, remediation, and reporting functions. The annual fee was slightly less than the estimated average cost of incidents overall and less than the average cost of two full-time analysts. The general sense among the staff was that the internal incident response process was unnecessarily tying up three or four analysts under the current status quo and that even in a breakeven outsourcing scenario, productivity would increase.
How could the CISO be sure that he was making a good investment? One area that concerned him is the fact that, overworked or not, his staff was motivated and did a good job of managing the incidents that arose. Bringing in the security management vendor was an unknown, and any savings or increases in productivity had to be weighed against the risk that the vendor would not take the same care with the company’s security posture as his own team or might not be as effective for other reasons. The CISO wanted to know that the likely cost savings would be significant enough that it justified taking these risks. To assess the likely cost savings, he set up a security management project to evaluate the current and future security incident data. The GQM template for this project is shown in Table 9-4.
Setting Up a Monte Carlo Simulation
Monte Carlo simulations use randomly generated numbers to create scenarios based on a particular set of parameters, such as the variable costs of the company’s incident management efforts. By randomly generating values for the investigation, remediation, and reporting of a number of security incidents during the course of a month, the simulation creates a scenario similar to the preceding estimation, in which all the averages were used to create an overall average cost for monthly incident management. But instead of averages, a Monte Carlo simulation chooses values from the entire range of probabilities for that parameter. This is possible because both the mean and the standard deviation are known. With the mean and the standard deviation, we can construct a normal distribution of probable values that will define both the ranges of values and the likelihood that any particular value will be observed as part of the scenario. Each scenario then models a particular probable outcome produced by a random combination of the variables involved.
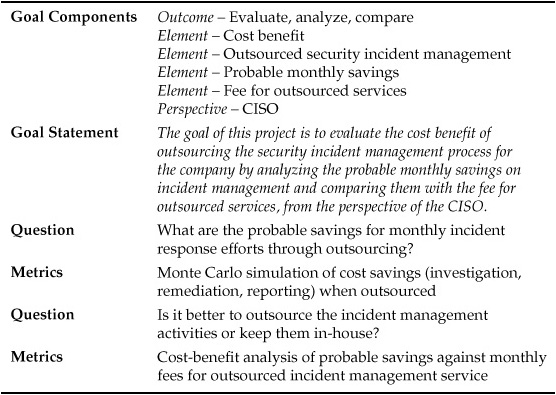
Table 9-4. GQM Template for Security Incident Management Monte Carlo Simulation Project
Before I completely slide down the statistical rabbit hole, let me stop and remind you that Monte Carlo simulations didn’t catch on until the invention of computers, and with good reason. Not even the nuclear physicists that built the first nuclear weapons could or wanted to do this stuff by hand. And neither do IT security pros. We need computers not only because constructing each scenario with random numbers is tedious, but because a Monte Carlo simulation does not include a single scenario. Conducting a Monte Carlo simulation involves creating thousands or tens of thousands of these scenarios and then building probability models based on the results. It is like flipping a coin or rolling a die 100 times to model how the results are distributed, but with many parameters included. As more and more scenarios are included, the overall model’s predictive capacity increases.
Monte Carlo simulations can be built using spreadsheets. Not all spreadsheets contain the functions necessary for these simulations, but Microsoft Excel and the open source spreadsheet Gnumeric both have features for building and running simulations. Many commercial tools are available for conducting Monte Carlo simulations as part of more sophisticated risk analyses, but most of these are quite expensive and many are add-ins for Excel. If you are just beginning with Monte Carlo simulations, spreadsheets are the way to go; you can find many resources in print and online that can help you figure out how to construct them.
Let’s get back to the security measurement project. To run the simulation, an analyst on the project team created a spreadsheet-based Monte Carlo model that included all the parameters for scenario creation and produced a result for each scenario. In Excel, the formula NORMINV allowed the analyst to create a random result from a normal distribution based on the mean and standard deviation for each parameter. The assumption was that outsourcing would save the company the effort of managing security incidents; therefore, each parameter was constructed as a cost savings based on the number of hours spent investigating, remediating, or reporting the results of the incident, combined with the number of incidents in a given month. Table 9-5 illustrates the result for a single scenario.
After a spreadsheet row was constructed to produce the randomly generated scenario, the project analyst copied the row 9999 times to create a simulation with 10,000 randomly generated scenarios, as shown in Table 9-6.
The project team now had 10,000 cost-savings scenarios that were directly drawn from the statistical characteristics of the data collected during the previous year. In terms of likely incident management costs, the scenarios would reflect average months, extreme months, and every kind of month in between, over and over again as patterns in the data emerged. Looking at Table 9-6, you can see that savings scenarios vary widely and include both very low months (scenario 7, in which less than $500 is saved) and very high months (scenario 2, with more than $28,000 saved).
Using the mass of randomly generated scenarios, the project team could analyze the results of the simulation. Recall that the managed services quote was $180,000 per year, or $15,000 per month for outsourcing the company’s incident management and response processes. The company had to save $15,000 or more each month to break even on the outsourcing. The project analyst used the spreadsheet functions to calculate the probabilities that the company would save more or less than $15,000 per month, as well as to calculate the likelihood of specific savings, as shown in Table 9-7.
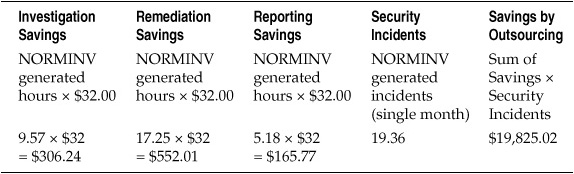
Table 9-5. Example Scenario for Outsourced Incident Management Savings
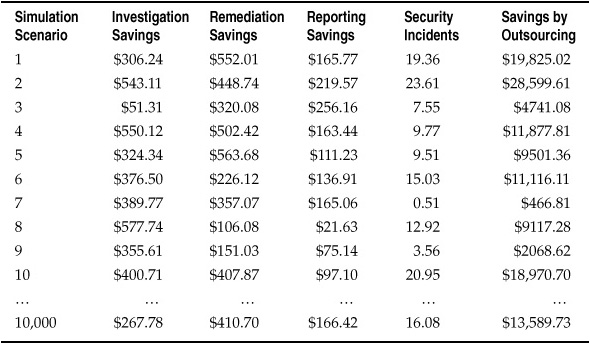
Table 9-6. 10,000 Random Scenarios for Outsourced Incident Management Savings
A more visual illustration was provided by constructing a histogram of the observed scenario breakdowns, shown in Figure 9-3. The chart shows all the statistically derived possibilities in the simulation model, with the number of observed scenarios for that savings range.
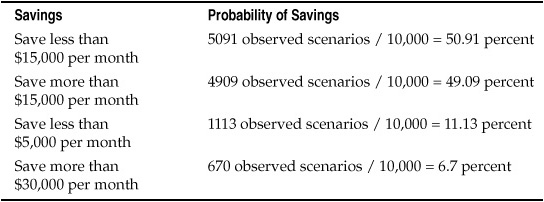
Table 9-7. Savings Probabilities Based on Observed Simulation Scenarios
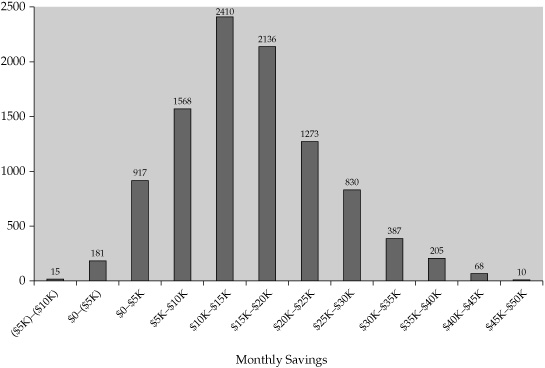
Figure 9-3. Histogram of observed savings scenarios
Supporting Decision-Making with the Outsourced Savings Simulation Project Results
The Monte Carlo simulations constructed during the security measurement project provided the CISO with interesting results to help him decide whether outsourcing his security incident management was a good investment or a good idea. The likelihood that the company would break even on the outsourcing contract was about 50/50. For every month that the company lost money on the contract, they would likely make money another month. But there was about a 58 percent chance that the company’s savings on the outsourcing contract would fall between $10,000 and $25,000 per month. The CISO could now better gauge the financial risk of the outsourcing contract, as well as balance his concerns about the quality of his own team’s work with the likely savings he would see if he hired the vendor to take over operations.
The CISO might have decided that the risk of significant losses some months were low enough that improved morale and productivity on the part of his staff was worth the downside. He might have decided to attempt to renegotiate the bid in order to give himself a bit more favorable odds on his break-even point. As with the PII Disclosure project, this simulation should be run regularly with new data being input into the model as it becomes available for continued accuracy. In the case of the managed service project, a good time to reconstruct the model would be prior to renewing or renegotiating the annual service fee.
Measuring the Cost of Security Processes
The last measurement project example of the chapter is concerned less with building cost probability models based on mathematical functions than with mapping cost on to existing activities to improve them. The techniques for accomplishing this are known by various names, including business process improvement, statistical process control, detailed process charting, and other similar terms. At its most basic, the technique involves creating flowcharts, visual representations of activities and processes that break down the process into component steps and allow the reader of the flowchart quickly to become familiar with each detailed component of the activities involved.
Flowcharts are everywhere in industry, including IT and IT security. I see many process flowcharts created by clients to map out the activities of the security group. But most IT security groups using process charting only scratch the surface of the security measurement opportunities that these charts and diagrams provide. I illustrated a generic process in Chapter 5. Figure 9-4 shows a slightly more specific process diagram with an oversimplified process for requesting and approving system changes.
I have found that security teams often diagram their processes, usually for the purposes of training or compliance with company documentation requirements. But the visual representation of business processes was only a part of the reason that these techniques were first developed. The more important benefit of business process mapping is to figure out ways that the process can be made more effective and cost-efficient.
History and Applications of Business Process Analysis
The main purpose for the creation of business process charts was to dissect, measure, and analyze human industrial activities scientifically to make factories more efficient. In Chapter 4, I briefly reviewed the history of scientific management, Taylorism, and business process reengineering. The theories and techniques for measuring industrial processes have developed and matured over the century-plus since they were first introduced, but the general principle is the same. You analyze a process by breaking down that process into as many detailed components as possible (or as is appropriate for the task at hand), assigning values to those detailed components (time, money, effort, and so on), and using that data to analyze problems, shortcomings, and ways that the improvement of individual components might improve the overall functioning of the process as a whole. Business process analysis has become a complex industry unto itself these days, but at its core it is about simple observation, visibility, and the analysis of data that are produced by those efforts.
Business process analysis found its widest application in manufacturing, beginning with the factories of the industrial revolution and moving forward to much more recent quality techniques such as Six Sigma, Total Quality Management, and ISO 9000. But as the techniques have been perceived as successful, business process analysis has been applied to everything from software development to service industries. My purpose here is not to explore these techniques in detail (as with other analytical techniques I discuss in this book, other resources are available if you want more details). Instead, I want to situate business process mapping in the context of IT security metrics and provide an introduction to how you might consider using them in your own measurement program.
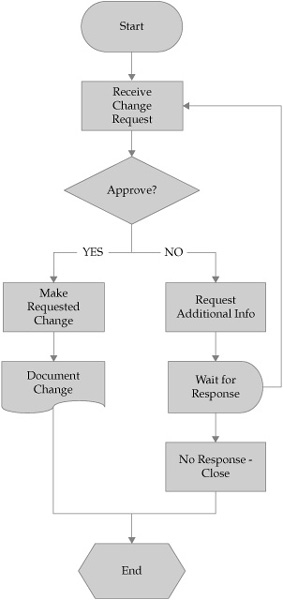
Figure 9-4. Simplified change request process diagram
Business Process Analysis of Patch Management Activities
This example security measurement project concerns a security organization that was attempting to streamline operations in the face of economic downturn. The IT organization as a whole was facing budget cuts, and the CIO had warned his senior staff that additional resources and new hires would be scarce until the economic situation improved. The director of IT security had experienced difficulty articulating the financial value of security operations within the company and knew that some other members of the senior staff had openly questioned the efficiency of his group. Without justification, however, the director could not hope to get needed resources to improve his operational effectiveness. He decided to get proactive. One of the areas of greatest complaint, including among the security team members, was the system patching process, with a rollout that consistently took days or weeks. The patching process was informally documented, and patching was a shared responsibility among several members of the security staff as an additional duty. As a pilot project, the director decided to try to improve the efficiency of system patching and set up a measurement project to accomplish this goal. The GQM template for the measurement project is shown in Table 9-8.
Mapping Process Activities and Assigning Values
Business process mapping involves several steps and data sources. The first step, as in the patching process measurement project, is to identify the process to be mapped and develop the objectives for mapping. In this case, the director was interested in improving efficiency, so this project examined costs and duration for the process, two metrics that can be used objectively to assess improvement over time. From there, several aspects of the process may be identified:
![]() Who owns the process?
Who owns the process?
![]() Who completes each process activity?
Who completes each process activity?
![]() What systems are involved with each activity?
What systems are involved with each activity?
![]() How much does each activity cost?
How much does each activity cost?
![]() How long does each activity take?
How long does each activity take?
Assigning values to these activities can involve a combination of interviewing techniques, actual observation of process activities, and gathering data from other sources to support the analysis. In many cases when flowcharts are constructed based on a process, the development of the chart is undertaken by a single individual (usually an owner or someone close to the process) and perhaps (but not always) submitted for review by other stakeholders. Formal business process mapping is a project-based activity that involves empirical data collection and formal analysis techniques.
The patch management project team gathered data regarding the patch management process by first identifying that there was no single owner for security patches. Instead, an informal team of five analysts and engineers shared part-time responsibility for identifying and obtaining necessary patches, testing the patches, and rolling them out to production systems. The team interviewed these individuals about the time they devoted to patch management, the tasks involved, and the results of the process. The team members also observed specific activities to understand better how the process flowed. Once they had collected this data, the project team created a process map that showed each activity, decision, delay, or the production or storage of documentation. At this point, the map looked like most of the process flowcharts that exist in IT shops.
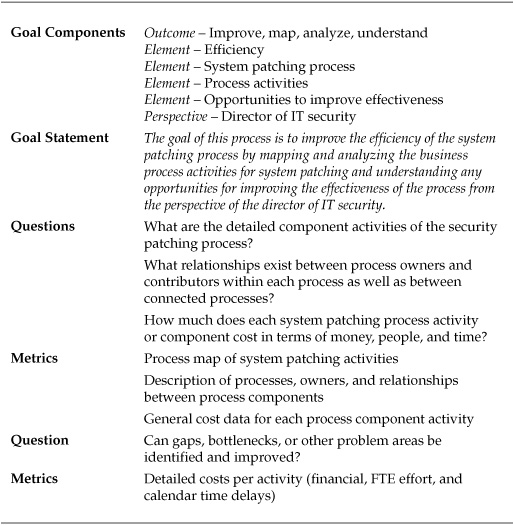
Table 9-8. GQM Template for Process Cost Analysis of Patching Process
A crucial step for the project team involved revisiting each of the process stakeholders interviewed during the map building, showing them the evolving process flows, and asking for input and corrections to the map. The goal was to ensure that all stakeholders accepted that the final map accurately represented the actual process flow. Too often, process mapping exercises involve outsiders interpreting a process from stakeholder inputs but never gaining consensus that the final interpretation actually looks like what those stakeholders thought they were describing. When conflicts arose during this project’s reviews, the project team discussed them with various stakeholders and escalated unresolved conflicts as necessary to define responsibilities appropriately and match the “official” way that the process was supposed to function.
The power of business process mapping was apparent when the project team began to assign values to the chart. Based on the interviews with the process stakeholders, the project team assigned basic resource commitments to each activity in the process chart. The project team also used existing data sources for the patch management process, such as system logs and time reporting systems, to determine how long each activity took and the calendar duration until an activity was completed. This data was then added to the process map to begin identifying how each activity in the process functioned from a resource and cost perspective.
Many tools are available for business process mapping. Flowcharts can be created in a variety of readily available software packages including Microsoft Office and Open-Office, as well as specialized drawing and diagramming products such as Microsoft Visio or SmartDraw on Windows machines and OmniGraffle on the Mac. These products allow you to create process maps that you can then annotate to include the results of other data collection efforts regarding costs and resources.
Another option for process mapping, which was used in this project, is a program from the makers of the Minitab statistical program. Quality Companion by Minitab® can be used to manage quality control projects and is designed primarily to support Six Sigma projects, for which Minitab is a widely adopted tool. But Quality Companion does not have to be used exclusively for Six Sigma and is widely customizable. For the purposes of the patch management measurement project, Quality Companion provides features for building process maps and embedding metrics data into the map itself, as well as for managing other aspects of the project.
Figure 9-5 shows the Quality Companion user interface, including customized fields used by the project team to enter specific cost and duration data for each process activity. Other products are specifically focused on the business process management market, and they provide similar mapping features as well as complex and sophisticated process modeling and management functions, but these tools are often enterprise suites that actually integrate with systems and process flows. If you are just starting out with mapping and analyzing your security business processes, you don’t need (and likely are not ready for) these larger solutions.
Using Quality Companion, the project team was able to map the specific activities of the project and assign data to each activity, including resources committed to the activity (based on interviews with the staff), the average duration of each activity in terms of FTE hours spent, and the calendar duration of each activity. The complete chart is shown in Figure 9-6.
This application of Quality Companion was fairly basic, but for the purposes of the director of IT security’s measurement pilot, it provided interesting insights into how the process functioned. This tool can also help you develop variables for process activities and integrate them with Minitab statistical software so that a metrics team can conduct exploratory, analytical, or experimental projects to help improve their operational activities. At this point, the director was content with the simple reduction of some of the uncertainties regarding the company’s patch-management process.
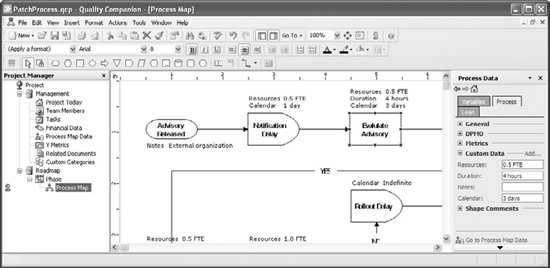
Figure 9-5. Quality Companion process mapping interface
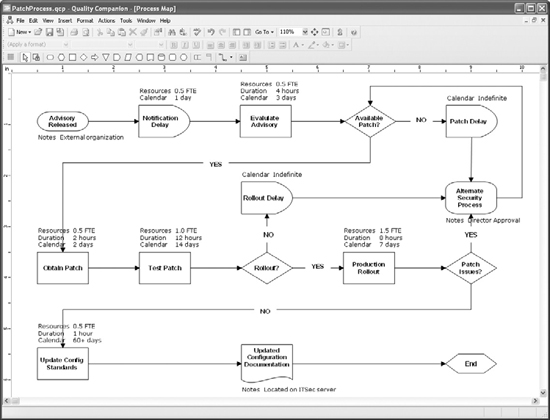
Figure 9-6. Quality Companion process chart for patch management process activities
Supporting Decision-Making with the Business Process Mapping Results
Beyond the immediate finding by the project team that the patch management process had no single owner, the data that emerged from the mapping exercise was instructive in helping the director understand why the process was inefficient. With duties split among several people, none of whom were assigned patching as a primary job responsibility, the coordination that took place among them was not enough to overcome the fact that patching was understaffed. The patching virtual team shared monitoring and evaluation duties, communicating primarily via e-mail. Security advisories were picked up pretty quickly, but evaluation of the advisories and their impact on the company could take days as the team researched and communicated back and forth. In some cases, no patch was available and alternative processes for ensuring security were kicked off until a patch was released.
Once a patch was obtained, it required testing before rollout, and at this stage of the process, the most significant delays were introduced. Patch testing required dedicated lab time and the virtual team members were often too busy with other activities or projects to begin the tests immediately. Altogether, the amount of time dedicated by the company to this task was one full-time equivalent employe across the five members of the virtual team. The resulting delays as the team members found time to test the patches in queue could result in delays of two weeks or more before a decision could be made on rolling out the patch to production systems. When a patch failed testing, this delay could increase even more as the team had to research alternatives and look for other mechanisms of securing affected systems. Once testing was complete, the delays diminished as the members of the team were able to work with system owners to implement the patches as part of their normal duties. Rollout was usually completed within a week, giving system owners sufficient time to identify any issues resulting from the patch.
One major discrepancy identified by the mapping exercise concerned the documentation of the patching efforts and the updating of appropriate configuration standards. This activity was required by the company’s security policy, but the project team found that in most cases the required updates to the standards were not completed within months of the rollout, and in some cases they had never been documented. This oversight could be attributed to the staff members involved in patching quickly moving back to their normal duties after patching was complete—every patching team member described feeling that patching was about getting the critical tasks “off the plate” and moving on quickly to other priorities.
Using the insights from the business process analysis pilot, the director began making more informed decisions about how to improve the process. He changed the job descriptions within the security team to assign one individual full-time patching responsibilities and put that person in charge of coordinating the virtual team. He also used the project data as a justification for more headcount, showing the CIO that the inefficiencies in the security processes were not the result of poor operations but of a lack of sufficient resources that was putting the company at risk of a major virus outbreak or an attack on vulnerable systems. Most certainly, the measurements conducted during this project led into subsequent measurement projects.
One follow-on project was to design an experiment around the assignment of the single point of responsibility for the patching process. After implementing the change, process data was be reevaluated periodically to determine whether reductions resulted in the calendar durations of any activities. Should such reductions be achieved, analysis could be conducted to determine whether those reductions were the result of the changes to the process or of random chance. This is another area where the features of Quality Companion and similar process analysis tools can be put to use.
The Importance of Data to Measuring Cost and Value
A central theme that runs through all three sample measurement projects in this chapter, and through the techniques used to accomplish them, is the need for the collection of appropriate data as an input into the measurement activities. Each of the techniques discussed involve more or less sophisticated ways of modeling the current and future state of certain aspects of security. The accuracy and reliability of your model improves as you incorporate more information into your assumptions, but you also must understand the basis of those assumptions before you can select the appropriate data. For these reasons, the security measurement project construct and the GQM basis for selecting and bounding the measurements you will analyze provide a good way of articulating and understanding the assumptions you are making and the data you will need.
Models often fail when we try to cram too much into them and lose sight of the fact that they simulate rather than reflect real conditions. I’ve made the case several times that understanding the limits of data and analysis is perhaps the most important (and most often neglected) aspect of measurement. If your assumptions are flawed, then so, too, will be your data, your model, and any decisions that you base upon it. And the hard truth is that all your assumptions will be flawed. The goal of measurement is to introduce no more error and uncertainty into your metrics analysis than you can understand and reasonably accept, and to recognize and make explicit those assumptions and flaws humbly and self-consciously when making decisions or presenting your results.
Summary
Measuring the costs and value associated with IT security can be daunting and requires a combination of appropriate data, creative analytical techniques, and defined objectives. This chapter explored three specific techniques that can be used to analyze the cost and value of security and to predict how cost and value might occur over time.
The Poisson distribution is a statistical construct that can be used to determine the probability of discrete events occurring based upon past rates of occurrence. It has been used to measure probabilities as diverse as the likelihood of getting a fatal kick from a horse to how many cars or customers will enter a place of business on a given day. From an IT security metrics perspective, the Poisson distribution can be used to calculate the probabilities that an event such as a reported disclosure of personally identifiable information will occur in a given time period based upon historical data. When combined with other information, such as financial impact of events, Poisson tests can help answer questions of risk analysis and risk-based allocation of resources.
Monte Carlo simulations are another statistical modeling technique that can be used in situations more complex than the Poisson distribution. They allow you to model the probabilities of events and outcomes that involve several variables. Monte Carlo simulations were developed to help physicists model the complexities of nuclear chain reactions and have since been applied to everything from project management to financial risk management scenarios. Applied to IT security, Monte Carlo simulations provide powerful tools for exploring the outcomes associated with security decisions such as evaluating the potential returns from outsourcing a security function such as incident management, as well as others.
Business process analysis is a modeling technique that takes well-known principles of flowcharting and process diagrams to a more sophisticated level, where they can be used to analyze the costs and constraints of individual process activities statistically and to identify areas for improvement and increased efficiency. Many security organizations use flowcharts for training and documentation purposes, but few have explored the possibilities for statistical process control and improvement using variations of those charts. Specialized tools and the association of data to process diagram components, such as in the case of analyzing a company’s patch management process, allow you to achieve greater visibility into security operations and to begin developing metrics data and measurement projects and experiments that can significantly improve your efficiency and effectiveness.
Further Reading
Hubbard, D. How to Measure Anything: Finding the Value of “Intangibles” in Business. Wiley, 2007.
Jacka, J. Mike, and P. Keller. Business Process Mapping: Improving Customer Satisfaction. Wiley, 2002.
Minitab, Inc. “Quality Companion 3 – Getting Started.” 2009. www.minitab.com/en-us/products/quality-companion/documentation.aspx
Winston, W. Excel 2007: Data Analysis and Business Modeling. Microsoft Press, 2007.