
CHAPTER
THIRTY-ONE
NONAGENCY RESIDENTIAL MORTGAGE-BACKED SECURITIES
Managing Director
BlackRock Solutions
ROBERT GOLDSTEIN
Managing Director
BlackRock Solutions
Nonagency RMBS refers to residential mortgage-backed securities that are not guaranteed by government-sponsored enterprises (GSEs) or government agencies. It includes securities backed by prime jumbo, alternative-A (Alt-A), pay-option adjustable-rate mortgages (Option ARMs), subprime, second lien, and manufactured housing (MH) mortgage loans. While the category encompasses a wide range of instruments, from high-quality vanilla loans to loans at the most creative but risky end of the spectrum, these mortgages are mostly nonconforming, either larger than the agency conforming limit or not conforming to the agency underwriting standard. Each nonagency RMBS deal contains hundreds to thousands of mortgage loans. Different from agency RMBS, nonagency RMBS have both prepayment and credit risks. The cash flows of a deal are structured into various pools or tranches so that various tranches bear different risks to suit different investors. Each tranche is an RMBS bond.
Before the financial crisis, prime jumbo, Alt-A, and option ARMs were often referred to as nonagency collateralized mortgage obligations (CMO) and subprime, second lien, and manufactured housing were often referred to as residential asset-backed securities (ABS).1 Nonagency CMOs used to be traded separately from subprime ABS because prepayment and interest rate risks were perceived as the dominant risks for nonagency CMOs, as opposed to credit risk for subprime, second lien, and MH. After the crises, these products are now considered as one general nonagency RMBS category as investors have realized the embedded credit risks and their significances across all of these products. This chapter refers to all these securities as nonagency RMBS.
The views here are the authors’ only and do not represent the views of BlackRock or BlackRock Solutions. The authors thank Mark Paltrowitz for both organizing this chapter and our many discussions on this topic. The authors thank Oliver Faltin-Traeger, Carolina Marquez, Sean Li, Ye Li, Julie Li, Sarah Rombom, Shirlee Tevet and Gauhar Turmuhambetva for their help in researching and editing this chapter. The authors also thank Akiva Dickstein, Jae Kim, Adam Levi, Randy Robertson, Biju Thuruthimattam, John Vibert, and Kishore Yalamanchili for helpful discussions on these materials.
During the housing boom, the demand for nonagency mortgages increased sharply. This was met by rapid increases in origination, innovation in creating mortgage products, and a flood of so called affordability mortgages. On the other hand, since nonagency RMBS provided slightly higher yields than agency RMBS with seemingly little additional risk, the demand for these securities was significant as investors chased yields. Furthermore, the development of ABS credit default swaps and collateralized debt obligations (CDOs) led to a surge of nonagency RMBS issuance beginning in 2005. Nonagency RMBS issuance reached its peak in 2006 with more than $1 trillion in new issuance and spreads at their tightest level. The subprime crisis and housing market meltdown substantially slowed down new issuance in 2007, and issuance ground to a halt in 2008 and 2009.
Despite the gradual price recovery since the middle of 2009, the nonagency RMBS market has remained in runoff mode. One small deal with new originations was issued in 2010, but failed to generate much traction given the new risk retention requirement, regulatory and policy uncertainties, a weak economic recovery, and general mistrust of mortgage instruments without government guarantees. Given the increasing origination volume in the prime jumbo market, we expect the securitization of prime RMBS to be reintroduced as a critical source of mortgage funding. The need for mortgages among borrowers with less-than-perfect credit may also lead to new Alt-A mortgage origination and the eventual re-emergence of the Alt-A securitization market. However, few in the industry believe that subprime or option ARM products will come back in the foreseeable future.
This chapter first provides an overview of the nonagency RMBS market, with a review of the rise, fall, and likely reincarnation of securitization. It then examines two core aspects of nonagency RMBS—collateral and capital structure. The housing market, the most important macro factor for nonagency RMBS, is also discussed. Of course any discussion of the nonagency RMBS market would be incomplete without touching on the importance of political, legal and regulatory issues as demonstrated most directly by loan modifications and the role played by the government in the housing market. Finally, it concludes with an introduction of relative value and risk analysis.
MARKET OVERVIEW
Here we provide an overview of the major RMBS product types, the industry structure, as well as the evolution of the market.
RMBS Product Types
Nonagency RMBS are primarily categorized by the dominant mortgage type in each deal. While it is easy to distinguish second lien, MH, and option ARM mortgages from other mortgage types, there is no clear definition for prime, Alt-A, and subprime mortgages. In general prime jumbo mortgages have higher FICO scores and loan sizes exceed the agency conforming limit at origination. The distinguishing characteristic for subprime mortgages is a low FICO score, typically below 660 with an average of 620. Characteristics of Alt-A loans fall in between those of prime jumbo and subprime. Alt-A loans may have either conforming or nonconforming loan sizes and good FICO scores. The distinguishing characteristic is that most Alt-A borrowers chose or were only able to produce limited or no documentation (i.e., income and asset verification evidence) at the time of origination.
Deal type is often identifiable from a deal’s prospectus. A prospectus is an offering document that describes collateral characteristics and deal structure, and discloses the associated transaction parties (e.g., underwriters, trustees, servicers) and investment risks. Because issuers typically use different entity or “shelf” names for different product types, the shelf is often used to classify the deal type. For example, Countrywide used “Countrywide Home Loan Mortgage Pass-Through Trust” (CWHL) for its prime deals, “Countrywide Alternative Loan Trust” (CWALT) for its Alt-A and option ARM deals, and “Countrywide Asset-Backed Certificates” (CWL) for its subprime deals. Option ARM deals are sometimes classified as Alt-A because they were typically issued through the Alt-A shelves.
Very often a deal will contain a mix of collateral types. For example, a prime deal may contain a small amount of low-doc loans, a regular Alt-A deal may contain a small amount of option ARM loans, or a subprime deal may have a certain amount of second lien or MH loans. In the prime jumbo and Alt-A sectors, a deal or a bond typically contains either 100% fixed-rate mortgages or 100% hybrid (fixed for several years then floating) mortgages. In the subprime sector, however, a deal or a bond typically has a mixture of fixed and hybrid mortgages.
Industry Structure
The process of nonagency securitization involves several institutions ranging from originators to warehouse lenders to issuers to rating agencies to servicers, trustees, etc. Originators underwrite and originate mortgage loans to borrowers. Major originators include banks, mortgage companies, correspondents, and brokers. Warehouse lenders provide short-term financing to originators allowing a critical mass of loans to be accumulated for a deal. Issuers package the loans and structure them into various tranches, work with rating agencies to obtain credit ratings, and sell the tranches in the capital markets as RMBS. Major issuers include banks, mortgage companies, real estate investment trusts (REITs), investment banks, and the like. Rating agencies analyze the collateral loss and deal structure and assign credit ratings to each tranche. They also conduct surveillance of existing bonds to determine if they are eligible for rating upgrades or downgrades. The major rating agencies are Moody’s, S&P, and Fitch. Trustees administer the deals including releasing remittance reports that detail the performance of the collateral and the bonds and distributing the cash flows to investors.
Mortgage servicers play a critical role in the nonagency RMBS life cycle. They collect payments from borrowers and pass them on to trustees. Depending on the type of deal and the terms of the prospectus, the servicer will generally be responsible for advancing principal and interest payments for delinquent borrowers, provided the servicer believes that the advanced amounts are recoverable. Servicers are also responsible for collection, foreclosure, real estate-owned (REO), and liquidation efforts. Recently, servicers have also become responsible for conducting loan modifications.
During the nonagency securitization boom, several industry participants built vertically integrated securitization businesses named conduits. These businesses acquired loans, either funding them directly through brokers or through a flow program with various correspondents for ultimate securitization exit. They also typically retained the servicing rights to the purchased loans, either performing the servicing themselves or subcontracting to third-party servicers. The “traditional” conduits include names such as Wells Fargo, Countrywide, and ResCap (formerly GMAC-RFC), although, as noted earlier, conduits may also be active in retail originations. From 2004 to 2006, Wall Street dealer shelves such as BSABS/BALTA (Bear Stearns), HEAT (CSFB), and SASC (Lehman) were very active in this segment.
Evolution of Nonagency RMBS Market
Nonagency securitization started in the 1980s. During the early stages of the RMBS market’s development, there was an essentially binary division in the secondary mortgage market between agency pools/deals and nonagency deals. Loans that were not agency-eligible were either retained as whole loans or put into a “nonagency deal.” The gradations in credit quality and underwriting that later characterized the nonagency sector were, at that point, mostly absent. As a consequence, nonagency deals issued in the 1980s and early 1990s frequently contained a wide variety of collateral types.
In the early 1990s nonagency RMBS began to employ more systematic underwriting standards that were similar to those of the GSEs, which resulted in more homogenous credit quality among prime jumbo deals. Credit (FICO) scores began to be used in mortgage lending providing a consistent industry-wide measurement of credit risk levels. This helped instigate the shift from generic “nonagency deals” to “prime jumbo,” “Alt-A,” and “subprime” deals. Prime jumbo was the dominant sector while Alt-A was the smallest.
As the housing market started booming in the early 2000s, U.S. mortgage lending began to move away from its traditional roots in 30-year fixed-rate product. Various alternative affordability products emerged and expanded rapidly. Hybrid adjustable-rate mortgages (ARMs) captured a larger slice of the origination market, as did hybrid nonamortizing (i.e., interest-only) and negatively amortizing products. Before 2003, nonagency RMBS accounted for about 20% of the total U.S. RMBS new issuance market. Beginning in 2004, the nonagency market captured an increasing portion of market share from the agency sector, still dominated by prime jumbo. By 2005, securitized nonagency RMBS origination surpassed the agency origination and reached $1.2 trillion, with subprime as the largest nonagency sector followed by Alt-A.
Nonagency securitization was further fueled by the adoption of the pay-as-you-go (PAUG) structure in ABS credit default swaps (CDS) and the rapid expansion of the ABS CDO market. Traditional corporate CDS combines a credit event (typically a bankruptcy) and a physical settlement. However, Subprime ABS deals usually lack a hard or clear-cut credit event. Both principal write down (loss on principal) and interest payment shortfall (loss on interest) are incremental and reversible. In addition, credit protection used to exist through the cushion of mezzanine tranches, which was typically 5% to 10% of a deal’s total capital structure or about several million dollars in size. The small size of ABS credit tranches made it very difficult for a protection buyer, other than someone who owned the tranche already, to find a reference obligation to deliver in order to make the physical settlement. These difficulties worked against the wide use of the corporate CDS template in the ABS market. In 2005 the industry adopted the pay-as-you-go structure for ABS CDS deals.2 Under this structure, if an ABS security encounters a principal loss or an interest shortfall, the protection seller pays the protection buyer the amount of the loss or shortfall. If the security later catches up on the payment, the protection buyer returns the payment to the protection seller. This template essentially made ABS CDS work just like a cash bond, which greatly increased the liquidity of ABS CDS.
The pay-as-you-go template facilitated two key developments that ultimately became critical triggers of the financial crisis: an ability to short the market and the creation of synthetic ABS CDOs. Shortly after the adoption of pay-as-you-go ABS CDS, ABX, an index for or a basket of subprime ABS CDS, was launched. Many market participants who had not historically been active in the U.S. mortgage markets turned to the ABX indices as a way to express their views on mortgage credit. ABX prices became the market barometer of nonagency RMBS and the dominant instrument for shorting the nonagency market. The creation of synthetic ABS allowed the ABS CDO machine to roar. Synthetic ABS, as opposed to cash bonds, refers to using ABS CDS contracts to create cash flows that are similar to owning the reference bond. Before 2005 the demand for CDO bonds was greater than the supply of cash assets. Synthetic ABS liberated CDO managers from the relative scarcity of cash bonds by allowing them to create tens of billions of synthetic or hybrid (mix of cash and synthetic bonds) instruments without actual mortgage origination, the most resource-intensive part of the securitization process. This greatly magnified the impact of nonagency mortgage defaults on the overall financial system.
The surge in nonagency mortgage demand directly led to the relaxation of mortgage underwriting criteria. Total combined loan-to-value ratios were increasing as borrowers were not always required to put down substantial equity in order to buy a house. Debt-to-income ratio, credit score, and documentation requirements were all loosened. Appraisal values were often inflated in order to qualify for a loan, underwriting due diligence was often compromised, and the share of affordability products (interest-only, negative amortization, etc.) increased sharply.
The consequence of loose underwriting soon became apparent as early pay defaults (EPDs, refer to delinquency within the first few payment periods) ramped up sharply in newly issued 2006 subprime deals. At the same time, the housing market started to weaken and home sales slowed. This accelerated the 2006 vintage delinquency rates as many borrowers did not have any equity buffer. As delinquency levels continued to rise rapidly beyond EPD in late 2006, it became clear that 2006 vintage was seriously challenged from credit perspective and market prices for associated bonds started to fall.
By early 2007 as the housing market showed no signs of a soft landing and both subprime and Alt-A delinquency rates accelerated monthly, the capital markets started to penalize all RMBS prices and many leveraged investors had to deleverage in order to meet margin calls. This triggered a vicious cycle:
decreased valuations → deleveraging → further valuation
decreases → more deleveraging
As a consequence, the demand for new issuance vanished and many originators either went out of business or ceased production. By the end of 2007, almost all nonagency originations had stopped. Nonagency securitization ground to a halt and RMBS spreads widened dramatically. Through the vicious cycle and thanks to the large exposures to ABS CDS and CDO, the credit problem in the nonagency RMBS market quickly transferred to turmoil in the entire credit market.
It is also worth noting the interplay of the capital markets turmoil and deterioration in fundamentals. The liquidity freeze in the capital markets led to a stop in nonagency mortgage origination, which in turn shut off refinancing channels for nonagency mortgage borrowers. Often prepayment and default “compete” because a borrower will look for opportunities to refinance into lower monthly payments or to sell the house before ultimately defaulting. The lack of prepayment opportunities led to a further increase in defaults. At the same time, the credit crunch and liquidity squeeze further froze the housing market and put more downward pressure on home sales and price movements. The deterioration in the housing market further fueled worsening of mortgage credit fundamentals.
A downward spiral unfolded as banks started to mark-to-market their balance sheet assets. The mounting nonagency mortgage related credit losses not only led to huge write downs to bank balance sheets, it also dramatically increased the capital reserve requirements for these large institutions, which further worsened market liquidity. Because many banks and large financial institutions were the major issuers and holders of RMBS, ABS CDS, and CDO assets, the mortgage credit meltdown eventually led to the downfall of large institutions including Bear Stearns, Washington Mutual, Lehman Brothers, AIG, Fannie Mae, and Freddie Mac.
Since late 2008, the nonagency sector has been in runoff mode with very little new issuance. Asset valuation hit a rock bottom in March 2009 and has since been in recovery. CDO liquidation and bank sales provided supply of existing bonds to the market. As of the end of 2010, there are $1.46 trillion nonagency RMBS outstanding, with about $432 billion of Alt-A, $395 billion of subprime, $318 billion of Prime, $158 billion of Option ARM, and $156 billion of second lien. 2006 and 2005 are the two largest vintages, followed by 2007 as a distant third.
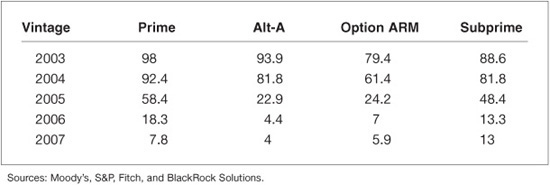
During the crisis, the vast majority of AAA bonds experienced rating downgrades, including 99% of Option ARM, 97% of Alt-A, 94% of subprime, and 85% of prime bonds. Many were downgraded from AAA to below investment grade. Only a small amount of outstanding nonagency RMBS remain above investment grade at the end of 2010. As shown in Exhibit 31–1, most 2005, 2006, and 2007 vintage bonds are below investment grade. While most seasoned bonds (2004 and earlier) remain investment grade, the number of bonds and remaining balances in these vintages are small.
EXHIBIT 31–1
Percentage of Investment Grade Bonds within each Vintage, Notional Balance Weighted, as of December 2010
Since early 2010, re-securitization has emerged as a meaningful mechanism to help absorb and repackage the universe of nonagency RMBS. Re-securitizations, also known as re-REMICs, place nonagency RMBS bonds into a trust that then issues a senior and a junior bond to investors. Recent re-REMICs were primarily created using bonds that were AAA at issuance. They have utilized a simple structure in which the senior bonds receive all of the principal cash flows until they are paid off while all of the losses are first absorbed by the junior bonds. The presence of junior bonds provides the senior bonds a greater credit enhancement than available on the underlying bonds individually; hence, the senior bonds can obtain AAA ratings to meet investor needs. One other benefit of these transactions is that they provide capital relief by allowing new AAA bonds to be created and retained while selling a smaller quantity of lower-rated bonds. Another attempt to revive the nonagency market is the introduction of PrimeX indices in April 2010. PrimeX allow investors to synthetically gain exposure to a basket of prime jumbo RMBS deals via CDS. Since inception, they have been traded fairly actively and have facilitated the trading of existing prime bonds.3
The basic elements of securitization—aggregation and subdivision of mortgage pools—has been an important housing finance channel. In spite of the considerable stress in securitization in 2007–2010, we expect nonagency RMBS will undergo structural and regulatory reforms and return to a more stable level.
COLLATERAL
Collateral analysis is a key component of relative value analysis for nonagency RMBS. Here we provide an overall review of the major characteristics of nonagency mortgages, their performance, and major issues in analyzing the collateral for nonagency RMBS deals.
Collateral Characteristics
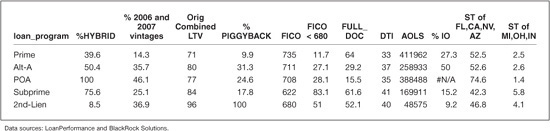
Different products, vintages, and deals each have different characteristics. These characteristics, together with the macroeconomic environment, drive different prepayment and credit performance. Exhibit 31–2 provides the average characteristics of prime, Alt-A, option ARM, subprime, and second lien collateral.
EXHIBIT 31–2
The Average Characteristics by Mortgage Type
Fixed versus Hybrid
Hybrid borrowers are typically more leveraged than fixed-rate borrowers. In addition the rate reset can cause substantial payment shocks under an increasing rate environment. Therefore, hybrid loans tend to have worse credit performance. In terms of prepayments, hybrids are also very different from fixed-rate mortgages. Before the crisis, hybrid mortgages prepaid faster than fixed-rate products. Now, with the higher perceived credit risks, hybrid prepayments are substantially slower than fixed prepayments. While hybrids are 40% of prime collateral, they represent 75% of subprime collateral. Unlike prime or Alt-A hybrids, subprime hybrids are dominated by short-reset products such as 2/28 and 3/27. While most prime or Alt-A hybrids reset every 12 months and the rate can go either up or down and is subject to caps and floors, most subprime hybrids reset every 6 months and the rate can only reset up.
Vintage
Vintage refers to the origination year. Because lenders’ underwriting standards change over time, loans originated in different years tend to have different credit quality. Differences persist across measurable characteristics and, more importantly, in characteristics that are not observable to investors, such as appraisal quality, underwriting exceptions, real occupancy, possibility of fraud, etc. Within this decade, 2002 and 2003 vintages are considered the best while 2006 and 2007 vintages are generally thought of as the worst. Besides being subject to looser underwriting standards, 2006 and 2007 vintages also suffered the greatest home price depreciation since they were originated at the peak of the housing market.
Loan-to-Value Ratio
The loan-to-value ratio (LTV) is the most important factor for mortgage credit performance. There are several LTV measurements. Original LTV is the loan amount to house value ratio at origination. Original combined LTV includes second liens at origination in the loan amount. Current LTV refers to the current loan amount to current house value ratio and current combined LTV measures the current total loan amount including second liens to the current house value. A high original combined LTV not only represents high leverage, but often indicates that the home price was aggressive for the borrower given income. Current combined LTV measures how little equity the borrower currently has in the house. When the LTV is higher than 100%, the borrower has “negative equity.” Their mortgages are higher than the value of the underlying home.
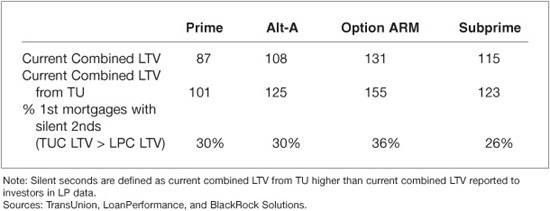
If the original LTV is greater than 80%, lenders typically require borrowers to buy mortgage insurance. Borrowers often avoided buying insurance with an 80% LTV on the first loan while simultaneously getting a second loan. This is referred to as a “piggyback.” As shown in Exhibit 31–3, there are a substantially large amount of piggybacks in Alt-A, option ARM and subprime loans as of year-end 2010. Mortgage brokers would often work with borrowers to obtain both loans simultaneously from the same lender.
EXHIBIT 31–3
Current Combined LTV and Presence of Silent Seconds as of December 31, 2010
High combined LTVs lead to high delinquency and default rates. When a borrower has negative equity, the default option is in-the-money and the so-called rational default rate increases substantially. High LTVs cause high loss severities when a loan defaults. In addition, high LTV loans also prepay slower because it is difficult for the borrower to obtain a new loan.
Another problem was “silent seconds,” or second or third liens that were originated after the first lien. During the housing boom from 2004 to 2007, many borrowers took equity out of their houses by borrowing through a home equity loan (HEL) or home equity line of credit (HELOC) outside of the existing first or second lien. This substantially increases leverage and default risk, but neither the first lien holders nor the servicers would necessarily be aware of these loans (hence the name “silent”). Only recently has data on “silent seconds” been made available through credit bureau reports. Exhibit 31–3 shows how severe the problem is—36% of option ARMs, 30% of prime and Alt-A loans, and 26% of subprime loans have at least one silent second in addition the first lien and the simultaneous piggyback.
Credit Score
The mortgage industry started using credit scores in the late 1990s. The most commonly used credit score is the FICO score, which is generated by independent credit bureaus for each individual using empirical models created by Fair Isaac Corporation (FICO). Scores range from 350 to 900 with a higher score indicating better credit quality. In mortgage origination, FICO is the most important variable to determine if a borrower is prime, subprime, or Alt-A. The average FICO is 735 for prime borrowers, but 620 for subprime borrowers. The percentage of low FICO borrowers is much higher in subprime deals.
FICO scores help predict credit and prepayment performance, even though the FICO reported in nonagency RMBS data is the FICO at origination. Borrowers with higher FICO scores tend to have better credit performance. Since many alternative products and loose underwriting standards existed during the housing boom, low FICO scores did not hurt a borrower’s ability to refinance. However, after the financial crises with subprime and Alt-A originations absent, FICO score became such a critical criteria to refinance that it is currently extremely challenging to obtain a new loan with a FICO score below 660.
Debt-to-Income Ratio and Documentation
The debt-to-income ratio (DTI) is a measure of a borrower’s ability to pay the loan. There are commonly two DTI ratios in mortgage underwriting, front-end and back-end. Front-end DTI is the ratio of the housing payment (including mortgage payment and escrow) to gross income, also known as housing ratio. Back-end DTI adds all other financial debt and child support to the numerator. As shown in Exhibit 31–2, prime originations typically require a low DTI, whereas subprime originations tolerated a higher DTI. As an ability to pay measurement, a high DTI indicates a high payment risk.
Lenders often require various documents as proof of a borrower’s income and assets. In general, full documentation involves verification of income (W-2, pay stubs, etc.) and assets (bank statements, brokerage statements, etc.). The definition of limited documentation, also known as “low doc,” varies greatly from lender to lender and includes stated income, stated assets, no income, and verified assets. A small number of loans were even originated with no documentation. Low documentation requirements used to be prevalent for special borrowers such as a small business owner who has difficulty obtaining regular income documentation. However, it became often used to qualify borrowers who overstate their income in order to qualify for a loan (“liar loans”).
A key feature of Alt-A and option ARM products is the large percentage of loans with limited or no documentation. Without having to fully document one’s income, many Alt-A borrowers grossly overstated their income levels in order to qualify for a loan. From 2005 to 2007, the documentation standards were substantially relaxed and even many full documentation loans can have considerably inflated incomes.
As a consequence of the various documentation standards, the historical relationship between credit performance and DTI is not clear.
Geography
Geography is another important aspect in analyzing nonagency mortgages. First, the local economy and local housing market can have a material impact on mortgage credit performance. For example, the rust belt states (Ohio, Michigan, and Indiana) have higher default rates because of the distressed local economy and job market. Secondly, differences in state laws and the judicial system can have very large impact on mortgage performance. When a loan is delinquent, the foreclosure process is governed by state law. Judicial states, for example Florida, require a foreclosure case to be presented in court and ruled by a judge, which results in a much longer liquidation timeline than that of non-judicial states such as California. In addition different states may have different requirements on legal documents in a foreclosure case. The impact of the recent foreclosure documentation issue, in which state courts found that many banks failed to submit proper documentation including record of title and deed transfers in some foreclosure cases, varies from state to state.
Negative Amortization and Recast
For option ARM loans, additional risks come from negative amortization and recast payment shock. Since option ARM borrowers have the right to pay a minimum payment, which is typically well below the interest payment, there can be an increase in principal balance, that is, negative amortization. Negative amortization increases the loan-to-value ratio further stretching a borrower’s ability to pay. When an option ARM reaches the earlier of its negative amortization limit or a predetermined time (typically the end of the fifth year), the loan will recast. When a loan recasts it starts to amortize down the outstanding balance at full index rate within the remaining term of the loan. The entire outstanding balance will be amortized (usually close at the original balance if not higher) over a shorter term, so the recast payment shock can be quite high, often 40% or higher.
Other
In addition to the above risk factors there are several other factors that affect mortgage performance. These factors include loan size, loan purpose (purchase, refinancing, or cash-out), occupancy (owner-occupied, second home, or investment property), amortization versus interest-only, property type (single house, planned urban development, condo, co-op, town house, and so on) and prepayment penalty (commonly in subprime and option ARM products and mainly impacts prepayments).
Risk Layering
Each of the individual factors described above can have a negative impact on mortgage performance. When layered together, risks increase exponentially. During the 2005 to 2006 peak of loose underwriting standards, many subprime and Alt-A lenders provided interest-only (IO) mortgages with no down payment. Other common layered risks include high LTV with low documentation and high LTV with high DTI. These loans are extremely sensitive to small declines in home prices because they quickly result in both negative equity and higher future payments.
Collateral Performance
Key measurements of collateral performance include delinquency, default, voluntary prepayment, and loss severity. Additionally, the roll rate or transition metrics provide important indicators for near term future performance. A roll rate is the rate at which previously current or delinquent loans are “rolling” into another status. A transition matrix is a combination of roll rates for each status.
There are two standards of measuring a borrower’s contractual delinquency status: the Mortgage Bankers Association (MBA) standard and the Office of Thrift Supervision (OTS) standard. The difference between the two has to do with the presence or absence of a grace period on the receipt of payment. In the MBA method, which is used in the prime market, there is no grace period. In the OTS method, which is used in the subprime market, there is a one day grace period on the receipt of the payment that effectively lowers the reported delinquency by one full month, as compared with the MBA method. Obviously the MBA standard is more stringent than the OTS standard. The reporting for Alt-A deals is mixed but most deals follow the MBA standard in trigger definitions.
There is no standard definition for default but a commonly used one is liquidation, that is, when a previous delinquent loan is liquidated through short sale, foreclosure sale or REO sale, the remaining balance of the loan is counted as default balance.4 A short sale is a sale of the underlying property in which the sale proceeds fall short of the remaining balance of the loan. It occurs when a servicer decides that selling the property short is better than going through a costly foreclosure process. Foreclosure is a process in which a mortgagee (or other lien holder) obtains a legal termination of the mortgagor’s (borrower) equitable right to redeem the property.5 There are two types of foreclosure sales. Judicial foreclosure, which is available in every state and required in many judicial states, involves the sale of the mortgaged property under the supervision of a court. Nonjudicial foreclosure is authorized by many states if a power of sales clause is included in the mortgage or if a deed of trust with such a clause was used instead of an actual mortgage. After a mortgage is foreclosed, the property becomes REO.
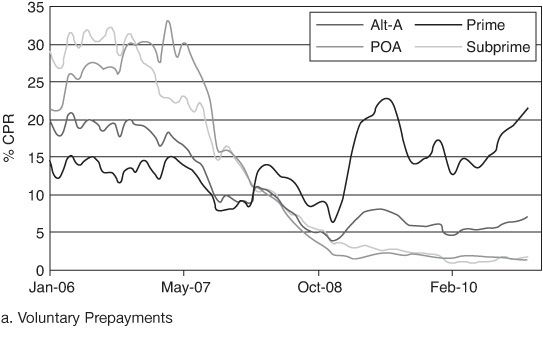
The four panels in Exhibit 31–4 show the historical performance across major products. Voluntary prepayment speeds have been declining substantially for all products. This is a consequence of increasing delinquency rates, higher current LTVs, and tightened underwriting standards. Subprime and option ARM prepayments are grounded around 0 as there is no new origination in these products. Subprime delinquency rose sharply from 2006 and peaked in 2009. Defaults peaked in 2010 and have been slowing down as loan modification requirements and foreclosure documentation issues substantially extended foreclosure time-frames. Loss severity increased greatly from the lows of 2006 and reached a plateau in 2009. Severities continue to remain at elevated levels.
EXHIBIT 31–4
Historical Performance across Major Products


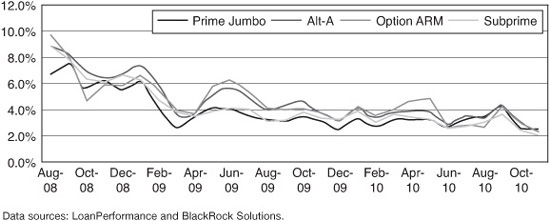
Credit Burnout
After delinquency reached its peak in 2009, subprime mortgage performance started to show signs of improvement. The stabilization can be partially attributed to credit burnout. There are two mechanisms for credit burnout. In a pool of loans, the loans with the worst credit quality will become delinquent and exit the pool leaving loans with better credit quality remaining in the pool. After flushing out the weakest borrowers from the pool through defaults, the performance of a pool of loans improves because the remaining loans are of better credit quality. Another mechanism is at the loan level. If a high LTV loan is underwater for a long period but the borrower continues to pay, the chance of the borrower becoming delinquent tends to decrease.
Credit burnout can be observed through declines in the first time delinquency rate. As shown in Exhibit 31–5, the new delinquency rate reached its peak at the end of 2008 and started to decline in 2009. The trend is quite clear for subprime, Alt-A, and option ARM collateral. Credit burnout was less pronounced in prime jumbo collateral as the elevated unemployment levels had a bigger impact on prime jumbo delinquency.
EXHIBIT 31–5
First Time Delinquency Rates since 2008
Servicing Concerns
Collateral performance varies greatly among servicers. While this is partly due to the collateral type and characteristics, differences in servicer behavior have attracted a lot of attention in the industry. Servicer variations are observed in many aspects of deal performance, including liquidation timelines, stop-advance rates, utilization of short sales, and loan modifications.
Some servicers are more aggressive and are more efficient in liquidating distressed properties and as a consequence, the liquidation timeline (time from a loan becoming delinquent to default to liquidation) is much shorter for these servicers. Investors prefer shorter timelines as the recovery can happen earlier and loss severity tends to be lower.
Service Advance and Stop Advance
In most nonagency bonds, the servicer is required to advance delinquent principal and interest (P&I) to the trustee to the extent that it is deemed recoverable. Most RMBS transactions permit the servicer to be reimbursed for advances at the top of the trust payment waterfall.
Recent high delinquency rates and increased foreclosure and REO timelines are causing liquidity challenges for many servicers that are advancing into RMBS. Additionally, the cost of servicing a delinquent loan has been increasing and in some cases a servicer may not be able to recover all of its costs from the liquidation proceeds. Consequently, there is an increasing trend for servicers to stop advances.
There are also large servicer variations as can be seen in Exhibit 31–6. Servicers with difficult financing are more likely to stop advances. On the other hand, servicers within large banks tend to have a lower stop-advance rate. Servicers that push for more short sales also have lower stop-advance rates.
EXHIBIT 31–6
Stop-Advance Rates by Servicer

Stop-advance creates a large uncertainty to deal cash-flow. It can extend the life of senior bonds substantially. On the other hand, stop-advance can also reduce loss severity. The impact of stop advance on loss severity comes from savings on advanced interest payments. The more months that the servicer stops advancing, the fewer payments that will be deducted from the liquidation proceeds and therefore the severity will be lower.
CAPITAL STRUCTURE
Nonagency RMBS deals are structured to manage the two principal risks inherent in residential mortgages: prepayment and credit. The structure separates aggregated cash flows from the underlying loans into principal and interest and redistributes the cash flows and associated losses to individual tranches (bonds) according to rules specified in the deal prospectus (this is known as the waterfall).
From prepayment point of view, many nonagency RMBS work similarly to agency CMOs. They manage prepayment exposure and average life variability through time-tranching the cash flows, that is, each senior tranche has a different expected maturity and expected time window for principal repayment. Actual maturities will vary based upon realized prepayments, but are marketed based upon assumed prepayment speeds. One complication is that in nonagency RMBS the recovery from a credit default is treated as prepayment.
Many senior classes of RMBS deals also include specialty tranches providing additional exposure or protection to mitigate prepayment risk. Some of these include planned amortization classes (PAC) and companion (support) bonds, nonaccelerating senior bonds (NAS), interest only (IO), inverse IO (IIO), and principal only (PO). These are often created based upon specific investors preferences. In general, they make up a small percentage of total RMBS issuance, but it is important to carefully examine each tranche for cash-flow timing. Because these classes are analogous to those in an agency CMO, we are not going to cover them in this chapter. For a discussion of these bond types see Chapter 26.
Credit risks in nonagency RMBS deals were addressed through credit enhancements: external, internal through deal structure, or both. Credit enhancement levels are established to reasonably insulate senior bond investors from the risk of losses. In practice, issuers structure deals to maximize the issuance of AAA bonds since this maximizes the total deal proceeds. Deals that are backed by loans of high credit quality require less subordination than deals that are backed by loans of low credit quality.
External credit enhancements, primarily bond insurance, were commonly used at the early stages of nonagency securitization. Since the early 2000s, internal credit enhancements through deal structuring became the dominant method.
There are two major internal credit enhancement structures, senior/subordination (senior/sub) and over-collateralization/excess spread (OC/XS). For deals with lesser credit concerns, for example most prime jumbo deals, credit support relies entirely on redirecting losses to lower tranches. A deal typically has AAA-rated senior classes and subordinate tranches rated from AA to B. The prepaid principal is allocated to the senior tranches first and is then allocated down the deal structure while the losses are absorbed from the bottom up. This is the known as the senior/subordination shifting interest structure. For collateral with more credit loss concerns, such as subprime, additional layers of support were often added to the senior/sub structure through extra collateral principal and/or interest. This is the OC/XS structure. Alt-A deals and early deals are more likely to have the senior/sub structure while deals originated after 2004 increasingly utilized the OC/XS structure.
Fixed versus Floating Coupon
While deals backed by ARM collateral (hybrid and option ARM) are mostly floating coupon bonds, deals backed by fixed-rate mortgages can have both fixed and floating coupon bonds. While the underlying collateral is fixed, floating-rate bonds can be created by creating an inverse IO tranche in which the coupon is inversely correlated to the underlying index. Almost all residential ABS (subprime, HEL, and MH) and option ARM bonds have floating coupons. Prime and Alt-A deals can have both fixed-rate and floating-rate bonds.
Sequential versus Pro-Rata Payment
Sequential and pro-rata refer to the method of distributing payments across the classes in the deal. For sequential structures, the senior classes are paid principal first until they are paid-in-full, then the next senior tranche is paid, and so on. Pro-rata refers to making payments proportional to each tranche’s unpaid principal balance. For senior tranches with the same seniority, principal payments can be sequential or pro-rata, but losses are mostly pro-rata. Sometimes there are further hierarchies in AAA classes, with senior support bonds receiving losses before super senior bonds.
Lockout Period
Subordinate bonds are locked out of receiving prepayments for a period of time after deal settlement. The lockout periods for prime and Alt-A deals are typically 5 to 10 years while lockout periods for subprime deals are almost always 36 months. At the end of the lockout period, if the collateral performance meets or exceeds minimum credit conditions known as trigger tests, prepayments can flow into junior classes.
Triggers
To ensure that the credit support is still intact during the period when deals are most likely to experience losses, many deals contain a series of trigger tests to place limits on the amount and timing of any release of credit support (i.e., repayment of principal to the owners of the OC and/or subordinate bonds). The most common trigger is a delinquency test, which allows credit support to be reduced only if the 60+ day delinquency rate is low in relation to the current senior credit enhancement level, expressed as a percentage of the current outstanding balances. Other trigger tests include the factor test, requiring that the pool be paid down by at least half (i.e., the pool factor must be at or below 50%), the credit support level test which requires that the senior credit support level (in percentage terms) has at least doubled, and the cumulative loss trigger test, which limits principal payments to the OC and/or subordinate bonds if cumulative losses exceed some target level.
Linear or Y-Structure versus H-Structure
A deal can have one or several collateral groups. The linear structure is the most straightforward as it only has one collateral group and the cash flows from the single collateral group are distributed to all bonds. The Y-structure is a slight variation of the linear structure. In this structure, all of the subs and mezzanines receive cash flows from all collateral groups. At the AAA level, however, the collateral is divided into two groups by loan size–conforming balance and jumbo balance. Each AAA bond receives payments from only one of these two groups. The separation was intended to provide convenience for the GSEs to buy the conforming-size bonds. In the H-structure, there are two (or more) sets of mezzanine tranches and collateral groups and each mezzanine tranche is supported by each collateral group respectively. Each set of mezzanine tranches supports its own senior tranches. There is often cross-collateralization between groups in H-structure deals.
Cross-Collateralization
For H-structure deals, a deal typically contains multiple loan groups. After interest payments are made to bonds in one group, available funds from that group can be used to pay interest to bonds from another group. Among other things, this feature can also affect the value of residuals. For example, a deal with two loan groups would generally have two residuals. If the Group 1 OC was fully funded and the triggers passed, funds would be available to be released to the Group 1 residual. However, if the subordinates were cross-collateralized, which is normally the case, and the Group 2 OC was not fully funded, those Group 1 funds would be diverted to the Group 2 OC.
Clean-Up Call Provision
Before turning to the details of each type of structure, there is a final provision that is very common to nonagency RMBS deals, similar to agency CMOs—the clean up call. The clean up call gives the owner of that call, who is generally the residual holder, the option to purchase the remaining bonds at a prespecified price, usually at par plus accrued interest, when the factor is at or below a certain threshold, which is in most cases 10%. The main purpose of the clean-up call provision is to minimize the administration cost, but it also adds additional risk to senior bond or IO holders. A deal is more likely to get called if the collateral is clean with premium coupons and less likely to get called if it is distressed. When exercised, the call shortens the payment window and the average life of the back-end tranches. If the clean up call is not exercised when the factor is below the threshold, there is typically a step-up in coupon provision, which requires a moderate increase in coupon for the bonds that still are alive.
Senior/Subordination Shifting Interest Structure
Senior/Sub is the most direct approach to generate credit enhancement for senior tranches. In this structure, the senior classes (AAA-rated) typically have six supporting classes (AA, A, BBB, BB, B, and unrated), hence the name six-pack. The AA, A, and BBB classes are called the mezzanines as they are still investment grade; and the BB, B, and unrated residual classes are often referred to as subs. There is a lockout period at the early age of the deal when all of the unscheduled principal payments are allocated to the senior tranches and the subordinate bonds are locked out from receiving prepayments. The losses are absorbed from the bottom up, starting from the unrated piece, which is often called the first loss piece. At the end of the lockout period, if triggers are passed, the subordination will start to receive prepayments pro-rata.
Exhibit 31–7 illustrates the capital structure of a prime jumbo fixed-rate RMBS deal. In this deal, 96.1% of the total collateral was designed as senior AAA tranches (excluding the IO which is nominal based). Those tranches were supported by 3.1% of mezzanine tranches and 0.8% subs.
EXHIBIT 31–7
Illustration of the Shift Interest Structure RFMSI–2005 S8
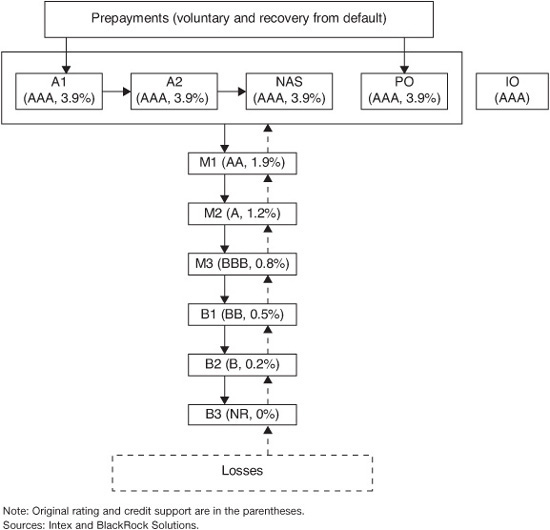
There is one IO tranche that receives interest based on all of the deal collateral balance. IO tranches are present in most six-pack structure deals. Although it is not the case in this deal, sometimes IO tranches are used to manage the differences between collateral interest payments and bond interest liabilities (essentially the excess spread).
When prepayments are received before the lockout period (in this case, five years), they first go to senior tranches. Prepaid principal only flows down to mezzanines and subs after the lockout expires and trigger tests are passed. Within the senior tranches, A1 and A2 are sequential so that A2 will not get any principal until A1 is paid off. A3 is a nonaccelerating fixed pay bond which receives only a fixed interest strip in the first five years and then amortizes down on a fixed schedule (hence the name). PO and A1 are pro-rata for all principal payments.
After the lockout period, if the shift-interest trigger test, measured by delinquency rate, is passed prepayments will also start flowing to the mezzanines and then to the subs. If at any point the trigger test fails, all of the unscheduled principal will be redirected back to the senior bonds.
It is important to note that in shifting interest structures, mezzanines and subs are receiving scheduled principal payments (and scheduled interest) during the lockout period. This is different from typical OC/XS structures. In the case of very slow prepayment speeds, as seen in many fixed-rate Alt-A deals today, this amortization can help shorten the WAL of mezzanine tranches substantially in senior/sub deals compared with that in OC/XS deals.
Losses will be absorbed first by the B3 class and then from the bottom up to other subs and the mezzanines subsequently. If losses penetrate all the way through M1, they will be distributed to all the senior tranches (A1, A2, A3, and PO) pro-rata. Note how thin (i.e., small size) these credit cushion classes are. It is not surprising to see the entire sub or mezzanine classes get wiped out. (In fact in this deal, the M3 and below classes have been wiped out and the M2, and even the M1 classes are on the way out as well.)
The shifting interest structure was designed mainly to deal with prepayment risk for senior bond holders. Obviously if losses come in much higher than the support level, senior bonds will suffer significant principal write down because of the thin enhancement. Higher expected losses led to rating downgrades, which put further downward pressure on prices. This is exactly what happened to many prime AAA bonds during 2009.
Overcollateralization and Excess Spread
When collateral credit loss becomes a large concern, issuers typically use the OC/XS structure to add presumably extra layers of protection. Most subprime deals and a large number of option ARM and Alt-A deals use this structure. Given credit pressures, some 2007 prime jumbo deals also adopted this structure.
OC/XS also uses the senior, mezzanine, and subordinate framework, but it adds extra collateral so that the collateral balance backing the deal is larger than the balance of its bonds. In addition, the note rates of subprime or Alt-A mortgages are typically high allowing collateral WAC (weight average coupon) to be higher than the WAC of the underlying bonds. As a consequence, there can be extra interest payments (excess spread) each month.
OC Target
There is a predetermined OC target, for example 2% of deal collateral, before the step-down date. At the inception of a deal, OC can be anywhere from 0 to the target (OC fully funded). If OC is not fully funded at inception, excess spread (after covering losses) will be used to build up OC. Because defaults typically don’t begin until after several months, very often OC could be built up within a year. When OC is at its target, excess spread will go to the residual holder. For deals with fully funded OC at inception, there is typically a NIM (net interest margin) class to receive excess spread. NIM tranches are often owned by residual holders. After the lockout period ends (step-down date) and trigger tests are passed, OC is allowed to be released or step-down gradually into either the NIM or residual holder, on the condition that senior bonds have predetermined levels of support. If triggers fail, the OC step-down can be stopped or it can step-up.
In terms of the order of absorbing losses, XS spread is the first line of defense, OC is the second, and the traditional subordinate tranches provide the final protection before losses reach senior tranches.
Step-Down
The step-down date refers to the time when junior bonds can start to receive principal and the OC can start to be released. It is typically the later of 36 months and the date at which the senior credit enhancement doubles the original CE or reaches a predetermined level.
In addition to the credit enhancement requirement for step-down, there are also many collateral performance trigger tests to control the direction of cash flows starting at the step-down date. Delinquency and cumulative loss triggers are quite common. These triggers are designed mainly according to rating agencies’ rating requirements.
Available funds cap risk and interest hedge: Most OC/XS deals pay floating rates to their bonds. The bond coupon is linked to a market index, for example one-month LIBOR + 20 bps. The coupon is typically capped at an available funds cap (AFC). The cap is often the weighted average rate of interest received from the collateral group backing the bond. Subordinate bonds typically pay a higher coupon than senior bonds, so the AFC would hit subordinates first. The major source of AFC risk comes from the mismatch between index movements and mortgage WAC changes. For example, a large movement in one-month LIBOR before the underlying mortgages reset would substantially increase the AFC risk. A large portion of low coupon fixed-rate mortgages in the collateral mix also increases the AFC risk. Large WAC dispersion among underlying mortgages can also result in AFC risk when higher coupon mortgages exit the pool more quickly than lower coupon mortgages. AFC risk is often hedged directly in the deal using interest derivatives such as a cap or a swap.
Exhibit 31–8 illustrates a sample subprime deal with OC/XS capital structure. 75.15% of this deal was structured as senior bonds with two collateral groups (the A1 group has a conforming balance for the GSEs’ convenience), 19.65% mezzanine, 2.3% subordinate, and 2.9% OC fully funded at origination. PEN is the NIM tranche which also receives prepayment penalties and there is a swap as an interest rate hedge. The deal settled in May 2006 and the step-down date was scheduled for June 2009.
EXHIBIT 31–8
Sample Subprime Deal Capital Structure, GSAMP 2006-HE3, as of June 2006
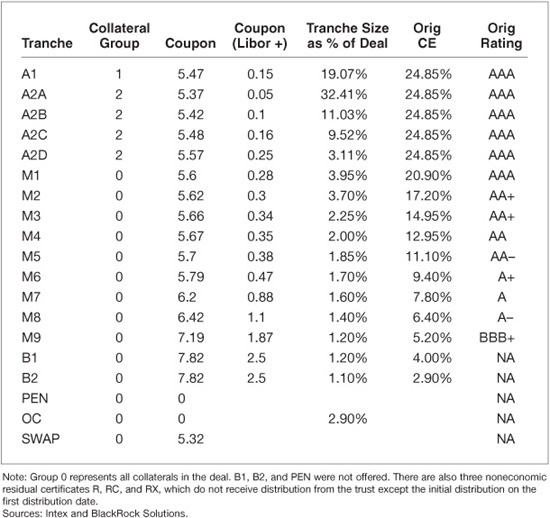
Within the AAA classes, the A1 is paid from group 1 and A2A, A2B, A2C, and A2D are paid from group 2. All junior classes are paid by both collateral groups. Bonds A2A, A2B, A2C, and A2D are sequential in terms of receiving principal. However, the principal payments will switch to pro-rata if sub tranches are extinguished through credit losses. The equivalent credit enhancement levels are misleading. Because of the sequential pay structure among the four bonds, slow prepayments can extend the life of these bonds substantially. Today the front pay A2A bond is paid off, but the lives of A2B, A2C, and A2D have all been extended. With the current very slow prepayment environment, the last pay A2D can have a weighted average life (WAL) of 20 years. If the M1 gets written down before that, it is very likely that the A2D will suffer the highest principal loss.
Different from a six-pack deal, junior bonds in OC deals do not receive any principal until the step-down date and performance triggers are passed. The mezzanine bonds can only start to receive principal after the deal step-down and once senior classes have been paid off. None of the junior tranches of this deal have received any principal since inception. In fact, the OC, M6, M5, to M4 have all been wiped out by losses. It is very likely that all of the mezzanine bonds will also be written down.
Compared with six-pack deals, the OC/XS structure is much more complicated. There are also more trigger events, which can make a bond’s cash flows extremely volatile because small changes in performance can trigger large swings in the cash-flow waterfall and have a major impact on a bond’s valuation. This substantially increased the uncertainty of future cash flows and made it very difficult to properly analyze these deals. Even though the triggers were set according to the rating agencies’ requirements, all senior bonds were downgraded many notches.
External Credit Enhancements
External credit enhancements are third-party guarantees that provide for loss protection against losses up to a specified amount. Typically external credit enhancements include pool insurance, letters of credit, bond insurance, and reserve funds.
Pool insurance is lender paid mortgage insurance at the pool level covering bankruptcy cram-down related losses, losses due to fraud in origination, or losses due to special hazards not covered by homeowner insurance. Letter of credit (LOC) is a financial guarantee by the issuing bank. LOC was one of the oldest forms of credit enhancement and has been rarely used in recent years. Reserve funds are straight deposits of cash generated from issuance proceeds. The fund typically invests in money market instruments. While reserve funds are common in auto and other consumer ABS deals, they are less frequently used in nonagency RMBS deals.
Bond insurance is a financial guarantee for the timely payments of principal and interest if these payments cannot be obtained from the cash flows of the underlying collateral. Bond insurance, also known as monoline wrappers, was provided mainly by monoline insurance companies. The major primary insurers included Municipal Bond Insurance Corporation (MBIA), Ambac Assurance Corporation, Financial Guaranty Insurance Corporation (FGIC), and Financial Security Assurances (FSA). The main reinsurers are ACE Guaranty Re, AXA Re Finance, Enhance Re, and RAM Re.
Bond insurance covers implied write downs as well. An implied write down occurs when a trustee is prohibited from writing down a bond by the deal documentation and there is a discrepancy between the remaining collateral balance and the bond principal balance. In order to correct this discrepancy and realize the losses more quickly, wrappers typically recognize an implied write down as a credit event, which will decrease the reference obligation notional amount even though the bond principal balance remains unaffected. This works the same way as CDS.
Unlike internal credit enhancements, external enhancements are simple and reduce overall credit risk. However, it introduces counterparty risk. During the financial crisis, the monoline insurers suffered a large amount of losses. Some of them are currently in bankruptcy or under serious financial stress and as a result, many bond protections were rescinded. The values of monoline wrappers have dropped substantially and some are even valued at or near zero.
HOUSING MARKET
The housing market is the single most important macroeconomic driver in the nonagency market. Price appreciation and home sales volume are two critical measures of the housing condition. Exhibit 31–9 shows home price appreciation (HPA) and existing home sales (EHS) in the U.S. since the late 1980s. The housing market had experienced rapid growth since the early 2000s, with 10%+ annualized HPA. HPA was, in most cases, accompanied by sharp increases in home sales. In these years, EHS increased from 6% to almost 9%. As a result of the housing market boom, many lenders and investors neglected mortgage credit risks, which in turn greatly stimulated the nonagency RMBS market.
EXHIBIT 31–9
Annualized House Price Appreciation and Percent of Existing Home Sales in the United States since Late 1980s

However, this growth was followed by the greatest housing bust in American postwar history as home sales slowed down in mid-2006 and prices started to decline. The decline in 2006 was relatively mild and many people were expecting a soft landing. By early 2007 it was clear that this was wishful thinking, and a downward spiral began. Similar to the nonagency crash, the housing market bust also consisted of several vicious cycles. Due to declining home prices, many potential buyers held off on purchases and this substantially slowed down home sales. The lower demand pushed prices down even further. Additionally, declining prices triggered increases in delinquency, which further increased the distressed housing supply, which dragged down overall prices even further. At the same time, the liquidity crunch put huge pressure on the housing market as many borrowers could not get a mortgage. Therefore, the weakened housing market further deepened the financial crisis.
The housing market reached its worst point in early 2009 with a –18% year-over-year HPA nationwide. Case-Shiller HPI declined by 32% from the peak of Q2 2006 to Q1 2009, while existing home sales declined from its peak value of 9% in Q1 2005 to 5.2% in Q2 2009 (see Exhibit 31–9).
The housing market started to rebound in mid-2009, driven largely by pent-up demand, the Federal housing tax credit, a low interest rate environment, and credit becoming re-accessible. Home sales activities increased substantially and prices were on the rise. However, after the tax credit expired, excess demand was quickly exhausted. Momentum disappeared and home sales slowed down substantially yet again.
A significant problem in the housing market is the overhang of millions of distressed properties, including those in REO, in foreclosure, and with loans in serious delinquency. With this large shadow inventory it will take a long time for prices to recover. Loan modifications and foreclosure moratoriums slowed down the pace of distressed property flooding the market, which helped to reduce near-term housing pressure. However, these mechanisms also prolonged the liquidation timeline and resulted in a longer housing overhang and a slower recovery.
Geographic Segmentation
The home price index and existing home sales indices reveal a clear geographic segmentation within the overall housing market. Exhibit 31–10 shows Case-Shiller HPI for U.S. Census Geographic Divisions and U.S. aggregate HPI. Geographic segmentation is observed on each level—for states within each census division, metropolitan statistical areas (MSAs) within each state, and zip codes within each MSA.
EXHIBIT 31–10
Housing Price Index in Selected Census Track
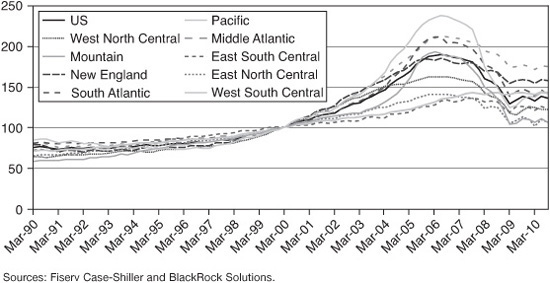
Geographic segmentation within the housing market makes it extremely important to understand the geographic distribution of nonagency collateral. Loans with the same original LTV but from different geographic segments will have very different mark-to-market LTVs. Future home price appreciation will also be different. It is worth noting that historically the correlation among geographic segments is relatively small, which gives MBS the benefit of diversification. However, the correlation during the crisis tends to be much larger, leading to substantial fat-tail risk.
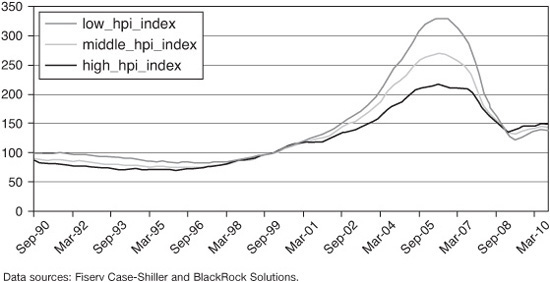
Variation among Property Tiers
There is also observed segmentation of the housing market based on home values, that is, price tiers. Fiserv Case-Shiller provides HPI on different price tiers. All sales are divided into three groups: high price, medium price, and low price, so that proportions of each tier in total sales are equal. A home price index is then constructed for homes in each pricing tier. Depending on the state, each tier experienced different home price appreciation and consequent depreciation paths. For example, in California, low price homes appreciated the fastest, growing by 230% from Q1 2000 to the peak of Q2 2006, while high price homes during the same period appreciated only by 115%. Consequently, the current drop from peak values is –58% for low price homes and only –31% for high price homes (Exhibit 31–11). However, in other states, like Colorado, all three tiers experienced the same modest home appreciation and consequent depreciation from peak values.
EXHIBIT 31–11
California Case-Shiller HPI by Price Tiers
The difference between the high-end and the low-end of the market has large implication on nonagency RMBS relative values. The prime jumbo sector, for example is mainly backed by high-end properties. Home price depreciation is less pronounced for prime jumbo mortgages, which partially contributed to the relatively low delinquency rate in that sector—the prime jumbo delinquency rate is even lower than that of agency mortgages. However, the lack of financing in the jumbo mortgage market is much more serious than in the conforming market.
MORTGAGE MODIFICATION
Although loan modifications were always available to servicers as a loss mitigation tool, they had never been widely applied before the crisis. As mortgage delinquencies worsened in 2007, the government started asking mortgage servicers to increase their loan modification efforts to try to keep people in their homes. Several guidelines or programs were created by various government agencies. Many failed due to lack of practical clarity, lack of servicer incentive, and lack of mechanisms to prevent corresponding moral hazards. In 2009 the government introduced the Home Affordable Modification Program (HAMP). HAMP set forth a standard model to determine the net present value of modifications and provided monetary incentives for servicers to participate. HAMP was implemented by most servicers. By the end of 2010, there were about 1.2 million loans modified through the HAMP program.
There are several types of modifications. The most common approach is recapitalization in which the accrued interest on a past due loan is rolled into the principal. Sometimes this is accompanied by a term increase, but more often a recapitalization results in an increased monthly payment. A more effective type of modification involves reducing the interest rate of the mortgage, which can reduce the borrower’s monthly payment without an immediate principal loss to investors. Principal forgiveness and forbearance are more extreme approaches, but the most direct to address the negative equity issue that borrowers are facing. Under principal forgiveness the borrower does not owe the remaining balance on the original loan, which leads to a direct loss to the trust. With principal forbearance the remaining balance is due as a balloon payment at maturity.
Under most pool servicing agreements, servicers can modify a borrower’s mortgage if they feel that it will benefit the trust through higher recovery or more timely payments. Some deal documents will specify limitations on modifications but for the most part it is up to the discretion of the servicer. Furthermore, servicers can also use HAMP as a safe harbor. If expected default and loss severity levels are high without modification, then modifying loans can actually lead to more cash flowing to the trust. However for a high risk loan, the re-default risk also tends to be high if modified. So it is largely up to servicers’ discretion on which loan to modify and how many loans to modify.
The number and type of modifications in nonagency RMBS has changed substantially over time as government programs were developed and altered. While the total number of modifications was greater in the first half of 2009, most of the modifications offered borrowers a recapitalization only or a very modest interest rate reduction. Over time the total number of modifications has decreased, but the share that use principal reduction has increased from 20% at the beginning of 2009 to 35% by the end of 2010 while the share of recapitalization has declined substantially. There have not been as many modifications in Alt-A collateral, but generally the pattern is similar to what is observed in subprime modifications. The number of modifications in option ARM has been relatively small but the majority type is principal forgiveness or forbearance. Prime jumbo modifications are not as common.
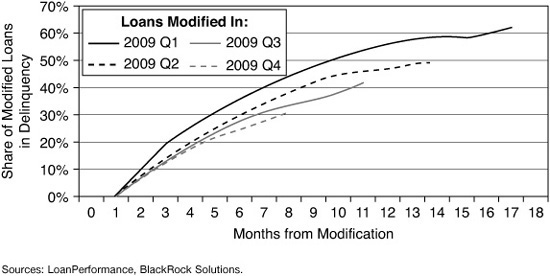
Recidivism
Recidivism, or re-default after a modification, is a challenge to modification policy. Exhibit 31–12 shows the delinquency rate post modification for subprime mortgages modified in 2009. Early in 2009, when recapitalizations were the most common type of modification, delinquency rates were very high, surpassing 60%. After HAMP was implemented, in the second half of 2009, delinquency rates fell due to the greater use of interest rate and principal modifications. Principal modifications are particularly effective in the case of negative equity. Reducing the loan principal so that the balance owed is in line with the value of the property reduces the incentive for a borrower to default.
EXHIBIT 31–12
Observed Delinquency Rate for Modified Subprime Loans
Valuation Impact
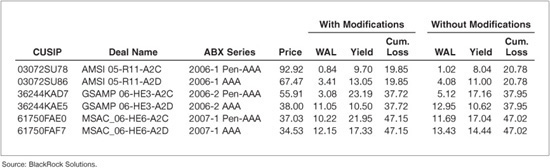
The impact of modification for bond investors depends on the type of bond, where it is in the capital structure and current price levels. Exhibit 31–13 shows the impact of applying a stylized modification scenario to several bonds in the ABX. The scenario assumes that 10% of loans receive principal and rate modifications, 25% receive a rate only modification and the remaining 65% are not modified. Principal reduction is set to 20% and the rate reduction is 5%. The results in Exhibit 31–13 demonstrate that this scenario does not materially change the cumulative loss to the bonds, but delays defaults thereby extending the bonds and lowering implied yields.
EXHIBIT 31–13
Impact of Modification Projections
RELATIVE VALUE AND RISK ANALYSIS
Here we introduce the analytical framework for relative value and risk analysis. Prepayment and credit models and roll rate analysis are commonly used in this framework.
Analytical Framework
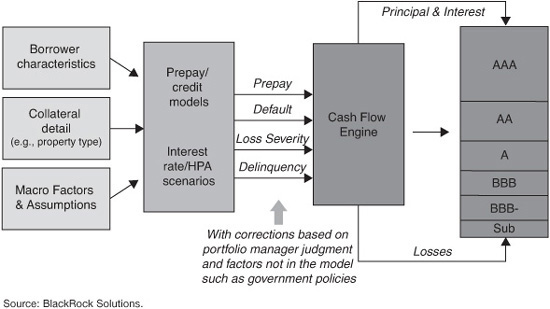
As described, collateral, capital structure, the housing market, and loan modifications are all important aspects to analyzing nonagency RMBS bonds. To combine all of these factors, investors need an analytical framework similar to the one described in Exhibit 31–14. The primary components of this framework include collateral data, macro assumptions, performance projection models, and cashflow engines.
EXHIBIT 31–14
Nonagency Analytical Framework
Key Risk Metrics
In addition to the standard valuation and risk measurements such as yield, weighted average life (WAL), discount margin, option-adjusted spread (OAS), option-adjusted duration (OAD), option-adjusted convexity (OAC). The following metrics are widely used in the nonagency industry.
1. Cumulative loss: realized principal loss plus future expected loss divided by original balance of the deal
2. Remaining loss: future expected loss divided by current balance of the deal
3. Principal write down: principal loss for the bond
4. Interest shortfall: interest distributed is less than the amount of interest accrued
5. Coverage ratio: measured by the ratio of remaining loss of a deal collateral to credit enhancement of a bond within the deal
6. Break-even multiplier: an intensity multiplier that when applied to a model, the projected remaining loss will equal to the credit enhancement to a bond
Prepayment and Credit Models
Prepayment and credit models help project collateral future performance, including conditional prepayment rate (CPR), conditional default rate (CDR), delinquency, and loss severity for each collateral group within a deal. The models typically use historical data to establish relationships of prepayment and credit performance to loan characteristics, current loan status, and macroeconomic environments. For example, a delinquency model can be a function of seasoning, FICO, LTV, DTI, documentation, state, etc. The delinquency to foreclosure roll rate can be a function of current LTV, state judicial law, the housing market condition, etc.
The purpose of prepayment and credit models is to project future cash flows under various rate, home price, or other scenarios. Given the empirical natural of these models and the ever-changing market dynamics, it is critical to keep the model updated. As we learned from the mortgage crisis, history does not simply repeat itself. Therefore, a model should never be about purely fitting history. A good model uses historical data to learn about borrower behavior under various environments and puts less emphasis on historical fit, but focuses more on forward looking capabilities; it is really a mix of science and art.
All models require some assumptions. Some are explicit, for example, the future HPA assumption, whereas others are more implicit, for example, the prepayment model may assume that a prepayment channel is always available. It is very important for investors to understand each assumption within the model.
Roll Rate Analysis
Roll rate analysis is a simple but intuitive way to analyze a bond’s performance and can be quite accurate in forecasting near term performance. This approach only requires the deal’s transition matrix, which can be obtained using recent historical data. Exhibit 31–15 is a sample transition matrix. Given the transition matrix, one can compute the prepayment and default rates for each delinquency status bucket.
EXHIBIT 31–15
Sample Transition Matrix of Alt-A Deal
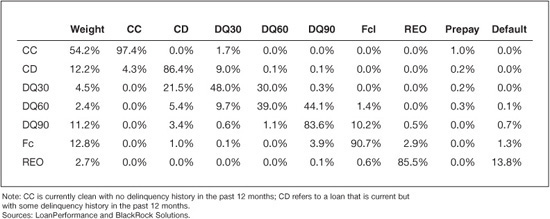
The disadvantage of roll rate analysis is that it ignores the underlying economic drivers. For example, it has to assume the roll rates stay the same going forward, which is inconsistent with the natural selection phenomenon many loan pools exhibit over time. If the macroeconomic environment changes the roll rates are unlikely to stay constant.
KEY POINTS
• Nonagency RMBS are not guaranteed by GSEs or government agencies and include securities backed by prime jumbo, Alt-A, option ARMs, subprime, second lien, and manufactured housing mortgage loans.
• The two principal risks inherent in a pool of residential mortgages that nonagency RMBS deals are structured to manage are prepayment risk and credit risk. The structure separates aggregated cash flows from the underlying loans into principal and interest and redistributes the cash flows and associated losses to individual tranches according to rules specified in the deal waterfall.
• Collateral characteristics and capital structure are the two key aspects of nonagency RMBS relative value and risk analysis. Servicers can play a large role in determining the collateral cash-flow.
• Key measurements of collateral performance include delinquency, default, voluntary prepayment, and loss severity.
• Credit risks in nonagency RMBS deals were addressed through credit enhancements: external, internal through deal structure, or a combination of the two.
• The housing market is the key fundamental determinant of nonagency mortgage performance.
• Loan modifications, foreclosure moratoriums, and servicer stop-advancing have created significant uncertainty to deal cash flows and present challenges for investors valuing and assessing risk for these bonds.
• Prepayment and credit models help project collateral future performance.