
Performing Risk Assessments
A risk assessment is a point-in-time evaluation. It looks at the current situation and attempts to determine what risks exist and how to address them. For example, you can perform a risk assessment to determine risks for e-mail servers in your organization. This assessment will examine current threats, system configuration, interconnectivity, the amount of e-mail processed, fault-tolerance capabilities, power and air conditioning requirements, and more. However, after the assessment is completed, any of these elements can change, affecting the results of the assessment.

EXAM TIP A risk assessment looks at risks at a specific time and needs to be repeated periodically to ensure that current risks are assessed. In contrast, risk management is an ongoing practice.
It’s common for an organization to redo a risk assessment periodically for high-value assets. The frequency is variable, but many risk assessments are repeated annually.
Risk Assessment Steps
An important first step in performing a risk assessment is to identify the scope of the assessment. Any large project is susceptible to scope creep, where the project slowly grows well beyond the original goals. For example, if the goal of the assessment is to assess risks associated with e-mail, the study can easily extend into the network infrastructure, including routers and firewalls. It could include power and air conditioning supplied to the entire server room. It could also include malware protection on individual clients, and much more. If the goal is to examine only the direct risks associated with the e-mail servers, the scope should identify this.
Figure 7-4 shows the overall steps associated with a risk assessment as recommended in NIST SP 800-30, along with the result of each of these steps. The following provides an overview of these steps:
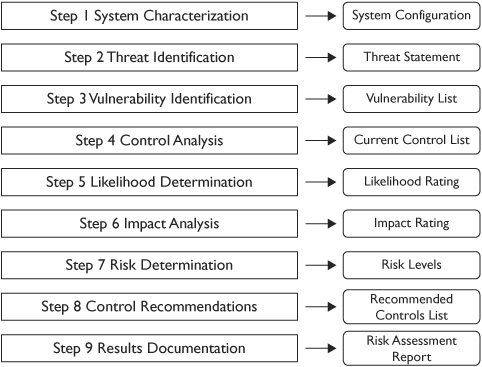
Figure 7-4 Risk assessment steps with results of each step
1. Step 1: System characterization This is largely an information gathering step where you identify and document the current state of the system. The result of this step is documentation showing the current system configuration.
2. Step 2: Threat identification In this step, you attempt to identify threats to the system. Recall that threats can be internal or external, natural or manmade, and intentional or accidental. The result of this step is a threat statement that includes a list of threats or threat sources.
3. Step 3: Vulnerability identification Next, vulnerabilities are listed and matched with threats to provide a listing of vulnerability/threat pairs. The result of this step is a list of system vulnerabilities that could be exploited by specific threats or threat sources.
4. Step 4: Control analysis An organization will typically have safeguards or controls in place designed to mitigate risks. Additionally, some controls may be in the purchasing pipeline but not implemented yet. This step provides a list of both current and planned controls.
5. Step 5: Likelihood determination Threats and vulnerabilities are analyzed to determine the likelihood that a threat could exploit a vulnerability and result in a loss. This determination is based on the current configuration, the current controls, and the expected protection from controls that haven’t been purchased yet. This step provides a likelihood rating for each of the threat/vulnerability pairs and can be stated simply as a low, medium, or high risk.
6. Step 6: Impact analysis The impact refers to the magnitude of harm that could result if a threat exploits a vulnerability. It typically evaluates the impact against the potential loss of confidentiality, integrity, or availability. This step is very important because a high-impact risk could result in catastrophic consequences and needs to be assigned a high priority, even if it has a low likelihood of occurring. This step provides a magnitude of impact rating and can be stated simply as low, medium, or high.
7. Step 7: Risk determination In this step, the threat likelihood is matched with the impact to determine the overall risk. A low likelihood combined with a low impact results in a low risk while a high likelihood combined with a high impact results in a high risk. Some of this determination is subjective. For example, the possibility of a fire is low, while the impact would be high. In this case, the risk could be listed as high because the impact could be catastrophic. This step provides a risk level for each threat/vulnerability pair and can be stated simply as low, medium, or high.
8. Step 8: Control recommendations In this step, controls or safeguards are examined that can mitigate the identified threat/vulnerability pairs. The goal is to identify controls that can reduce the risk to an acceptable level. This step provides a list of recommendations for controls or safeguards that can mitigate risks.
9. Step 9: Results documentation The final step documents the findings of the assessment. It provides a report that describes the threats, vulnerabilities, impact analysis, and recommendations for controls. Management then has the ultimate responsibility of deciding what controls to implement.
Looking at the overall goals of each of these steps, you can see that a risk assessment can be quite a large project in itself. Simply identifying all the threats for a given system can be a daunting task. If you’re attempting to assess the risks associated with an entire IT infrastructure, it can take a significant of time and effort. However, it’s important to realize that previous risk assessments probably exist and can be used as a template. If you’re redoing a risk assessment, you only need to identify the changes since the last risk assessment.
A significant output of a risk assessment is the impact analysis in step 6. Common methods to complete this step are quantitative analysis and qualitative analysis, which are explained in the following sections.
Quantitative Analysis
A quantitative analysis uses numerical-based data such as monetary figures to identify the actual cost associated with a risk. There are several variables associated with a quantitative analysis. If you can identify the values of these variables, it becomes a simple matter of plugging them into a formula to prioritize different risks. This value also helps to justify costs for mitigation controls.
The following terms are important to understand when using a quantitative analysis:
• Single loss expectancy (SLE) If the loss occurs one time, this value identifies the actual loss of that single occurrence. For example, if a revenue-generating website is down for an hour, the company could determine that it results in a loss of $10,000.

TIP The SLE would include both tangible and intangible costs. Tangible costs would include the actual lost revenue that can’t be generated while the site is down. Intangible costs include the costs associated with lost customers or advertising to rebuild the company image.
• Annual rate of occurrence (ARO) This identifies how often the SLE is expected to occur in a given year based on the current environment. You can use historical data to determine the ARO. For example, if the website experienced three one-hour outages each year in the past two years, it will probably experience three one-hour outages this year and next year if something isn’t changed.
• Annual loss expectancy (ALE) You can calculate the ALE by multiplying SLE * ARO. For example, if the SLE is $10,000 and the ARO is three, the ALE is $10,000 * 3, or $30,000.
• Cost of control A control will mitigate a risk. For example, if the outages were caused by faulty hard drives, but these drives can be replaced with hardware RAID-5 arrays for $5,000, then the cost of the control is $5,000.
If the cost of the control is less than the ALE, then it is justified. If the cost of the control exceeds the ALE, it may not be justified. If the cost of the control is about the same as the ALE, then the company can do a detailed cost/benefit analysis to determine the actual return on investment (ROI) for the control.
In our example, the cost of the control is $5,000, but it will prevent an ALE of $30,000. If the company does nothing, it can expect to lose $30,000. If the company implements the control, it expects that it will not have any outages related to hard drives on this server. In other words, if the company spends $5,000, then it can expect to save $30,000 for a net savings of $25,000. The cost of the control is justified.
It’s also possible that by implementing a control, you don’t expect to eliminate the risk completely, but instead you expect to reduce the ARO. Using the previous example, it’s possible that by adding some additional hardware RAID-5 arrays, you expect that you’ll be able to reduce the ARO from 3 to 1. In other words, even if you pay $5,000 for the hardware RAID-5 arrays to replace many of the hard drives, you still anticipate that you may experience a failure in an unprotected drive as often as once a year. Is this cost justified?
You’ve reduced the ARO from 3 to 1, so you’ve reduced the ALE from $30,000 to $10,000. Because the control (the hardware RAID-5 arrays) cost $5,000 and you still expect a loss of $10,000, the expenditure is $15,000. If you did nothing, you’d expect to lose $30,000, so the net gain is $15,000. Yes, this cost is still justified, even if it doesn’t completely eliminate the risk.
On the other hand, if the ALE is $1,000 and the cost of the control is $30,000, the control is not justified because it results in a net loss of $29,000. You’re spending $30,000 on a control to prevent a $1,000 loss. In this situation, management would typically decide not to implement the control and accept the risk.
EXAM TIP When preparing for the SSCP exam, it’s important to have a solid understanding of SLE, ARO, and ALE. You should also be able to evaluate the cost of a control to determine whether it is justified.
An advantage of the quantitative analysis is that it provides clear a measurement, in the form of a monetary figure, of the magnitude of harm associated by an impact. This figure can easily be used in a cost/benefit analysis to determine whether a control should be used. However, the numbers used to create a quantitative analysis are not so easy to obtain. This is especially true when the SLE includes intangibles.
Qualitative Analysis
A qualitative analysis is subjective and often simply categorizes a risk using words such as low, medium, and high. For example, Figure 7-5 shows the relationship between impact and likelihood ratings and how they can be used to determine overall risk. Notice that there’s a direct relationship between likelihood and impact. As the likelihood and impact increases, the risk also increases.
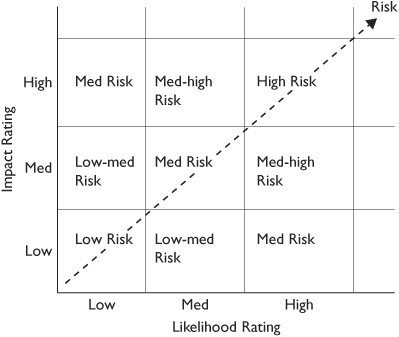
Figure 7-5 Qualitative analysis based on impact and likelihood ratings
In Figure 7-5, you can see a low impact combined with a high likelihood results in a medium risk. It’s important to realize this is just a guide and that the security professional doing the assessment will likely add in some subjective reasoning. As mentioned previously, a fire has a low likelihood, but a high impact, yet may be classified as an overall high risk because the result of a fire can be catastrophic.
It’s also possible to assign values to the ratings. This allows you to prioritize the risks based on the result. For example, imagine that you’ve assigned a value of 1 for low, 5 for medium, and 10 for high. You can then use these values to determine a value of the risk by multiplying the likelihood rating by the impact rating. Table 7-1 shows a risk level matrix that combines these ratings and shows resulting values.
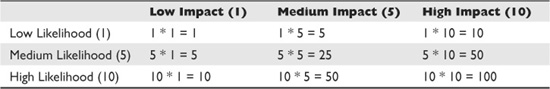
Table 7-1 Risk Matrix Using Qualitative Analysis
TIP An organization can use any words or values desired for the ratings. For example, instead of just using low, medium, and high, you can add in low-medium with a value of 2.5 and medium-high with a value of 7.5.
Table 7-2 shows how these ratings can be used for individual threat/vulnerability pairs. It shows three threat/vulnerability pairs with risk scores of 5, 50, and 100. The pair with a score of 100 represents the highest risk and needs to be addressed first.
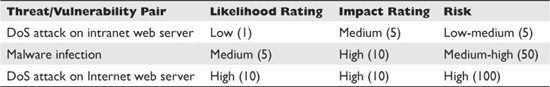
Table 7-2 Risk Matrix Ratings Used for Individual Threat/Vulnerability Pairs
An advantage of the qualitative analysis is that it provides a clear priority of the different risks. Simply by looking at the result of the analysis, it becomes a simple matter to determine what risks should be addressed first. A disadvantage is that it is difficult to use the results in a cost/benefit analysis when evaluating controls.
EXAM TIP A quantitative analysis uses numerical data such as monetary figures and is objective. A qualitative analysis uses scenario-based data and is subjective. Many organizations use both methods for different risk assessments.
Address Findings
An important step after completing a risk assessment is to address the findings. In many cases, the assessment will recommend implementing specific controls to mitigate the risks.
Of course, management makes the decision to approve or disapprove any recommended controls. If they choose to disapprove a control, they are instead deciding to accept the risk. However, this should be a conscious decision. If an assessment is just completed and management files it away without making conscious decisions on what controls to implement and what risks to accept, the entire process becomes a waste of time.