
CHAPTER 12
![]()
Video Basics, Including Video Signals
What can be said about transmitting motion pictures electronically? This is a process that started back in early 1900s that we now know as television (TV). At first, there were mechanical television systems such as those pioneered by Charles Jenkins. One of the first images captured, sent, and later received and displayed with less than 100 lines was a picture of Felix the cat, a cartoon character.
However, an all electronic television system proved to be much more practical than a mechanical system. For example, the number of scanning lines could be changed easily by modifying an oscillator’s frequency. The number of pixels across the screen also could be increased easily by increasing the bandwidth of the video signal. If all these terms (i.e., pixels, bandwidth, etc.) seem unfamiliar now, in this chapter we will explain how lines, pixels, and other signals work in making a television signal. The basic concepts of resolution, number lines and pixels, and frame and field rates will be discussed. Also, we will explore how the common controls we adjust for a computer monitor or TV set work, such as contrast, brightness, and sharpness. We will find out that the frequency response of a video channel affects the resolution and sharpness of the displayed picture. Just like a treble boost control in an audio amplifier that emphasizes the middle to high audio frequencies (e.g., 1 kHz to 20 kHz), a sharpness control for standard 480i or 576i line standard definition TV system has frequency boost at about 1 MHz to 5 MHz.
Once we know about the characteristics of a picture—how is it sent in an orderly manner—we will find that embedded in every television signal (analog or digital) are synchronizing signals or clock regeneration signals.
Finally, we will look at analog color TV signals. There were at least seven types of analog color TV standards prior to the switchover to digital television. Most of these analog color TV signals used a form of I and Q modulation, which are amplitude- and phase-modulated signals.
Examining Still Pictures First for Contrast, Brightness, Resolution, and Sharpness
Television is the transmission or sending of multiple images that are formatted in a particular manner in two dimensions, the X and Y axes, otherwise known as the vertical and horizontal axes, respectively. For still images, such as those taken with a digital camera, the concepts of contrast, brightness, resolution, and sharpness are the same as for television pictures.
For now, we will work with black and white (aka monochrome) pictures. In a still picture represented by 8 bits per pixel, the brightness typically has up to 256 levels of gray starting from black at 0 and peak white at 255 (peak white = maximum brightness in a scene). Figure 12-1 shows pictures with high contrast, normal contrast, and low contrast.

FIGURE 12-1 (a) A high-contrast picture illustrating increasing contrast via Adobe Photoshop. (b) Original picture with normal contrast. (c) A low-contrast picture produced by rendering the normal contrast picture with Adobe Photoshop.
An increased-contrast picture looks “punchier” by increasing the gray levels above middle gray (e.g., 128 of 255) to a brighter or higher level of gray approaching the white levels. Conversely, increased contrast pushes the gray levels below middle gray toward the black levels. An extreme case of very high contrast occurs when one makes a photocopy of a picture. We see primarily only tones that are all black or all white, with very little in terms of different shades of gray. In a low-contrast picture such as the one depicted in Figure 12-1c, the brighter levels have been pulled down to the middle-gray level.
Now let’s take another look at high-, normal-, and low-contrast pictures. When one “brackets” the photographic exposure of a subject to +1 and –1 F-stops of exposure compensation, the equivalent video gain is at 2× the normal signal range for a +1 F-stop of overexposure that results in increased contrast and (½) × the normal signal range for a –1 F-stop of underexposure that causes a low-contrast picture. Figure 12-2 shows the effects of overexposure, normal exposure, and underexposure of photos taken at night. Note in Figure 12-2a that the contrast is higher among the last three houses on the right side compared with Figures 12-2b and 12-2c.
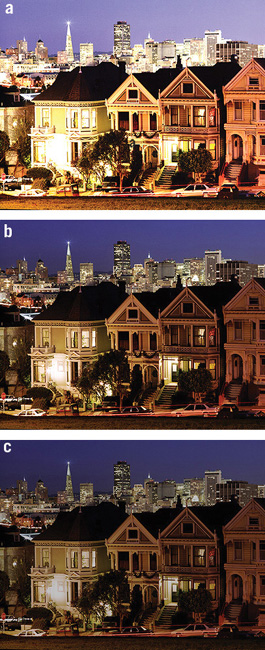
FIGURE 12-2 (a) An overexposed picture that results in higher contrast. (b) A normally exposed picture with normal contrast. (c) An underexposed picture that results in lower contrast.
It should be mentioned that more commonly, pictures that are taken in the daytime show lower contrast when under- or overexposed compared with a normally exposed photo that shows a fuller range of contrast. The overexposed pictures tend to look too bright with a white-washed out look, whereas the underexposed pictures tend to look too dark.
From the pictures in these figures, we see that contrast is a function of peak-to-peak signal level from the dark or black levels to the peak white levels. Pictures whose brightness levels show a great deal of deep blacks to peak whites are higher contrast than the same pictures with less frequency or occurrence of deep blacks and peak whites. High-contrast pictures thus have high occurrences of the 0 to 255 brightness range.
Low-contrast pictures may have brightness levels congregrating near the middle grays or lower grays or even near the peak white levels. In all cases for low-contrast pictures, the peak-to-peak brightness level is a fraction of the full brightness range. For example, if the full brightness or luminance range is 0 through 255, a low-contrast picture will have a peak-to-peak range of less than 128 (Figure 12-3).
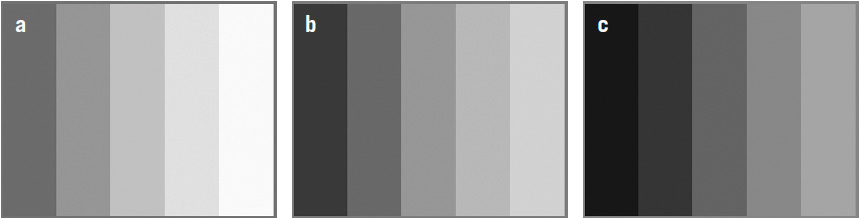
FIGURE 12-3 (a) Lower-contrast picture weighted toward the brighter gray areas. (b) Lower-contrast picture weighted toward middle gray. (c) Lower-contrast picture weighted toward darker gray or near-black level.
We now turn to the brightness control, which is a direct-current (DC) offset added to the brightness levels. Actually, the peak-to-peak brightness or luminance levels do not change, but the brightness control can place the luminance levels in a different range to give the appearance of higher or lower contrast. Let’s see what we mean by this (see Figure 12-4).
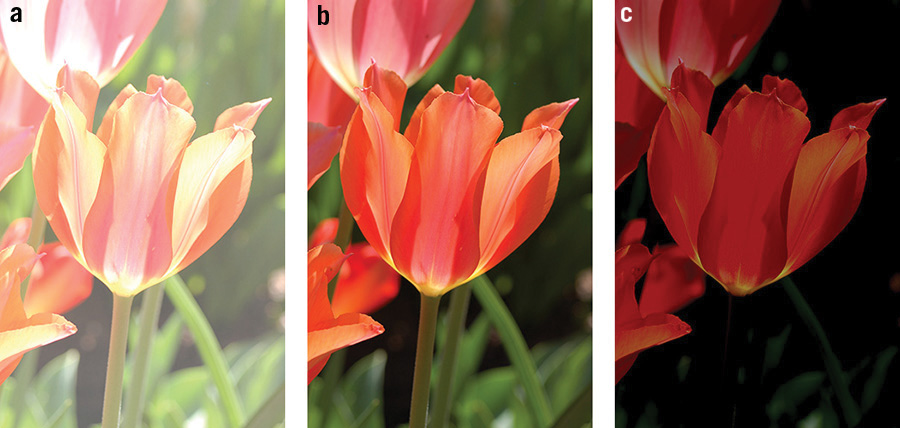
FIGURE 12-4 (a) Adding too much brightness also causes highlight blocking or loss of details in the upper gray areas. (b) A normal-contrast picture with the brightness control set in the middle or 0 volt DC offset. (c) Lowering the brightness control also lowers the contrast of the picture.
In Figure 12-4a, a normal-contrast picture is brightly washed out by adjusting the brightness control in Adobe Photoshop. This is equivalent to adding a positive DC offset voltage to bring the black levels to gray and the gray levels to near white. In Figure 12-4c, a normal-contrast picture with the brightness control set to adding a negative DC offset results in pulling the middle gray parts of the picture to near black and the peak white portions to an upper middle gray. Note that lowering the brightness causes loss of details in the shaded or dark areas. This is also known as a loss of shadow detail, which is quite apparent in Figure 12-4c.
We now can show how varying the video signal amplitude (via VR1) and changing the DC offset (via VR2) of video signal can be used to adjust the display characteristics (i.e., contrast and brightness) of a cathode-ray tube (CRT) TV monitor (Figure 12-5). As shown in Figure 12-5, a video signal is sent to an inverting-gain amplifier –A1. The output of amplifier –A1 is changeable in amplitude via VR1. Its output is connected to AC (alternating-current) coupling capacitor C1.

FIGURE 12-5 Diagram of contrast and brightness controls for a video or picture signal.
Diode D1, capacitor C1, and DC voltage amplifier +A2 form a DC restoration circuit to clamp the positive peak (e.g., synchronizing pulses’ sync tips) of the video signal to a positive voltage as adjusted by brightness control VR2. The output of the DC restoration circuit at the anode of D1 is connected to the cathode of a cathode ray tube (CRT). The DC restoration circuit ensures that the black level does not shift with various bright and dark scenes in the program video source.
Many older TV sets that used vacuum tubes did not have DC restoration circuits at the cathode of the CRT. Instead, the cathode of the CRT was AC coupled from the output of the video amplifier, and the cathode was biased via a resistor to a variable voltage source for changing the brightness. When a scene faded to black, the display actually faded to gray.
Resolution or Fine Detail of a TV Picture
We now turn to the concept of resolution, which is measured by the number of lines that are displayed and sensed by the viewer. With pictures, determining resolution in general is a subjective way of placing a numerical figure on how much fine detail is observed. One criterion for defining resolution is when the fine detail information is about one-quarter the contrast of a low-spatial-frequency reference signal. Figure 12-6a shows a TV monitor with a “multiburst” signal with increasing spatial frequencies across the screen. The resolution of a video signal is primarily determined by the bandwidth or highest frequency that can be delivered to a monitor.
On the display shown in Figure 12-6, the multiburst signal starts with white and black levels followed by six packets (e.g., 0.5 MHz, 1 MHz, 2 MHz, 3 MHz, 3.58 MHz, and 4.2 MHz from the video signal) of increasingly finer resolution of vertical lines. The first three packets are clearly discernible with very good contrast between the white and black stripes. As we look at the last three packets of finer-pitched vertical lines, we see that the white and black stripes do not have as much contrast. In particular, the last packet of the finest-pitch vertical lines on the right side is discernible, but not as well as the first packet of lower-pitched vertical lines on the left side of the screen. A one-horizontal-line waveform of the multiburst signal is shown in Figure 12-7.

FIGURE 12-6 Multiburst signal displayed on a TV monitor.
FIGURE 12-7 A portion of a multiburst waveform starting with a white and a black level followed by six packets (e.g., 0.5 MHz, 1 MHz, 2 MHz, 3 MHz, 3.58 MHz, and 4.2 MHz) of sine waves of increasing frequency and finally ending with a horizontal sync pulse.
In the monitor itself, the resolution is often determined by the number of pixels for a flat-screen device, and in a CRT (cathode ray tube), the resolution is determined by the number of dots or stripes across the screen and the spot size of the electron beam. Also, the video bandwidth or frequency response of the video signal’s processing amplifier affects the horizontal resolution (e.g., ability to resolve fine-pitched vertical lines of the display).
So what is resolution, and what does it mean to have X number lines of resolution? For digital photographs and TV, the definition of a line is the ability to observe either a dark or a white line or either a darker gray line or a lighter gray line. A pair of alternating light gray and dark gray lines counts as two lines, just as a pair of alternating black and white lines also counts as two lines. Figure 12-8 is a cropped and close-up picture from a 1956 Electronics Industries Association (EIA) test chart. From the 12 o’clock position, we see three sets of vertical lines starting on the left side from 200 to 400 and on the right side from 400 to 800. The finer-pitched lines in the center or in between these two sets denotes 800 to 1,600. These numbers refer to the number of TV lines for horizontal resolution. Similarly, in the 9 o’clock position, we see three sets of horizontal lines denoting the number of TV lines for vertical resolution.

FIGURE 12-8 Examples of TV or photographic lines in the vertical and horizontal directions.
Now the question is what does it mean that there are X number of lines in the vertical and horizontal directions, and how do we test for this? The answer is that for a monitor or a camera, we use a test pattern with wedges of converging lines in both vertical and horizontal directions (see Figure 12-9).
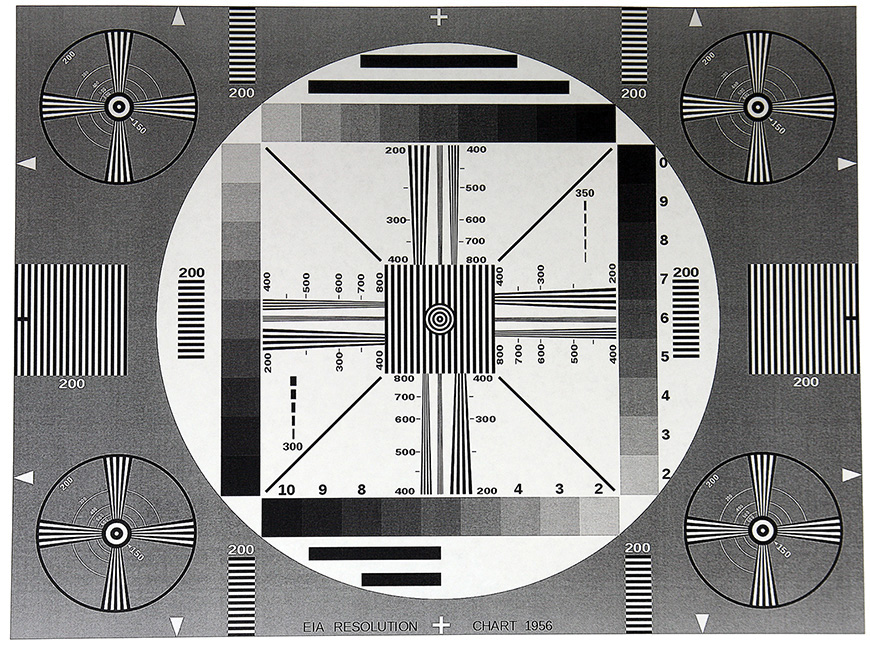
FIGURE 12-9 A TV test pattern for standard-definition TV from the EIA 1956 test resolution chart (http://en.wikipedia.org/wiki/File:EIA_Resolution_Chart_1956.svg).
NOTE The test pattern must be framed in such a manner that the two white triangles on each of the four sides coincide with the outer boundaries for the frame of the picture taken. If the test pattern is zoomed in and overflowing off the frame where only a part of the test pattern is captured, then the resolution measurement will be in error, favoring a higher resolution number. If the test pattern is zoomed out such that the test pattern is smaller within the frame, then the resolution measurement will be in error, favoring a lower resolution number.
To determine the lines of resolution in the vertical and horizontal directions, we look at the converging lines until the lines are merged into gray or the white and black lines are no longer distinguishable (see Figure 12-10). When we determine vertical resolution, we look at the wedge of lines going across the screen, and for measuring horizontal resolution, we examine the wedge of lines going from top to bottom. Where the lines are no longer clearly distinguishable is the resolution.

FIGURE 12-10 Example of determining the number of lines of resolution from a Nikon digital still camera.
For vertical resolution, what is measured in the middle wedge of lines at the 9 o’clock position is about 1,400 lines, which says exactly what one would think. However, when we look at horizontal resolution in the 12 o’clock position, that number is the number of horizontal lines per picture height, which is also approximately 1,400 lines in this example. The actual number of lines across the screen is more because our viewing screens are generally not square (in shape). To determine the number of horizontal lines across the screen, we must multiply the number of horizontal lines resolved by the aspect ratio, which is 4:3 in standard-definition TV displays. For example, if the horizontal resolution from the resolution chart reads 300 lines for a 4:3 aspect ratio screen (e.g., standard-definition TV standard), the actual number of lines that can be resolved across the screen is 300 lines × 4/3 = 400 lines (across the screen for a 4:3 aspect ratio screen).
By rendering with Adobe Photoshop, blur filter has been added in Figure 12-11 to show the effects of lowered resolution. In this example (as seen in Figure 12-11), the resolution has been reduced to about 700 lines vertically and horizontally. At 800 lines and above, all we see is an average gray level.

FIGURE 12-11 Example of lowered resolution.
Aspect Ratio
Given a particular screen or display, the aspect ratio is given by the width divided by the height. For example, for standard-definition TVs (SDTV), the aspect ratio is 1.33:1 = 1.33/1.00 = 1.33, which is generally known as 4:3 = 4/3 = 1.33. This type of display is more on the square side than rectangular (in shape). High-definition TV (HDTV) displays are widescreen and more rectangular and have an aspect ratio of 16:9 = 1.78:1. Figure 12-12 shows examples of standard- and high-definition displays and their associated aspect ratios.

FIGURE 12-12 Aspect ratios from left to right for standard (4:3) and high-definition (16:9) displays.
Another way of determining the aspect ratio is to take the number of pixels across a screen (horizontally displayed pixels) and divide it by the number of pixels up and down the screen (vertically displayed pixels). For example, for standard-definition VGA monitors, the number of horizontal pixels is 640, and the number of vertical pixels is 480. Thus the aspect ratio is 640/480 = 1.33 = 4:3. If we look at HDTV, such as the 1,080-scan-line system, there are 1,920 pixels across and 1,080 pixels up and down for an aspect ratio of 1920/1080 = 1.78 = 16:9.
The next question is, if we have a number of pixels vertically or across a screen, does that automatically determine the number of lines resolved in each of the directions? For example, for the VGA system of 640 by 480 pixels horizontally and vertically, do we actually get 640 lines of resolution across and 480 lines up and down the screen? The answer is no in almost all cases.
The only time the resolution matches the number of lines and pixels in the TV display is when the program material (e.g., TV show) has a scene that lines up perfectly with the pixels of the display. For example, 240 black lines and 240 white lines from the picture being taken are exactly lined up or matched with the pixels or lines in the vertical direction, and similarly, 320 black and 320 white lines are lined up with the horizontal pixels. In practice, this almost never happens. Instead, generally, the lines from the TV program do not align themselves with the pixels on the screen. Figure 12-13 shows the effect of capturing fine detail in one position, while a small shift of the picture results in a different resolution.
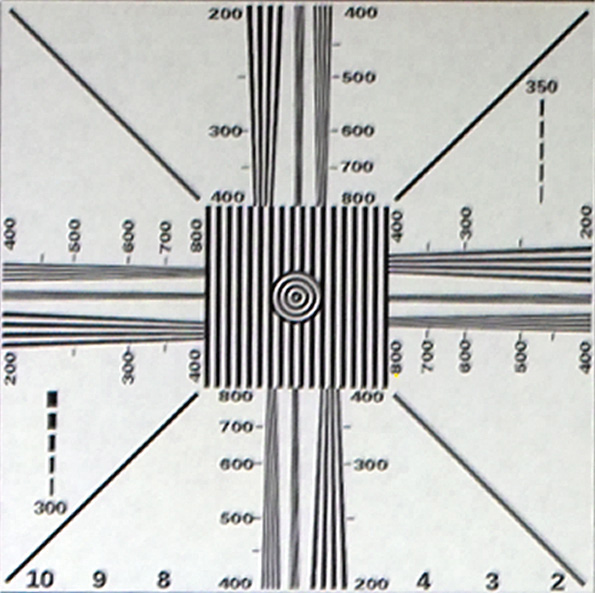
FIGURE 12-13 Test chart taken in the camera in the original position.
In Figure 12-13, note at the 12 o’clock position the 400 to 800 lines; at 500 and 600 lines, the wedge of lines is almost fused into a solid gray with no lines discernible. Now observe in Figure 12-14 the result with a slight change in camera position (shifted) slightly up or down but at the same distance. Notice at the same 12 o’clock position the 400 to 800 lines; for 500 and 600 lines, about 4 wedge lines can be discerned. If one observes the wedges of lines at the 9 o’clock position, Figure 12-13 resolves 500 lines, but Figure 12-14 does not. Thus, depending on how the camera’s sensor aligns with the picture it is taking, the resolution can change.
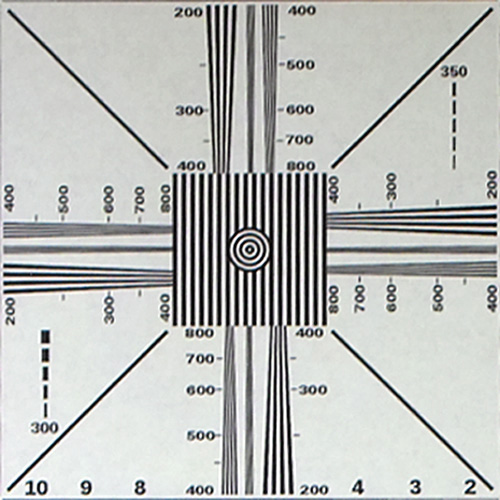
FIGURE 12-14 Test chart taken with the camera shifted in position but at the same distance.
The problem we are seeing is aliasing, and this was especially noticeable for vertical resolution because of the discrete number of TV scanning lines that were used in camera tubes and some of the first solid-state TV camera sensors.
Enter the Kell Factor
When we look at a TV display, all pixels in the vertical direction (up and down) are represented as scanning lines or just rows of picture information. It turns out that by experimentation, in general, the maximum number of lines resolved with a discrete number of displayed or active scanning lines scanned (or number of rows of pixels) is somewhere between 0.65 and 0.8 of the number of scanning lines (or rows of pixels). This number between 0.65 and 0.8 is known as the Kell factor.
In general, the resolution is determined by:
Kell Factor × number of scanning lines or rows displayed
In general, the Kell factor can be taken as 0.7.
Let’s take two examples from standard-definition (480 lines) and high-definition television (1,080 lines). The actual resolutions are
480 lines × 0.7 = 336 lines vertically For SDTV
1,080 lines × 0.7 = 756 lines vertically For HDTV
In the horizontal direction, the number of lines for equal resolution for vertical and horizontal pixels is determined by using the same numbers for the vertical resolution in the following manner for 480 and 1,080 line TV systems, respectively:
336 lines × aspect ratio for SDTV = 336 lines × 4/3 = 448 lines across
756 lines × aspect ratio for HDTV = 756 × 16/9 = 1,344 lines across
The next question would be, do we have to have equal resolution (aka square pixels) along the vertical and horizontal directions? The answer is no. We can actually have more resolution in one direction than the other. This was especially true in the days of CRT (cathode ray tube) displays, where the horizontal resolution could be higher than the vertical resolution by increasing the number of pixels across the screen or by increasing the video bandwidth.
By increasing the number of pixels across the screen in the horizontal direction, a higher-resolution picture not only is perceived by the viewer, but also increased fine detail is provided. For example, in Nikon digital cameras with a 3:2 aspect ratio, the models D1 (2,000 horizontal pixels by 1,312 vertical pixels) and D1X (4,028 horizontal pixels by 1,312 vertical pixels) have the same vertical resolution. However, the D1X has twice as many pixels across, thus yielding about twice the horizontal resolution of the D1 (see www.dpreview.com/reviews/nikond1/19 and www.dpreview.com/reviews/nikond1x/25). Note that although DP Review rates the D1X’s horizontal resolution at 1,650 lines, on close inspection, the resolution is in excess of 2,000 lines, which is about twice the horizontal resolution of the D1 (approximately 1,100 lines of horizontal resolution).
Determining the Number of Scanning Lines Based on Aspect Ratio, Kell Factor, Frame Rate, and Bandwidth
Modern motion pictures, as shown to the general public in the 1930s, projected 24 frames of pictures per second to avoid flickering. Slower frame rates were possible, but the pictures would flicker. Home movies from the 1960s, for example, were made on 8-mm photographic film, which had a frame rate of 16 frames per second. An improved Super 8-mm motion picture system had a frame rate of 18 frames per second. Both these home movie systems suffered from flicker, but they were deemed acceptable to the general public.
In the projection of film, the whole frame is displayed at once. However, in television systems that were created in the mid-twentieth century, the display devices were cathode ray tubes, CRTs. A CRT will display an image by sweeping or tracing out the picture from left to right for each horizontal line. After one horizontal line is displayed, the next line is spaced downward, and that line is traced or drawn.
The display of TV images on a CRT can be thought of as similar to the way a word processor types one line at a time, and at the end of each line, there is a carriage return (e.g., hit “Enter”) to push the cursor one line space down to start the next line of typing. After typing many lines, the lines of information (words) will end on the last line at the bottom of the page, and the word-processing program will continue the document on a new page from the top. In terms of displaying a TV signal on a CRT monitor, the carriage return may be thought of as a horizontal line retrace, and the new page can be thought of as a vertical field or vertical frame retrace.
Now back to the requirement of how many lines do we need to show a TV picture? In essence, the number of lines is determined by how large the CRT is. For most CRT TV sets from the twentieth century, the diagonal dimensions varied from less than 10 inches to as much as about 27 inches. There were 36-inch CRT TV sets, but these were not that common. For small screens (about 20 inches measured diagonally), 480 scanning lines met the requirements for good detail in the TV pictures. Before we look into the 480-line TV system, let’s take a look at a simpler system that uses 240 viewable lines, which some portable devices display in the twenty-first century.
To display a scanned-line system without flicker, it was found that an acceptable rate is about 50 or more frames or fields per second. A frame is considered to be the whole picture, whereas a field is one-half the picture, so it takes two fields in succession to display a frame. TV fields are used in interlaced scanned formats, whereas if there are no interlaced fields but just frames, we are working with a progressively scanned format.
The i in 480i or 576i represents an interlaced format such as NTSC or PAL television standards. The p in 720p represents a progressive scan format for a 720-line HDTV system. We will now discuss further progressive and interlace scanned TV systems.
Let’s take a look at a 240p format with 60 frames per second for a 4:3 (4/3) aspect ratio. If we have a frame rate of 60 frames per second, this means that 240 lines are displayed every 1/60th of a second. This also means that one line takes about (1/60) second × 1/240 = 69.44 μs (μs = μsec = microsecond). If we calculate how many lines of vertical resolution we have, it should be the Kell factor × 240 lines = 0.7 × 240 lines = 168 lines per picture height. The number of lines in the horizontal direction would be 168 lines × 4/3 = 224 lines across.
If we look at a sine-wave signal, on one cycle, the positive peak can represent a bright line, and the negative peak can represent a dark line. Thus one cycle represents two lines. Or put another way, there are two lines to every cycle of the sine wave. Since we have 224 lines across the screen, the number of cycles is 224/2 = 112 cycles.
The question is, if we try to fit 112 cycles into one line period of 69.44 μsec, what is the frequency of the sine wave? Put another way, the relationship is 69.44 μsec/112 cycles = 0.62 μsec/cycle. The period of the sine wave is then 0.62 μsec, or the frequency is then 1/period = 1/0.62 μsec = 1.61 MHz.
In order to display a 240-line progressive scan system at 60 Hz, we need about 1.6 MHz of bandwidth. But can we actually make a TV signal where we just have video information and no other signals … such as signals that tell the monitor when the start of a new horizontal line occurs (e.g., carriage return) or another signal to tell the monitor to scan a new frame or field (e.g., new page)? The answer is no. We need to add timing signals for the monitor to extract such that the monitor knows when a new line and field or frame starts. These signals are called horizontal and vertical synchronizing signals. Even with the synchronizing signals added to the picture information, is there another signal we can add? The answer is yes, and that signal is called the blanking-level pulse, which defines the darkest of the black-level reference for the TV signal.
We now can show what a TV signal looks like in practice. See Figure 12-15.
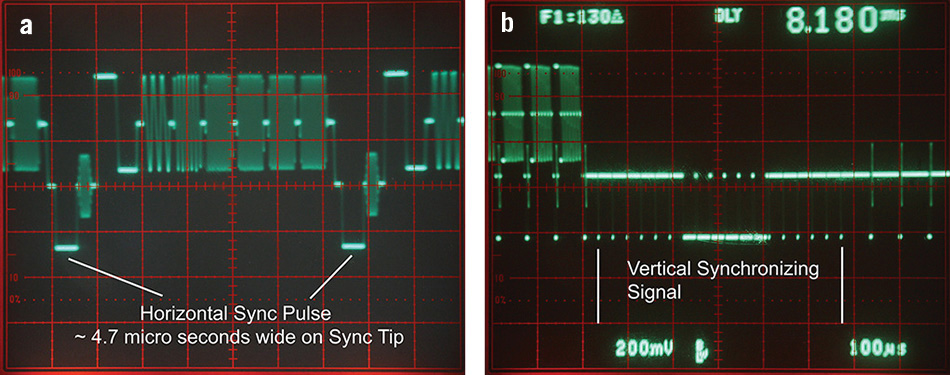
FIGURE 12-15 (a) TV signal with a horizontal sync pulse. (b) TV signal with vertical sync pulses.
After factoring in the horizontal sync pulses, vertical sync pulses, and so on, the video signal can be described in the following manner: One horizontal line has about 63.6 μsec of duration, which has about 11 μsec to include a “front porch” and “back porch” blanking-level reference pulse and a 4.7 μsec horizontal sync pulse. The remaining portion (63.6 – 11) μsec = 52.6 μsec is devoted to the picture information area, such as the luminance values.
NOTE The details of the front porch, back porch, horizontal sync pulse, and other reference signals will be discussed in Chapter 13.
For the total number of lines for the 240p system, we actually have about 262 lines, in which 240 lines display the image, and the other 22 lines are used for the vertical sync signals plus extra data lines that may carry test signals, time code, closed-caption data, and so on.
We now recalculate the required bandwidth to display the 224 lines across the screen, but this time with 53.6 μsec instead of 69.44 μsec. The period of one cycle is then 52.6 μsec/112 cycles = 0.469 μsec, which translates to 1/0.469 μsec = 2.12 MHz (instead of 1.6 MHz). This makes sense—we are squeezing in the same 112 cycles into a smaller period of time. Now back to the standard definition TV (SDTV) signal, which has 480 lines interlaced per frame.
Because we as humans (don’t know about animals) have a retention of a flashed image, known as persistence, it is possible to display one field on odd lines and the succeeding field on even lines to form a TV frame. Two fields make a frame, and each field has a half-line offset (equivalent to a vertically half-pitch offset) from each other. Each field (odd field and even field) has 262.5 lines. Because two TV fields fill in to complete one TV frame, there are 2 × 262.5 lines = 525 lines—a number many in the TV field are familiar with. So when we talk about 480i, we are really relating to a 525-line TV system.
The TV fields are refreshed at a rate of roughly 1/60th of second. One TV frame is then displayed in two TV field’s time = 2 × 1/60th second = 1/30th second = period of one TV frame. Although the frame rate is 1/30th of a second, one may think that there would be a flicker problem. Fortunately, because the TV fields are almost the same except for a half-vertical-pitch offset, the human eyes see the displayed image as something that is refreshing at 1/60th of a second, and thus flicker is not noticed for the most part.
With 480 displayed lines per frame, and using a Kell factor of 0.7, the number vertical of lines we can resolve is 0.7 × 480 lines = 336 lines. The number of horizontal lines across the screen with a 4:3 aspect ratio is then 336 lines × 4/3 = 448 lines. Note that 448 lines can be represented by 224 cycles—recall that a cycle of a sine wave is equivalent to two lines, a light line and a dark line.
With 525 lines within 1/30th second each, horizontal line can be calculated as:
525 lines/(1/30th second)
which, when the numerator and denominator are divided by 525, gives us:
1 line/[(1/30th second)(525)] = 1 line per 63.5 μsec.
To figure out the bandwidth required, let’s assume that the front porch, back porch, and sync areas take up in total about 10.9 μsec, which leaves (63.5 μsec – 10.9 μsec) = 52.6 μsec. We need to fit 224 cycles of sine wave into 52.6 μsec. This yields 224 cycles/52.6 μsec, which equals 1 cycle/0.2348 μsec, which implies a frequency = 1/0.2348 μsec = 4.26 MHz for a 480i TV system. Note that 4.26 MHz ≈ 2 × 2.12 MHz, or twice the bandwidth requirement for 240p.
As we can see with doubling the number of lines via an interlaced system of 480 lines, we need twice the bandwidth of a progressive scan 240-line system to ensure twice the resolution both vertically and horizontally. But why not just go to a 60-frame-per-second 480-line progressive scan system and not deal with interlacing two fields? Let’s see what happens in terms of the bandwidth.
We will need to have 525 lines in the period of 1/60th of a second for a progressive scan system versus 1/30th of a second for the interlaced system. Note that (1/60) second = (½) of (1/30th) second. This means that the period of one horizontal line in the progressive format is half the period of the horizontal line period in the interlaced system. That is, one horizontal line = (½)63.5 μsec = 31.75 μsec for a 525-line progressive scan TV signal. If we allocate 5.5 μsec (half of 11 μsec) for the front porch, back porch, and horizontal sync, we are left with 26.25 μsec for the picture area. We still need to fit in 448 lines across the screen or, equivalently, 224 cycles of sine wave.
Therefore, we have 224 cycles/26.25 μsec = 1 cycle/0.1172 μsec. This translates to an 8.53-MHz (1/0.1172 μsec) sine wave, or roughly twice the frequency or bandwidth of the 4.26 MHz required for the interlaced system for the same number of scanning lines.
The penalty for going with a progressive scan is that it takes more bandwidth. The advantage of progressive over interlaced scanning is that for movements in the TV program, the interlaced system can show artifacts, usually a zigzag rendition of a moving object from one field to another. However, the progressive scan version will show no motional artifacts. For the most part, the interlaced version works fine, and its motional artifacts are not that noticeable.
Sharpness and Frequency Response
Traditionally, the sharpness control enhanced the frequency response of the video signal, that is, the pixel information that is formatted in a horizontal line as a signal is processed to have a high-frequency boost. In inexpensive TV monitors, this enhancement provided an asymmetrical edge enhancement to the image via a single resistor-capacitor network. That is, there are overshoots only. Most TV sets used this type of sharpness control to provide a single-edge enhancement to a pulse waveform. However, some TV receivers did employ symmetrical-edge sharpness enhancement (e.g., a Zenith 23-inch black-and-white vacuum-tube TV set). However, there is also another way to add sharpness to the video signal via a phase linear high-frequency boost that leads to symmetrical edge enhancement.
Batman’s Ears to the Rescue for Image Enhancement
If one uses two RC circuits or the equivalent of cascading two high-pass filters and combining the output with the original input, a phase linear high-frequency boost is achieved. The result to a pulse is something that looks like Batman’s ears (see Figure 12-16, bottom figure).

FIGURE 12-16 Effects on a pulse with single edge and phase linear double-edge enhancement. Note: A’ and B’ look like Batman’s ears.
Here you can see single-edge overshoots denoted by A and B and phase linear preshoots denoted by A” and B’ along with overshoots A’ and B”.
In Figure 12-16, the top pulse is the input waveform that is unaltered by edge enhancement. The middle pulse has a single-edge sharpness enhancement applied to the input waveform. Areas A and B denote a white-level overshoot and black-level overshoot, respectively. Finally, the bottom waveform uses a phase linear approach to add edge enhancement to the input waveform. The phase linear edge-enhancement technique includes white and black overshoots A” and B” (just like the single-edge-enhanced signal), but additionally there are preshoot signals A’ and B’ to further highlight and outline the pulse. One observation: don’t the pointy peaks formed by A” and B’ look like “Batman’s ears? Hmm, “How right you are old chum!” Figure 12-17a shows the original image and Figure 12-17b illustrates both single-edge and phase linear (double edge) enhancement techniques.
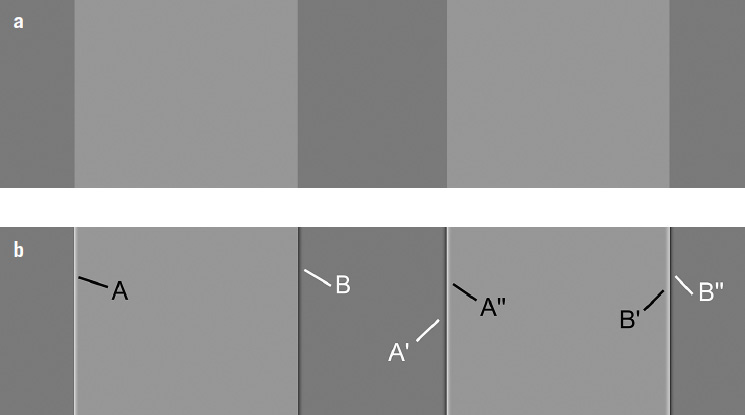
FIGURE 12-17 (a) Two light gray “boxes” without edge enhancement. (b) Single-edge enhancement shown on the “box” on the left, and phase linear edge enhancement shown on the “box” on the right.
As seen on the left in the light gray box in Figure 12-17b, there are only either white (A) or black (B) lines to highlight the edges. However, in the light gray box on the right, there are both white (A’ and B’) and black (A’ and B”) lines to highlight the edges. Figure 12-18 shows example circuits that implement single-edge sharpness enhancement to a video signal.
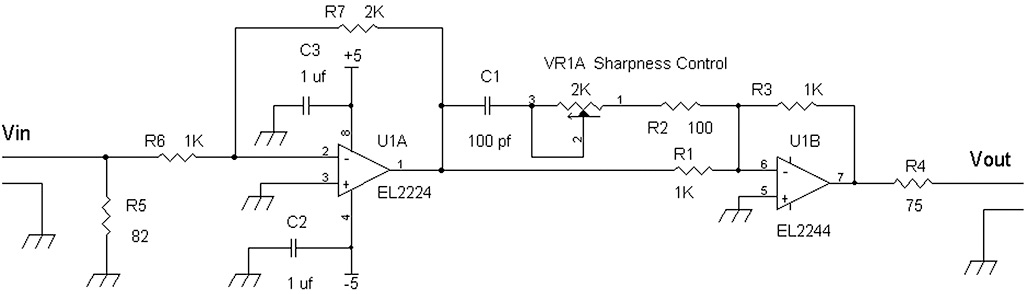
FIGURE 12-18 Example single-edge sharpness control circuit using C1 and VR1/R2 for the RC filter.
U1A is an inverting-gain amplifier that feeds the video signal to R1, an input resistor for the second inverting amplifying stage U1B. A high-frequency boost is provided by having C1, VR1A, and R2 couple high-frequency signals into U1B. The combination of the two signals from C1 and R1 allows the video signal to provide a single-edge sharpness enhancement. A phase linear sharpness control is shown in Figure 12-19, which uses a more elaborate RC high-pass filter.

FIGURE 12-19 A phase linear sharpness control using R1, C1, R2, and C2 for an RC filter.
A phase linear sharpness control can be implemented in other ways by using an inductor-capacitor network or by a tapped delay line. In Figure 12-19, a double high-pass filter circuit formed by C1, R1, C2, and R2 provides a +12 dB/octave slope high-frequency signal to the (+) input of U1B instead of the (–) input and R4. The reason why is that each high-pass filter section C1 and R1 or C2 and R2 provides a 90-degree phase shift. So cascading two of these sections provides 2 × 90 degrees = 180 degrees of phase shift, and therefore, the high-frequency boosted signal has to have its phase reversed via coupling the signal from R2 into the (+) input terminal of U1B. The boosted high-frequency signal via R2 is in phase with the video signal into R4 and provides the double-edge sharpness enhancement.
So why is phase linear image enhancement better than the simple RC filter type of image enhancement? The simple RC filter (i.e., high-pass filter plus original signal) proves a pulse waveform with only overshoots. This only provides a superwhite or supergray level at the edge transition of the pulse,
However, a phase linear sharpness control (original signal – double RC high-pass filter) has both undershoots and overshoots on the pulse waveform. What this does is provide a superblack level preceding the pulse’s edge at A’ and a superwhite level immediately after the edge at A”. Also, there is a superwhite level preceding the light gray to dark gray transition at B’ followed by the superblack level at B”. In essence, a phase linear sharpness control adds a halo of both white and black outlines at the transition from one gray level to another (see Figure 12-17b again).
Sharpness enhancement performs two duties. The first is that it can compensate for loss of high-frequency response (e.g., caused by the diameter of the electron beam that scans across a cathode ray tube) to restore fine-detail resolution. The second is that it can further add a boost at high frequencies for edge enhancement that leads to a crisper-looking picture. Generally, the boost starts at about one-third or one-half the maximum bandwidth of the video signal. For example, an NTSC or standard-definition signal has about a 4.2 MHz of bandwidth, so the boost will start anywhere between 1.4 MHz and 2.1 MHz with a rising frequency response up to 4.2 MHz or beyond.
Some Color TV Basics
If we take three primary colors—red, green, and blue—a combination of the three colors can give us virtually any other color, such as violet, brown, yellow, turquoise, and so on and any shade gray (neutral color). In the capture of color pictures, usually three sensors are required. The simplest may just be having each a red, a green, and a blue sensor. Other combinations are possible, such as a luminance sensor with red and blue sensors.
For color TV during the post analog TV era, there are typically three color TV signals—the luminance (Y), the red color difference (R-Y) signal Pr, and the blue color difference (B-Y) channel Pb, where R = red channel, B = blue channel, and Y = luminance or black-and-white channel. The luminance channel Y represents black-and-white information and can be expressed as the combination of the primary colors red, green, and blue:
![]()
where G = green channel’s signal, R = red channel’s signal, and B = blue channel’s signal.
By algebraic “magic” or “grinding,” we can eventually derive that the color-difference green channel is a linear combination of (R-Y) and (B-Y), which results in the following equation:
![]()
Recall that the output of a Blu-ray, DVD, or computer monitor occurs in the form of Y, (R-Y) = Pr, and (B-Y) = Pb, and we can extract R, G, and B from these three signals, as shown in Figure 12-20.

FIGURE 12-20 Recovering red (R), green (G), and blue (B) signals via Y, (R-Y) = Pr, and (B-Y) = Pb.
In terms encoding an S-video (Y-C signals) or composite video signal (CVBS), we modulate the Pr and Pb signals at a color subcarrier frequency with a cosine wave and a sine wave. For an S-video or composite analog color TV signal, the modulated Pr and Pb signals form the chroma or C channel.
The Pr and Pb signals are modulated with an in-phase carrier signal (cosine signal) and a quadrature-phase (sine signal) carrier signal at frequencies at about 3.579545MHz (NTSC, National Television System Committee) or 4.433619 MHz (PAL, phase alternate line subcarrier). Other analog standards, such as SECAM (sequential color with memory) and variants of PAL such as PAL-M, PAL-N, etc. still are based on modulating the Pr and Pb channels in some manner. Figure 12-21 show encoding of Y, Pr, and Pb into S-video and composite (CVBS) color TV signals using quadrature phase and amplitude modulation.
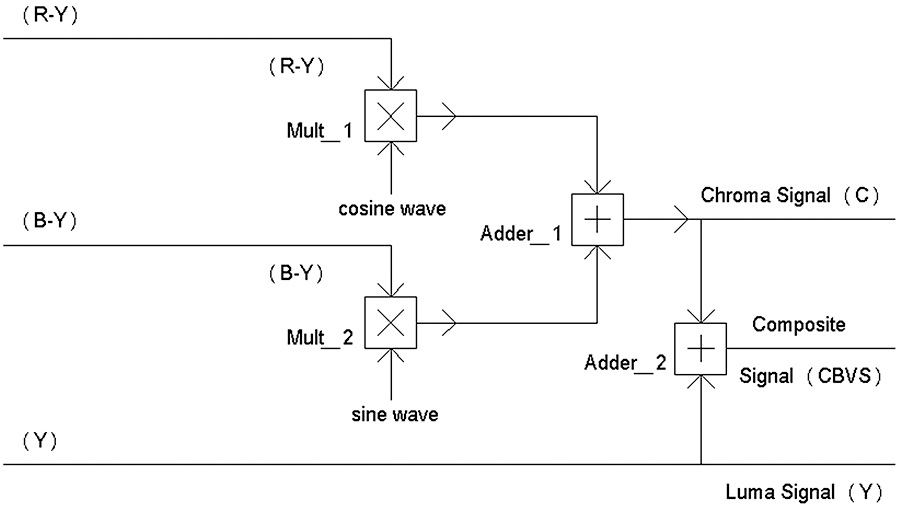
FIGURE 12-21 An example of encoding Y, Pr, and Pb signals into an S-video and a composite color TV signal.
As illustrated in Figure 12-21, the Pr = (R-Y) and Pb = (B-Y) signals are modulated or multiplied by 0- and 90-degree signals via Mult_1 and Mult_2. Cosine is defined as a 0-degree phase reference, and sine is defined as a 90-degree phase reference to perform I and Q AM modulation. In essence, the chroma signal is a quadrature AM signal at frequencies such as 3.579545 MHz (NTSC) or 4.433619 MHz (PAL). Not shown in Figure 12-21 are the low-pass filters that usually filter the outputs of each multiplier.
The choice of selecting such odd frequencies for the subcarrier modulation such as 3.79545 MHz or 4.433619 MHz is not a fluke. These frequencies were chosen specifically to display in a compatible manner with a monochrome or black-and-white-only TV monitors. When the chroma signal is present in a scene, this produces varying amplitudes and phases of the modulated subcarrier signal such that there is a dithered effect from one horizontal line to the next. In an NTSC color signal, the color frequency is chosen to have 227.5 cycles of subcarrier per line. This means that the adjacent TV lines will display the color subcarrier signal in a checkerboard pattern on a black-and-white monitor.
This checkerboard pattern of dots displayed on a black-and-white TV set is much less objectionable than if the color frequency is chosen to have an even number of subcarrier signal cycles per horizontal line. If the color subcarrier frequency is chosen to have an even number of cycles per horizontal line, we would see thin stripes up and down the screen. It would put all the actors and actresses from a TV show “behind bars” all the time when the scene has color.
References
1. K. Blair Benson and Jerry Whitaker, Television Engineering Handbook. New York: McGraw-Hill, 1992.
2. Howard W. Sams, Color TV Training Manual, 4th ed. Indianapolis: Howard W. Sams Co., Inc., 1977.
3. Howard W. Coleman, ed., Color Television: The Business of Colorcasting. New York: Hastings House, 1968.
4. Batman, TV series, 1966–1968.
5. “1956 EIA Resolution Test Chart”; available at: http://en.wikipedia.org/wiki/File:EIA_Resolution_Chart_1956.svg.