
46
Energy Storage
Power Electronics and Energy Research (PEER) Group, P. D. Ziogas Power Electronics Laboratory, Department of Electrical and Computer Engineering, Concordia University, Montreal, Quebec, Canada
Srdjan Lukic
Department of Electrical and Computer Engineering, North Carolina State University, Raleigh, North Carolina, USA
Universite de Technologie de Belfort-Montbeliard, Belfort Cedex, France
46.1 Introduction
46.2.1 Battery Storage
46.2.2 Ultracapacitor (UC)
46.2.3 Flow Batteries and Regenerative Fuel Cells (RFC)
46.2.4 Fuel Cells (FC)
46.3 Modeling of Energy Storage Devices
46.3.1 Battery Modeling
46.3.2 Electrical Modeling of Fuel Cell Power Sources
46.3.3 Electrical Modeling of Photovoltaic (PV) Cells
46.3.4 Electrical Modeling of Ultracapacitors (UCs)
46.3.5 Electrical Modeling of Flywheel Energy Storage Systems (FESS)
46.4 Hybridization of Energy Storage Systems
46.5 Energy Management and Control Strategies
46.5.1 Battery State Monitoring
46.5.2 Cell Balancing
46.6 Power Electronics for Energy Storage Systems
46.6.1 Advantages and Disadvantages of Li-Ion Battery Packs for HEV/PHEV Applications
46.6.2 Operational Characteristics of Classic and Advanced Power Electronic Cell Voltage Equalizers
46.7.1 Hybrid Electric and Plug-in Hybrid Electric Vehicles (HEV/PHEV)
46.7.2 Fuel Cells for Automotive and Renewable Energy Applications
46.8 Conclusions
46.1 Introduction
It is well known that energy storage devices provide additional advantages to improve stability, power quality, and reliability of the power-supply source. The major types of storage devices being considered today include batteries, ultracapacitors, and flywheel energy systems, which will be discussed in detail in this chapter. It is empirical that precise storage device models are created and simulated for several applications, such as hybrid electric vehicles (HEV) and various power system applications.
The performances of batteries, ultracapacitors, and flywheels have, over the years, been predicted through many different mathematical models. Some of the important factors that need to be considered while modeling various energy storage devices include storage capacity, rate of charge/discharge, temperature, and shelf life.
The electrical models of two of the most promising renewable energy sources, namely fuel cells and PV cells, are also described in this chapter. They are now being studied widely as they do not produce much emission and are considered to be environment friendly. However, these renewable energy sources are large, complex, and expensive at the same time.
Hence, designing and building new prototypes is a difficult and expensive affair. A suitable solution to overcome this problem is to carry out detailed simulations on accurately modeled devices. This chapter discusses the various equivalent electrical models for fuel cells and PV arrays and analyzes their suitability for operation at system levels.
46.2 Energy Storage Elements
46.2.1 Battery Storage
46.2.1.1 Lead Acid Batteries
The use of lead acid batteries for energy storage dates back to mid-1800s for lighting application in railroad cars. Battery technology is still prevalent in cost-sensitive applications where low-energy density and limited cycle life are not an issue but ruggedness and abuse tolerance are required. Such applications include automotive starting lighting and ignition (SLI) and battery-powered uninterruptable power supplies (UPS).
Lead acid battery cell consists of spongy lead as the negative active material, lead dioxide as the positive active material, immersed in diluted sulfuric acid electrolyte, with lead as the current collector:
During discharge, PbSO4 is produced on both negative and positive electrodes. If the batteries are overdischarged or are kept at a discharged state, the sulfate crystals become larger and are more difficult to break up during charge. In addition, the large size of lead sulfate crystals leads to active material disjoining from the plates.
Due to the production of hydrogen at the positive electrode, lead acid batteries suffer from water loss during overcharge. To deal with this problem, distilled water may be added to the battery as is typically done for flooded lead acid batteries. Also, maintenance-free versions are available to deal with this problem whereby inserting a valve keeps the gasses within the battery and minimizes water loss by recombination.
Current collectors in lead acid batteries are made of lead, leading to the low-energy density. In addition, lead is prone to corrosion when exposed to the sulfuric acid electrolyte. SLI applications make use of flat-plate grid designs as the current collectors, whereas more advanced batteries use tubular designs. Recent advances aim to replace lead with lighter materials, such as carbon, to reduce the system weight.
46.2.1.2 Nickel-Cadmium (Ni-Cd) and Nickel-Metal Hydride (Ni-MH) Batteries
Nickel-cadmium (Ni-Cd) batteries were the chemistry of choice for a wide range of high-performance applications between 1970 and 1990. Recently, they were replaced by lithium-ion (Li-ion) and nickel-metal hydride (Ni-MH) chemistries in most applications. The Ni-Cd battery uses nickel oxyhydroxide for the positive electrode and metallic cadmium for the negative electrode. The chemical reaction is as follows:
As can be seen from this chemical reaction, there is a balance of reactions that implies that the electrolyte is always of the same concentration. This leads to relatively constant performance during discharge. In addition, the balance of reactions leads to very good overcharge characteristics where the additional power is used up as heat rather than water loss.
Ni-Cd batteries have a higher energy density and longer cycle life than lead acid batteries, but are inferior to chemistries such as Li ion and Ni-MH, that are also becoming cheaper than Ni-Cd batteries. Other disadvantages of using Ni-Cd batteries compared to Ni-MH include shorter cycle life, more pronounced “memory effect,” toxicity of cadmium requiring complex recycling procedure, and lower energy density. Moreover, a flat discharge curve and negative temperature coefficient may cause thermal runaway in voltage-controlled charging.
For the aforementioned reasons, in the recent past, Ni-MH batteries have gained prominence over Ni-Cd batteries. The Ni-MH batteries use nickel oxyhydroxide for the positive electrode and metallic cadmium for the negative electrode. The chemical reaction is as follows:
Here, M stands for the metallic group. At the negative electrode, hydrogen is released from the metal to which it was temporarily attached, and reacts, producing water and electrons. Note that the reaction at the negative electrode is similar to that of a fuel cell, which will be discussed later in this chapter.
Ni-MH batteries have been the chemistry of choice for electric and hybrid electric vehicle (EV and HEV) applications in the 1990s and 2000s, respectively, due to their relatively high power density, proven safety, good abuse tolerance, and very long life at a partial state of charge. One of the disadvantages is the relatively high self-discharge rate, though the introduction of novel separators has mitigated this problem.
When overcharged, Ni-MH batteries use excess energy used to split and recombine water. Therefore, the batteries are maintenance free. However, if the batteries are charged at an excessively high charge rate, hydrogen gas buildup can cause the cell to rupture. If the battery is overdischarged, the cell can be reverse-polarized, thus reducing the battery capacity.
46.2.1.3 Lithium-Ion (Li-Ion) Batteries
Due to their high specific energy and the potential to be produced at low cost, Li-ion batteries are expected to widely replace Ni-MH batteries for future electric propulsion applications. The Li-ion battery consists of oxidized cobalt material on the positive electrode, carbon on the negative electrode, and lithium salt in an organic solvent as the electrolyte. Even though the widespread use of this chemistry is fairly novel, it is interesting to note that the processes in the battery are fairly simple to model compared to other chemistries.
Li-ion batteries have been instrumental in increasing the performance standards of batteries, and more recently, even in predicting battery deterioration. The promising aspects of lithium-based battery chemistries include low memory effect, high specific energy of nearly 100 Wh/kg, high specific power of 300 W/kg, and battery life of at least 1000 cycles. The key barriers include calendar life, cost, operation at temperature extremes, and abuse tolerance. A breakthrough in the development of advanced electrodes is needed to further increase the specific energy [1]. The characteristics of some of the major battery chemistries being considered for propulsion, storage, and renewable energy systems are enlisted in Table 46.1.
TABLE 46.1 Summary of major battery chemistries and their characteristics [2–4]

This chapter will later discuss the major advantages and disadvantages of the various battery chemistries, especially those of Li-ion batteries, in detail. Major power-electronics-based solutions to overcome electrochemical-related barriers for batteries will also be discussed later in this chapter.
46.2.2 Ultracapacitor (UC)
Electrochemical double-layer capacitors (EDLCs) or ultracapacitors (UCs) work in much the same way as regular capacitors, in that there is no ionic or electronic transfer, resulting in a chemical reaction (there is no Faradic process). In other words, energy is stored in the electrochemical capacitor by simple charge separation. Therefore, the energy stored in the electrochemical capacitor can be calculated using the same well-known equation that is used for conventional capacitors:
![]()
As for the conventional capacitor, the capacitance, C, is proportional to the area, A, of the plates, the permittivity of the dielectric, ϵ, and inversely proportional to the distance, d, between the plates. In general, UCs are designed to have a very high electrode surface area and use high-permittivity dielectric while keeping the current collectors very close. Therefore, UCs attain very high capacitance ratings (kilo-Farads versus milli- and micro-Farads for conventional capacitors). This is achieved by using porous carbon as the current collector rather than metallic strips. The porous carbon collector exhibits a very large surface area, allowing a relatively large amount of energy to be stored at the collector surface. The two electrodes are separated by a very thin porous separator and immersed in an electrolyte, such as propylene carbonate. Due to the high permeability and close proximity of the electrodes, UCs have a low voltage withstand capability (typically 2.5 V).
Currently, there exist five UC technologies in development: carbon/metal fiber composites, foamed (aerogel) carbon, carbon particulate with a binder, doped conducting polymer films on carbon cloth, and mixed metal oxide coatings on metal foil. Current trends indicate that higher energy densities are achievable with a carbon composite electrode, using an organic electrolyte, rather than carbon/metal fiber composite electrode devices, with an aqueous electrolyte.
As described earlier, a UC stores energy by physically separating unlike charges. This has profound implications on cycle life, efficiency, energy, and power density. It must be noted that, typically, a UC depicts long cycle life due to the fact that (ideally) there exist no chemical changes on the electrodes, under normal operation. Furthermore, overall efficiency is superior; it is only a function of the ohmic resistance of the conducting path. In addition, power density is exceptional because the charges are physically stored on the electrodes. Conversely, energy density is low because the electrons are not bound by chemical reactions. This lack of chemical bonding also implies that the UC can be completely discharged, leading to larger voltage swings as a function of the state of charge (SOC).
46.2.3 Flow Batteries and Regenerative Fuel Cells (RFC)
Flow batteries, also called redox (reduction-oxidation) batteries, comprise two electrolytes, separated by ion or proton exchange membrane. Energy can be stored in the electrolytes by increasing the potential difference between the two liquids –in other words, by oxidising one and reducing the other. Alternatively, electricity can be produced by reversing the process. The oxidation/reduction process is performed by the proton exchange membrane.
Flow batteries have a number of advantages, such as easy scalability (capacity proportional to tank size, whereas power output is proportional to PEM surface area), no detrimental effects of a deep discharge, very low self-discharge, low cost for a large system compared to batteries, and long cycle life. In contrast, the energy and power densities are quite low and the system is complex, requiring pumps and plumbing to circulate the electrolyte through the membrane. Therefore, this technology has found commercial application only for large-scale storage such as utility applications [3, 4].
Three types of flow batteries have shown commercial promise: vanadium redox, polysulfide bromide, and zinc bromide. Vanadium redox has the added advantage of using the same material for both electrolytes, removing the threat of cross-contamination through the PEM. Polysulfide bromide and zinc bromide use bromide, presenting the threat of releasing the highly toxic bromine gas [4].
Regenerative fuel cells (or unitized regenerative fuel cells) are sometimes grouped in with flow batteries, as the power-producing process is quite similar. Fuel cells consume hydrogen and oxygen to produce water and electricity. Unitized regenerative fuel cells are also able to function to separate water back into hydrogen and oxygen. The hydrogen is then stored as hydrogen gas or as methanol for future use, to generate electricity. Current research aims to use PEM-type fuel cells, with hydrogen or methanol as the main storage. The issue is to design a system that is efficient in both directions –in fact, current unitized fuel cells are less efficient in hydrogen production than other methods, such as conventional electrolysis.
46.2.4 Fuel Cells (FC)
A fuel cell is typically similar in operation to a conventional battery, although it has some distinct physical differences. Primarily, a fuel cell is an electrochemical device wherein the chemical energy of a fuel is converted directly into electric power [5]. The main difference between a conventional battery and a fuel cell is that, unlike a battery, a fuel cell is supplied with reactants externally. As a result, whereas a battery is discharged, a fuel cell never faces such a problem as long as the supply of fuel is provided. As depicted in Fig. 46.1, electrodes and electrolyte are the main parts of a fuel cell. The most popular type of fuel cell is the hydrogen-oxygen fuel cell.
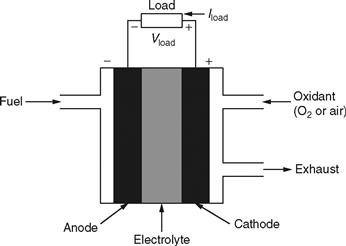
FIGURE 46.1 Typical diagram of a fuel cell.
As shown in Fig. 46.1, hydrogen is used as the fuel to be fed to the anode. The cathode, in contrast, is fed with oxygen, which may be acquired from air. The hydrogen atom is split up into protons and electrons, which follow different paths, but ultimately meet at the cathode. For the splitting-up process, we need to use a suitable catalyst. The protons take up the path through the electrolyte, whereas the electrons follow a different external path of their own. This, in turn, facilitates a flow of current, which can be used to supply an external electric load. The electrode reactions are given as follows:
Anode:2H2 → 4H+ + 4e−
Cathode: O2 + 4e− → 2O2−
Overall reaction: 2H2 + O2 → 2H2O
From these simple and basic expressions describing the operation of a typical fuel cell, it is clear that there exists no combustion and hence no production of emissions. This makes the fuel cell environmentally suitable.
A typical i –v curve of fuel cells is shown in Fig. 46.2. The output voltage decreases as the current increases. Moreover, the efficiency of a fuel cell is defined as the ratio of electrical energy generated to the input hydrogen energy. Generally, cell efficiency increases with higher operating temperature and pressure [5].
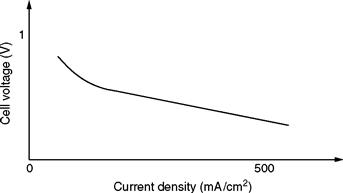
FIGURE 46.2 Typical i –v curve of a fuel cell.
Fuel cells have many favorable characteristics for energy conversion. As explained earlier, they are environmentally acceptable due to a reduced value of carbon dioxide (CO2) emission for a given power output. Moreover, the usage of fuel cells reduces transmission losses, resulting in higher efficiency.
Typical values of efficiency range between 40 and 85%. Another advantage of fuel cells is their modularity. They are inherently modular, which means they can be configured to operate with a wide range of outputs, from 0 to 50 MW, for natural gas fuel cells, to 100 MW or more, for coal gas fuel cells. Another unique advantage of fuel cells is that hydrogen, which is the basic fuel used, is easily acquirable from natural gas, coal gas, methanol, and other similar fuels containing hydrocarbons. Finally, the waste heat/exhaust can be utilized for cogeneration and for heating and cooling purposes. This exhaust is useful in residential, commercial, and industrial cogeneration applications. Basically, for cogeneration, the fuel cell exhaust is used to feed a mini- or a microturbine generator unit. These turbines are generally gas turbines. Because the waste thermal energy is recovered and converted into additional electrical energy, the overall system efficiency is improved. The gas turbine fulfills this role suitably. The typical sizes of such systems range from 1 to 15 MW.
46.3 Modeling of Energy Storage Devices
46.3.1 Battery Modeling
As mentioned earlier, precise battery models are required for several applications such as for the simulation of energy consumption of electric vehicles, portable devices, or for power system applications. The major challenge in modeling a battery source is the nonlinear characteristic of the equivalent circuit parameters, which require lengthy experimental and numerical procedures. The battery itself has some internal parameters, which need to be taken care of [6]. In this section, three basic types of battery models will be presented: ideal, linear, and Thevenin. Finally, a simple lead acid battery model for traction applications that can be simulated in a CAD software will also be presented.
46.3.1.1 Ideal Model
The ideal model of a battery basically ignores the internal parameters and, hence, is very simple. Figure 46.3a depicts an ideal model of a battery, wherein it is clear that the model is primarily made up of only a voltage source [6].
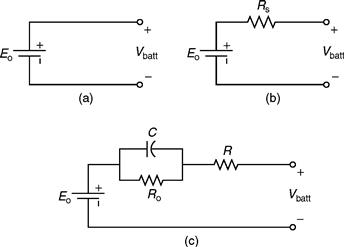
FIGURE 46.3 Battery models: (a) ideal model, (b) linear model, and (c) Thevenin model.
46.3.1.2 Linear Model
This is by far the most commonly used battery model. As is clear from Fig. 46.3b, this model consists of an ideal battery with open-circuit voltage, Eo, and an equivalent series resistance, RS [6]. “Vbatt” represents the terminal voltage of the battery. This terminal voltage can be obtained from the open-circuit tests as well as from load tests conducted on a fully charged battery.
Although this model is quite widely used, it still does not consider the varying characteristics of the internal impedance of the battery with the varying state of charge (SOC) and electrolyte concentration.
46.3.1.3 Thevenin Model
This model consists of electrical values of the open-circuit voltage (Eo), internal resistance (R), capacitance (C), and the over-voltage resistance (Ro) [6]. As observed in Fig. 46.3c, capacitor C depicts the capacitance of the parallel plates and resistor Ro depicts the nonlinear resistance offered by the plate to the electrolyte.
In this model, all the elements are assumed to be constants. However, in reality, they depend on the battery conditions. Thus, this model is also not the most accurate, but is the most widely used. In this view, a new approach to evaluate batteries is introduced. The modified model is based on operation over a range of load combinations. The electrical equivalent of the proposed model is depicted in Fig. 46.4. As is clear from Fig. 46.4, the main circuit model consists of the following five subcircuits:
1. Ebatt: This is a simple dc voltage source designating the voltage in the battery cells.
2. Epol : It represents the polarization effects due to the availability of active material in the battery.
3. Etemp: It represents the effect of temperature on the battery terminal voltage.
4. Rbatt: This is the battery's internal impedance, the value of which depends primarily on the relationship between cell voltage and state of charge (SOC) of the battery.
5. Vsens: This is a voltage source, with a value of 0 V. It is used to record the value of battery current.
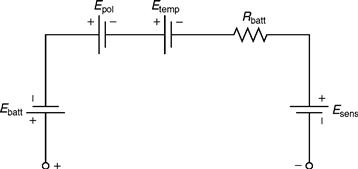
FIGURE 46.4 Main circuit representation of a modified battery model.
Thus, this model is capable of dealing with various modes of charge/discharge. It is comparatively more precise and can be extended for use with Ni-Cd and Li-ion batteries, which could be applied to hybrid electric vehicles and other traction applications. Only a few modifications need to be carried out in order to vary the parameters such as load state, current density, and temperature [6].
46.3.2 Electrical Modeling of Fuel Cell Power Sources
Over the past few years, there have been great environmental concerns shown with respect to emissions from vehicles. These concerns, along with the recent developments in fuel cell technology, have made room for the hugely anticipated fuel cell market [6]. Fuel cells are today being considered for applications in hybrid electric vehicles, portable applications, renewable power sources for distributed generation applications, and other similar areas where the emission levels need to be kept to a minimum.
The proton exchange membrane (PEM) fuel cell has the potential of becoming the primary power source for HEVs utilizing fuel cells. However, such fuel cell systems are large and complex and, hence, need accurate models to estimate the auxiliary power systems required for use in the HEV. In this section, the fuel cell modeling techniques will be highlighted, thus avoiding the need to build huge and expensive prototypes. To have a clearer picture, refer to Fig. 46.5, which shows the schematic of a fuel cell/battery hybrid power system.
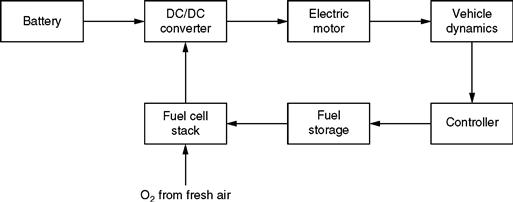
FIGURE 46.5 Schematic of a fuel cell/battery hybrid power system.
The battery pack in Fig. 46.5 is used to compensate for the slow start-up and transient response of the fuel processor [6]. Furthermore, the battery can also be used for the purpose of regenerative braking in the HEV.
As mentioned previously, because fuel cell systems are large, complex, and expensive, designing and building new prototypes is difficult. Hence, the feasible alternative is to model the system and examine it through simulations. The fuel cell power system consists of a reformer, a fuel cell stack, and a dc/dc (buck/boost) or dc/ac power converter. The final output from the power electronic converter is in the required dc or ac form acquired from the low-voltage dc output from the fuel cell stack. An electrical equivalent model of a fuel cell power system is discussed here, which can be easily simulated using a computer simulation software.
In the electrical equivalent model, a first-order time-delay circuit with a relatively long time-constant can represent the fuel reformer. Similarly, the fuel cell stack can also be represented by a first-order time-delay circuit, but with a shorter time constant. Thus, the mathematical model of the reformer and stack is represented as:
Here, Rr Cr = τr is the time constant of the reformer and Rs Cs = τr is the time constant of the fuel cell stack. The equivalent circuit is shown in Fig. 46.6.
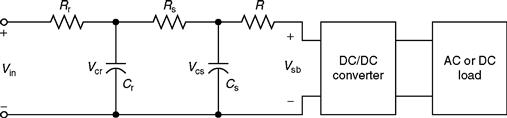
FIGURE 46.6 Equivalent circuit model of a fuel cell power system.
By simulating the equivalent circuit of Fig. 46.6, the system operation characteristics can be investigated. In order to achieve a fast system response, the dc/dc or dc/ac converter can utilize its short time constant for control purposes. However, eventually the fuel has to be controlled despite its long time-delay [6]. The inputs to the chemical model of a fuel cell include mass flows of air (O2) and hydrogen (H2), cooling water, relative humidity of oxygen and hydrogen, and load resistance. The outputs from the chemical model include temperature of the cell, power loss, internal resistance, heat output, efficiency, voltage, and total power output. Generally, in case of excess of hydrogen supply, it is recirculated in order to avoid any wastage.
46.3.3 Electrical Modeling of Photovoltaic (PV) Cells
As mentioned earlier, photovoltaic systems have been studied widely as a renewable energy source, because not only are they environment friendly, but they also have infinite energy available from the sun. Although the PV systems have the above-mentioned advantages, their study involves precise management of factors such as solar irradiation and surface temperature of the PV cell [6]. The PV cells typically show varying v –i characteristics depending on the above-mentioned factors. Figure 46.7 shows the output characteristics of a PV cell with changing levels of illumination.
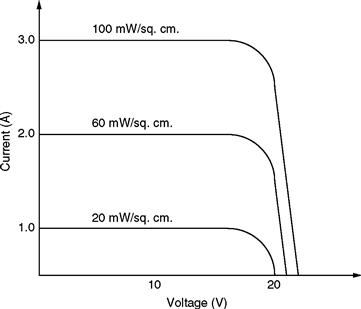
FIGURE 46.7 Typical v –i characteristics of a PV cell with varying illumination levels.
As is clear from Fig. 46.7, the current level increases with increase in the irradiation level. Figure 46.8 shows the v –i curves with varying cell temperatures.
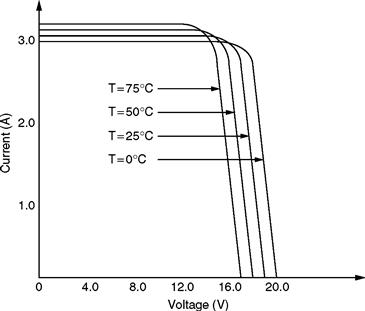
FIGURE 46.8 Typical v –i characteristics of a PV cell with varying cell temperatures.
As depicted in Fig. 46.8, the output curves for varying cell temperatures show higher voltage level as the cell temperature increases. Therefore, while modeling the PV cell, adequate consideration must be given to these two characteristics in particular.
Keeping the above-mentioned factors in mind, the electrical equivalent circuit modeling approach is proposed here. This model is basically a nonlinear distributed circuit, in which the circuit elements consist of familiar semiconductor device parameters. Eventually, running a suitable computer simulation can easily simulate this model.
The PV cell can basically be considered a current source with the output voltage primarily dependent on the load connected to its terminals [6]. The equivalent circuit model of a typical PV cell is shown in Fig. 46.9.
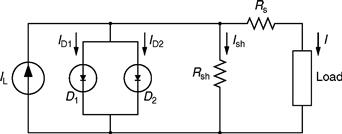
FIGURE 46.9 Schematic of the equivalent circuit model of a PV cell.
Suitable forward-bias (illuminated) and reverse-bias (dark) tests can be performed on the PV cell, in order to generate the v –i curves similar to those in Figs. 46.7 and 46.8. As is clear from Fig. 46.9, there are various parameters involved in the modeling of a typical PV cell. These parameters are
IL, light-generated current (A);
ID1, diode saturation current (A);
ID2, additional current due to diode quality constant (A);
Ish, shunt current (A);
RS, cell series resistance (Ω);
Ish, cell shunt resistance (Ω); and
I, cell-generated current (A).
The model depicted in Fig. 46.9 examines all the characteristic measurements of the p–n junction cell type. From the above circuit, the following equation for cell current can be obtained:
Here, q is the electron charge and k is the Boltzmann's constant. The voltage at the terminals of the diodes in Fig. 46.9 can be expressed as follows:
Here, β is the voltage change temperature coefficient (V/°C). For the PV cell model of Fig. 46.9, RS and Rsh are usually estimated when the cell is not illuminated. The series resistance, RS, represents the ohmic losses in the front surface of the PV cell, whereas the shunt resistance, Rsh, represents the loss due to diode leakage currents. Thus, these values can be approximated from the dark characteristic curve of the cell. The generated light current (IL) is calculated by the collective probability of free electrons and holes. It can be expressed as follows:
![]()
Here, f(x) is the probability distribution function and N is the rhythm of generated electrons and holes. Once the equations of the cell model are formulated, the efficiency of the PV cell can be obtained as
![]()
A distinct advantage of such a computer model is the fact that, with a very few number of changes, it can receive data from different kinds of PV cells maintaining satisfactory results [6]. An example of such a PV model used in conjunction with a power electronic intensive system is shown in Fig. 46.10.
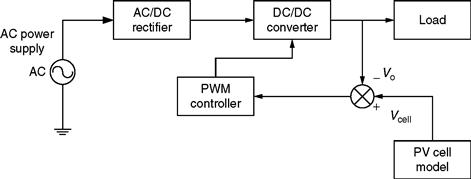
FIGURE 46.10 Schematic of a PV cell model-based system for simulation.
The vital part of the system, as depicted in Fig. 46.10, is the dc/dc converter. The dc/dc converter could be a boost, buck, or buck-boost converter. Although, in the system shown in Fig. 46.10, it is valid to assume a buck or buck-boost dc/dc converter, it becomes erroneous to assume usage of a boost converter. This is because the dc/dc boost converter does not make use of the full voltage range.
46.3.4 Electrical Modeling of Ultracapacitors (UCs)
Ultracapacitors (also known as double-layer capacitors) work on the electrochemical phenomenon of very high capacitance/unit area using an interface between electrode and electrolyte. Typical values of such capacitors range from 400 to 800°F and have low values of resistivity (approximately 10− 3Ω-cm) [6]. These UCs operate at high-energy densities, which are commonly required for applications such as space communications, digital cellular phones, electric vehicles, and hybrid electric vehicles. In some cases, usage of a hybridized system employing a battery alongside the UC provides an attractive energy storage system, which offers numerous advantages. This is particularly due to the fact that the UC provides the necessary high-power density, whereas the battery provides the desired high-energy density. Such a hybridized model will be discussed here.
46.3.4.1 Double Layer UC Model
A simple electrical equivalent circuit of a double-layer UC is shown in Fig. 46.11. Its parameters include equivalent series resistance (ESR), equivalent parallel resistance (EPR), and the overall capacitance. The ESR in Fig. 46.11 is important during charging/discharging as it is a lossy parameter, which in turn causes the capacitor to heat up. In contrast, the EPR has a leakage effect and, hence, it only affects the long-term storage performance. For the purpose of simplification in calculations, the EPR parameter is dropped.
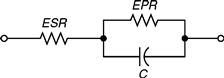
FIGURE 46.11 Electrical equivalent circuit of an ultracapacitor.
Furthermore, the dropping of the EPR parameter does not have any significant impact on the results. The circuit for analysis is thus simply an ideal capacitor in series with a resistance and the corresponding load [6]. Hence, the value of resistance can be written as
![]()
Here, R is the overall resistance (Ω), ns is the number of series capacitors in each string, and np is the number of parallel strings of capacitors. Furthermore, the value for the total capacitance can be expressed as
![]()
Here, C is the overall value of capacitance and Crated is the capacitance of individual capacitor. This model can be used in conjunction with a dc/dc converter, which in turn acts as a constant power load, as shown in Fig. 46.12.
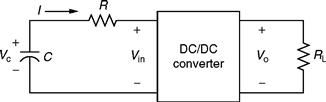
FIGURE 46.12 Circuit showing UC connected to a constant power load.
The capacitor bank can be used in stand-alone mode or can be operated in parallel with a battery of suitable size for the applications mentioned earlier. A brief description of such a hybrid model is described in the following section.
46.3.4.2 Battery/UC Hybrid Model
Combining a battery and an UC to operate in parallel makes an attractive energy storage system with many advantages. Such a hybrid system uses both the high-power density of the UC and the high-energy density of the battery. In this section, an electrical equivalent model of such a system will be presented, which can be used to evaluate its voltage behavior. This model is depicted in Fig. 46.13.
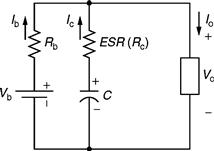
FIGURE 46.13 Equivalent circuit model of a battery/UC hybrid system.
The equivalent circuit of Fig. 46.13 shows an equivalent series resistance (Rc) and a capacitor (C) as a model of the UC, whereas the Li-ion battery can be modeled simply by using a series resistance (Rb) and a battery. The values of Rc and C depend on the frequency due to the porous nature of the electrodes of the UC [6]. When the pulse width (T) is varied, the discharge rate of the UC can be varied and can be shown to be equal to a frequency of f = 1/T. The following equations can be written for Io and Vo from the equivalent circuit model of Fig. 46.13:
Here, Io and Vo are the output current and voltage delivered to the load, respectively. From the above two equations, it is possible to achieve a voltage drop Δ V = Vb, –Vo due to a pulse current of Io. This voltage drop can be finally expressed as
The currents delivered by the battery (Ib) and capacitor (Ic) can also be derived, and their ratio can be expressed as
![]()
It can be seen that for a long pulse, Ic can be limited by the value of C. Furthermore, it can be concluded that during the pulsed discharge, about 40%-50% of the total current is delivered by C. Upon computer simulation of the equivalent circuit model, it is possible to study the fact that, during peak power demand, UC delivers energy to assist the battery, whereas, during low power demand, UC receives energy from the battery.
Due to the advanced energy storage capabilities of the UC, it can be used for applications requiring repeated short bursts of power such as in vehicular propulsion systems. In a typical scenario, both the battery and the UC provide power to the motor and power electronic dc/ac inverter during acceleration and overtaking, whereas they receive power via regenerative braking during slow down/deceleration. Two of the most popular topologies for inserting batteries and UCs into drivetrains are shown in Figs. 46.14a, b.
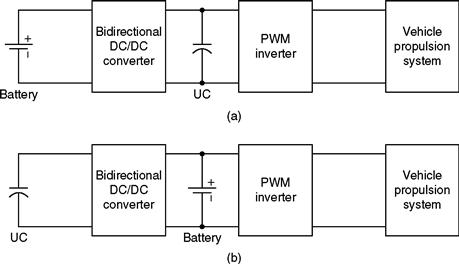
FIGURE 46.14 Typical topologies of batteries and UCs in drivetrains.
As is clear in the topology of Fig. 46.14a, the UC bank is placed on the dc bus, whereas in Fig. 46.14b, the dc bus houses the battery. Among the two topologies, the one shown in Fig. 46.14a has a much more degraded energy efficiency because the whole of the battery energy has to go through the dc/dc converter. Another drawback worth highlighting is that a very high-voltage UC bank is required, which is extremely expensive. Hence, more often than not, the topology of Fig. 46.14b is generally considered for HEV applications [6]. In a typical brushless de (BLDC) motor-driven electric vehicle propulsion system, an UC bank could be used to achieve a wider drive range, good acceleration/deceleration performance, and low cost.
Future projections regarding performance of UCs show that energy densities as high as 10-20 Wh/kg are easily achievable using carbon electrode materials with specific capacitance values of nearly 150–200 F/g [6]. Currently, extensive R&D on UCs is being carried out in the United States, Canada, Europe, and Japan. As mentioned earlier, most of the research on UCs focuses on EV and HEV applications and on medical and power system applications.
46.3.5 Electrical Modeling of Flywheel Energy Storage Systems (FESS)
Flywheels are most definitely finding numerous applications as energy storage devices in various power system configurations. Furthermore, the constant improvement in digital signal processing (DSP) and microprocessor technologies in conjunction with the recent development in magnetic material technology makes this fact a distinct possibility. A flywheel energy storage system (FESS) is advantageous in a system comprising other secondary storage devices such as batteries as it is capable of generating optimum charge/discharge profiles for specific battery characteristics [6]. This fact facilitates the exploration of the benefits for optimizing battery management.
A rotating flywheel can store mechanical energy in the form of kinetic energy based on its inertial properties. Essentially, a FESS consists of a rotor, a motor/generator system, and a suitable enclosure [6]. An example of a flywheel energy storage system used as a voltage regulator and a UPS system is shown in Fig. 46.15.
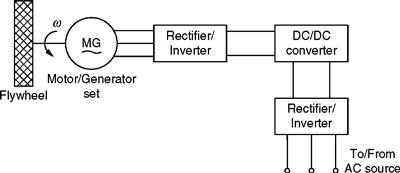
FIGURE 46.15 Typical FESS employed as voltage regulator and UPS.
The system of Fig. 46.15 essentially operates in three modes: charging, voltage regulation, and UPS. The motor/generator (M/G) set is required for energy storage purposes in the form of the inertia of the rotor. At some suitable point in the operation of the system, it retrieves this stored energy as demanded by the load. The M/G set is a high-speed device that basically operates in the motoring mode when charging the flywheel and in the generating mode when discharging it. The motor used for the M/G set could be a brushless dc motor of appropriate rating. The FESS can be easily simulated using the following equation:
![]()
Here, Vx, ix, and Ex are the voltages, stator currents, and back EMFs for the three phases of the BLDC motor, respectively. In addition, R, L, and M are the resistance, self-inductance, and mutual inductance of the stator winding. The back EMF is directly proportional to the mechanical speed, ωm, and the rotor angle, θr.
In order to electrically simulate the same flywheel energy storage system operating in conjunction with power electronic intensive systems, it is essential to derive an equivalent electrical model of the same. For this purpose, it is critical to note the important mathematical equations that describe the above system. These are as follows:
Here, v is the voltage across the motor terminals; i is the electric current through the motor; ω is the rotor speed; Tem is the electromagnetic torque imposed on the rotor; TL is the mechanical torque imposed on the rotor by the flywheel; Jr is the equivalent moment of inertia of the rotor; J is the moment of inertia of the flywheel; and R and L are the armature resistance and self-inductance. Furthermore, a indicates the ratio of the rated voltage of the motor to its rated speed, whereas b indicates the mechanical drag coefficient. The electrical equivalent circuit generated by combining the above three equations is depicted in Fig. 46.16.
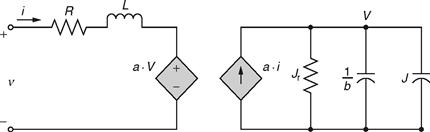
FIGURE 46.16 Electrical equivalent circuit of a flywheel energy storage system.
It is essential to note that the circuit parameters used are basically the parameters employed for the definition of the mathematical model of the FESS. Thus, Fig. 46.16 describes the FESS system in its entirety via an electrical equivalent. Again, as mentioned earlier, the task of simulating a FESS with any electrical system becomes immensely simplified because such an electrical model can be constructed in any popular electrical CAD simulation software and can be appropriately analyzed.
46.4 Hybridization of Energy Storage Systems
Certain applications require a combination of energy and power density, cost, and life cycle specifications that cannot be met by any single energy storage device. To satisfy such applications, hybrid energy storage devices (HESD) have been proposed. HESD electronically combine the power output of two or more devices with complementary characteristics. HESD all share a common trait of combining high-power devices (devices with quick response) and high-energy devices (devices with slow response).
The proposed HESDs are listed next, with the energy-supplying device listed first, followed by the power-supplying device:
Note that batteries can be considered either as the energy-supplying device or as the power-supplying device depending on the application. Also, note that references [7–9] consider fuel cells rather than regenerative fuel cells. However, the system operation principle would be identical for the regenerative fuel cell, with the difference that the fuel cell would be bidirectional. However, HESDs have been proposed for utilization as an energy source for propulsion applications or grid support [10–12].
In order to have two or more energy storage devices act as a single power source, conditioning circuitry is required to combine their outputs. Numerous topologies have been proposed to achieve this task, ranging from simple to very flexible. In general, the proposed topologies can be grouped into three categories, as shown in Fig. 46.17. A discussion of merits of each topology and typical uses follows.
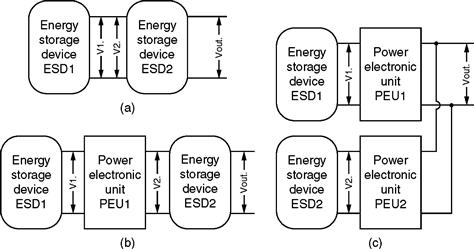
FIGURE 46.17 Proposed topologies for hybrid energy storage devices.
Direct parallel connection of two energy storage devices is shown in Fig. 46.17a. Utilization of this topology requires that the voltage outputs of the two power sources match (V1 = V2). Direct parallel connection of batteries and EDLC has been proposed [13–15] for low-voltage, cost-sensitive applications, such as the automotive 42 V PowerNet system [14]. The automotive 42V PowerNet application power profile consists of a high-power pulse (engine cranking) followed by a constant low-power demand over a longer time period (while the vehicle is in operation). A direct parallel connection of batteries and EDLC makes use of the source impedance mismatch causing the low-impedance UC to provide power during high-power pulses, while the high-energy battery supplies the long low-power demand. Note that the output Vout varies as the system charges and discharges. In addition, the range of power that is used from either energy source is limited by the voltage swing of the other. In other words, individual maximum power point tracking is not possible for each source.
A more complex but flexible solution is to place an additional converter between the two power sources, as shown in Fig. 46.17b. PEU1 controls the current output of ESD1, allowing its voltage to vary, whereas ESD2 supplies the remaining power requirement to the load. Therefore, this system allows for the decoupling of the two power sources. Typically, the energy storage device with a stronger dependency is utilized as ESD1. Another criterion may be to put the more sensitive device in place of ESD1 to prolong the life of the system by conditioning the current output of ESD1. Systems that make use of this topology include battery and EDLC; fuel cell and battery or EDLC; SMES and battery [16]. The commonly used topology for combining the two systems is the single leg (two switches in series) converter, which can act as a boost in the forward operation mode and as a buck in the reverse operation mode. In reference [17], the authors propose to use a variation of this system, where the battery and EDLC are connected to the load one at a time, allowing the system controller to pick which source should power the load. Source switching results in step changes of the bus voltage that requires an appropriate flexible modulation strategy. Recently, researchers have proposed the use of an isolated topology to allow for a larger voltage gain between the input and output. A superconducting magnetic energy storage (SMES) device could be connected to the midpoint of two converter legs, allowing it to charge or discharge. The battery is connected to the bus to make use of the relatively invariant battery voltage.
Finally, researchers [18, 19] have looked at using the topology shown in Fig. 46.17c, where each power source is connected to a dedicated power converter with the converters connected to the common output bus. Such a system provides the highest level of flexibility as each power source is allowed to operate at its optimal voltage –in essence, maximum power point tracking can be implemented for each source. Having dedicated converters for each power source allows for a wide range of topologies and control strategies to be implemented. The simplest topology that allows an acceptable degree of flexibility is to use the single leg (two switches in series) converter, which can act as a boost in the forward operation mode and as a buck in the reverse operation mode [18, 19]. Other topologies have been proposed that introduce a transformer either for isolation or to allow efficient voltage boosting.
46.5 Energy Management and Control Strategies
In addition to properly sizing the battery pack to meet the power and energy demand of the vehicle, the system designer needs to ensure that the batteries perform their function as expected by the designer. To ensure this, the designer must incorporate the following: undervoltage protection, overvoltage protection, short-circuit protection (maximum current limit), thermal protection, state of charge (SOC), state of health (SOH), and state of function (SOF) monitoring, and cell equalization (balancing) on cell, as well as module level.
The state of the battery pack is monitored by measuring the SOC of the pack. Thermal management and strict manufacturing tolerances ensure that all parts of the pack are at the same state of charge. In addition, the designer may introduce some active methods of balancing the cells/modules.
46.5.1 Battery State Monitoring
A good knowledge of the state of the battery is essential for meaningful energy management [20–22]. The difficulty in measuring the condition of a battery in an operating system stems from the fact that the rate and the efficiency of the chemical reaction that produces the current depend on a number of factors, including the temperature, age, and manufacturing conditions [20]. Therefore, various figures of merit have been used to define the state of the battery. Battery SOC is defined as
![]()
The issue with this metric is that the actual amount of charge is very difficult to measure. For instance, the total amount of charge that is available for utilization changes as the battery ages. Also, the capacity scatter due to manufacturing variations makes the total amount of charge hard to determine, even for a new cell.
State of health (SOH) measures the ability of a battery to store energy, source and sink high currents, and retains charge over extended periods, relative to its initial or nominal capability. This quantity is closely related to battery age and SOC.
State of function (SOF) is the capability of the battery to perform a specific duty which is relevant to the functionality of a system powered by the battery. The SOF is a function of the battery SOC, SOH, and operating temperature. For example, a new battery (high SOH) at a lower SOC, and higher operating temperature, may perform better (higher SOF) than an older battery (low SOH) at a higher SOC, and lower operating temperature.
There are a number of methods that allow for the determination of the SOC, SOH, and SOF as outlined in Table 46.2. The simplest and most commonly used method is measuring of the open-circuit voltage of the battery and relating it to the SOC (lookup table method). In a dynamic application, this method will be very imprecise when the battery is under a load.
TABLE 46.2 Summary of techniques to measure battery condition (+/–indicates whether the method is able to estimate a particular figure of merit) [23–25]
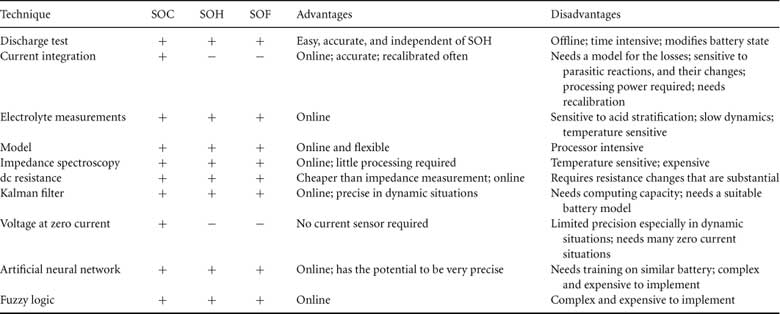
A simple equivalent circuit model that uses the cell voltage and current to estimate the open-circuit voltage can be implemented (model-based estimation). This method requires a current sensor and processing power. Depending on the complexity of the algorithm, the processor requirements range from minute to substantial. Alternatively, a comparator can be used to identify the points where the current is zero and measure only these points (voltage at zero current method).
This method introduces imprecision because the battery does not reach its equilibrium voltage for a longer period after the zero current condition. Therefore, in dynamic situations, the error becomes substantial. More complex, processor-intensive procedures can be used and give much higher precision. For example, a more complex equivalent circuit model can be used, which also uses information from impedance and resistance measurements (model, dc resistance, and impedance spectroscopy methods). Other options include the use of fuzzy logic, neural networks, or Kalman filters. Discharge test is the only certain way of determining the values of all three figures of merit. However, to administer this test, the battery needs to be removed from the application and discharged. Therefore, this method is only used for precision validation of other monitoring methods.
Ni-MH batteries present a bigger challenge for the determination of figures of merit because the voltage versus SOC plot is not linear. In fact, the voltage is almost flat throughout the 20–80% SOC range. Also, the batteries exhibit a memory effect. The most common way of determining the SOC is by current integration. However, this method does not consider charge inefficiencies or the effect of temperature. Fuzzy logic method has been used with success for monitoring Ni-MH state of charge.
46.5.2 Cell Balancing
Cell balancing is critical for systems that consist of long strings of cells in series. Because the cells are exposed to different conditions within the pack, without equalization, the individual states of charge and, therefore, cell voltages, will gradually drift apart. In the worst-case scenario, this leads to a catastrophic event such as ignition in the case of Li-ion batteries, and in the best-case scenario, this leads to the degradation of pack life. The sources of cell imbalance stem from manufacturing variance, leading to variations in internal impedance and differences in self-discharge rate. Another source of variation is the thermal differential across the pack, resulting in differing thermodynamics in the cells. Variations in the SOC can be minimized by designing a good thermal management system and with tight manufacturing controls.
The equalization methods can be considered to be active or passive. Passive methods are effective for lead acid and Ni-MH batteries which can be overcharged safely. However, overcharge equalization is only effective on a small number of cells in series, because equalization problems grow exponentially with the number of cells in series, and extensive overcharge does lead to cell degradation.
Many active methods are available ranging from minimally effective to exorbitantly expensive. Table 46.3 gives an extensive list of available cell-balancing methods. Generally, four methods of cell equalization exist that are defined by the method of current distribution: resistive (dissipative), switch (bypass method), capacitor, and transformer-based equalization. Typically, the cost and bulkiness and efficiency increase in the same order (resistive, switch-based, capacitive, and transformer-based).
TABLE 46.3 Summary of cell-balancing strategies
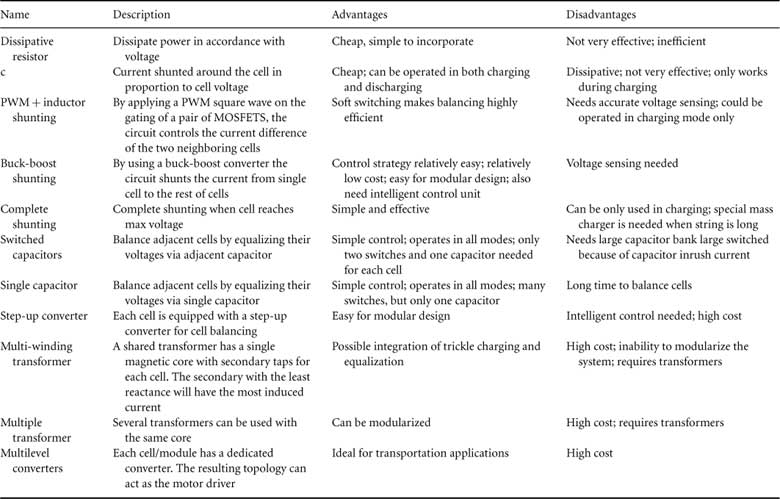
An example of a dissipative system is the use of dissipative resistors. Dissipative resistor in continuous mode is good for low-power application. Because the resistors are operating in continuous mode, the resistors can be small and do not need much thermal management. Another advantage of this method is the low price.
Analog current shunting is another inexpensive method of cell balancing. In this case, current is shunted around the cell in proportion to cell voltage. This system requires a comparator and a switch per cell or module. In contrast, the system is more efficient as the current is shunted rather than dissipated. This circuit has another advantage that the current could potentially be shunted both during charge and discharge, protecting the batteries from over-discharge as well as overcharge. An alternative to analog shunting is complete shunting. This system is simpler than analog shunting, as the cell is completely bypassed when the voltage reaches a certain voltage, rather than administering a PWM signal in proportion to the cell/module voltage. Dedicated buck-boost converter at each cell/module is another alternative. This system requires the use of a switch, inductor, and a diode per cell, and is only effective during charging.
Switched capacitor method uses capacitors to balance the voltage at each cell. This is achieved by having (n – 1) capacitors connected in parallel to n batteries and using capacitors to equalize the current over the two adjacent cells. Further improvements of this method consider the use of two levels of capacitors for faster equalization or only one capacitor to improve system reliability. This equalization method is advantageous for hybrid applications where the batteries are never or seldom fully charged, as the equalization takes place at any voltage and operating condition.
Another approach is to use transformers to administer the charge to the batteries, with the charger on the primary, and each cell/module as multiple secondary. Each cell will then absorb a varying current that is inversely proportional to its voltage, thus ensuring voltage equalization. The issues with this system are the bulkiness and expense associated with the transformer, as well as the complex system control, and the inability to modularize the system once it is designed.
In summary, dissipative resistors in continuous mode, buck-boost shunting, and switched capacitors are the three most effective methods for different applications. Buck-boost shunting is appropriate for either high- or low-power applications, has relatively low cost, and is simple to control. The switched-capacitor method is suitable for HEV applications because it is effective in both charging and discharging regimes.
46.6 Power Electronics for Energy Storage Systems
In order to appreciate the role of power electronics in battery energy management, it is essential to first identify the various issues with typical battery packs, especially those of recently touted Li-ion batteries for electric, hybrid electric, and plug-in hybrid electric vehicles.
46.6.1 Advantages and Disadvantages of Li-Ion Battery Packs for HEV/PHEV Applications
Lithium rechargeable batteries are today at the top of their wave. For instance, a 20-kWh Li-ion battery pack weighs about 160 kg (at the rate of 100–140 kWh/kg), which is acceptable for HEV applications. In contrast, current HEV nickel-metal hydride (Ni-MH) batteries weigh between 275 and 300 kg for the same application. Moreover, Li-ion batteries also depict excellent power densities (400–800 W/kg), allowing more than 2C discharge rate (at the rate of 40–80 kW peak power in a 20-kWh pack) [26]. However, they also have many drawbacks. One of the drawbacks is the cost (projected at about $ 250–$ 300/kWh), which is the most expensive of all chemistries [26]. Another drawback is that lithium is a very flammable element, whereby its flame cannot be put off with a normal ABC extinguisher. Finally, Li-ion batteries have a cycle life between 400 and 700 cycles, which does not satisfy HEV expectations. Therefore, finding a solution to these issues is crucial.
In order to resolve the safety issue, some manufacturers have modified the chemistry of the battery to the detriment of capacity and cost. Others have developed chemistries that improve the cycle life and the calendar life to the detriment of capacity and power availability. In summary, an overall success in all the aspects has not been achieved for the moment [26].
With reference to cycle life, the battery can suffer significant degradation in its capacity, depending on its usage. Furthermore, the internal resistance also increases with each charge cycle. Also, according to the chemistry and the quality of the cells, a battery typically loses about 20% of its initial capacity after about 200–1000 full cycles, also known as the 100% DOD (depth of discharge) cycles. The cycle life can be greatly increased by reducing DOD and by avoiding complete discharges of the pack between recharging or full charging. Consequently, a significant increase is obtained in the total energy delivered, whereby the battery lasts longer. In addition, overcharging or over-discharging the pack also drastically reduces the battery lifetime.
An alternative way to solve the above-mentioned problems, which are essentially common to the all lithium rechargeable batteries, is using electronic control in the form of cell voltage equalizers. Few of the control rationales are briefly listed next.
• Overvoltage protection: This functionality cuts the charging current when the total voltage is more than 4.3 V/cell. This is because, at higher voltages, metallic lithium is formed inside the cell, which is highly flammable, as explained earlier. For the sake of simplicity, this protection is sometimes applied to the whole pack of cells, instead of measuring the voltage of each cell.
• Undervoltage protection: This functionality cuts the discharging current when the voltage is under 2.5 V/cell. Under this voltage, some capacity fades, and a specific quantity of unwanted copper plating is formed inside the cell. This unwanted copper may generate internal short circuits. Also in this case, for the sake of simplicity, the total voltage might be measured, instead of verifying the voltage of each cell.
• Short-circuit or overcurrent protection: This protection scheme disconnects the charging/discharging current if it is over a certain limit (2C–50C, depending on the cell technology).
• Overheating protection: In this case, the current is disconnected if the pack temperature rises over a certain value (about 60°C).
Although these protection functionalities are useful, they prove to be highly insufficient. In fact, the differences in capacity and internal resistance from cell to cell, within the same pack, may result in unwanted voltage peaks, especially during the final stages of charge and discharge. Consider a battery pack of 14.4V (4 cells, of 3.6 V each) normally charging at 16.8 V (4 × 4.2 V). Due to the differences among the cells, the smaller capacity cell ends up with a voltage higher than the average. Consequently, if the total voltage is 16.8 V at the end of the charging cycle, the cell voltage distribution might be 4.3 V + 4.2 V + 4.2 V + 4.1V = 16.8 V, where 4.3 V corresponds to the smaller capacity cell and 4.1 V corresponds to the larger capacity cell. Depending on the protection circuitry, this situation may or may not be detected, and the resistive equalizer gradually downgrades the voltage from 4.3 to 4.2 V. The net result is a considerable downgrade in overall capacity, considering that the overvoltage occurs in the smaller capacity cell, and that this cell is later discharged by a specific amount, in order to draw level with the other cells.
In contrast, during discharge, if the lower cut-off voltage is 3 V per cell, the pack will discharge up to 12 V. As the lower capacity cell discharges faster than the rest of the cells, the voltage distribution might be 2.7V + 3 V + 3 V + 3.3 V = 12 V. Again, in this case, the lower capacity cell suffers from an over-discharge, which is not detected by the protection circuit. Thus, the cell incurs an additional capacity reduction due to the resultant over-voltage and under-voltage, which downgrade the capacity of the entire pack.
46.6.2 Operational Characteristics of Classic and Advanced Power Electronic Cell Voltage Equalizers
A battery cell voltage equalizer is an electronic controller that takes active measures to equalize the voltage in each cell. In addition, by some more complex methods, such as measuring the actual capacity and internal resistance of each cell, it equalizes the DOD of each cell. As a result, each of the cells will have the same DOD during charging and discharging, even in conditions of high dispersion in capacity and internal resistance. This causes each cell of the pack to act as an average cell. In the example presented in the previous section, instead of 282 cycles, the pack would last 602 cycles, an increment of more than 100% in the cycle life. For the same application, the requirement of current though the equalizer at a discharge of 50 A, over a 100-Ah pack, would be 6-A drain/source, over the extreme capacity cells (the ones with bigger and smaller capacity), and a total transferred power of 350 W (in the entire chain), over the complete charging/discharging time. In addition to the increment in cycle time, depending on the internal resistance of each cell, the equalizer also has the potential to improve the output power. This requires a detailed analysis of the internal resistance versus DOD, in order to have precise improvement. In the following analyses of various equalizers, it will be realized that only a few of them are capable of accomplishing this requirement.
In principle, there exist three basic families of equalizers: resistive, capacitive, and inductive. Resistive equalizers simply burn the excess power in higher voltage cells, as depicted in Fig. 46.18. Consequently, it is the cheapest option and is widely utilized for laptop batteries. As is obvious, due to inherent heating problems, resistive equalizers tend to have low equalizing currents in the range 300–500 mA and work only in the final stages of charging and flotation.
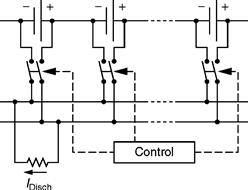
FIGURE 46.18 Schematic of atypical resistive equalizer.
In contrast, capacitive equalizers use switched capacitors, as shown in Fig. 46.19, in order to transfer the energy from the higher voltage cell to the lower voltage cell. It switches the capacitor from cell to cell, allowing each cell to physically have the same voltage. Besides, it also depicts higher current capabilities than a resistive equalizer. At the same time, the main drawback of capacitive equalizers is that it cannot control inrush currents, when big differences in cell voltages exist. In addition, it does not allow any desired voltage difference, for example, when equalizing DOD.
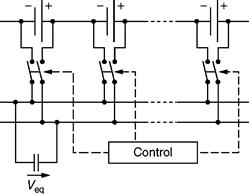
FIGURE 46.19 Schematic of a typical capacitive equalizer.
Finally, inductive or transformer-based equalizers use an inductor to transfer energy from the higher voltage cell to the lower voltage cell. In fact, this is the most popular family of high-end equalizers, and because of its capability to fulfill most of the needs expressed above, it is explored in more detail in the following sections.
46.6.2.1 Basic Inductive Equalizer
A basic inductive equalizer is shown in Fig. 46.20. These equalizers are relatively straightforward and can transport a large amount of energy. At the same time, they are also capable of handling more complex control schemes, such as current limitation and voltage difference control [26].
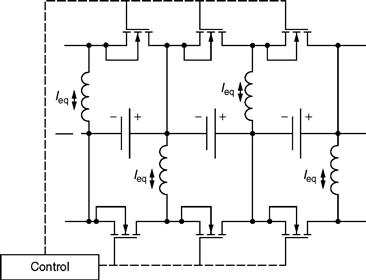
FIGURE 46.20 Schematic of a typical inductive equalizer.
In contrast, it takes some additional components to avoid current ripples from getting into the cell. Typically, this requires two switches (and control) per cell. Also, due to switching losses, the distribution of current tends to be highly concentrated in adjacent cells. Hence, a high-voltage cell will distribute the current largely among the adjacent cells, instead of equally in all cells. In this case, the switching scheme could be replaced by a more complex, global scheme, with the additional cost of more processing power.
46.6.2.2 Cuk Equalizer
As the name indicates, this is an inductive-capacitive type of equalizer, primarily based on the Cuk Converter topology. It shares almost all the characteristics of inductive equalizers, but it does not suffer from high-current ripples, or cost of additional power capacitors, or double rated switches. A schematic of a typical Cuk equalizer is shown in Fig. 46.21.
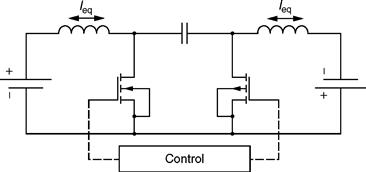
FIGURE 46.21 Schematic of a typical Cuk equalizer.
The Cuk equalizer does incur minor losses due to the series capacitor, but this is far from a major shortcoming. This equalizer also possesses high current and complex control capability, at the expense of additional processing power.
46.6.2.3 Transformer-Based Equalizer
The solutions provided by transformer-based equalizers permit the right current distribution along all cells. One such popular arrangement is depicted in Fig. 46.22.
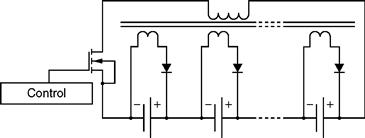
FIGURE 46.22 Schematic of a multi-winding transformer equalizer.
This topology poses an additional issue of a very complex multi-winding transformer. This transformer is very difficult to mass produce, because all windings must have the compatible voltages and resistances. Hence, it is not a practical solution for high-count HEV cell packs, and moreover, it also lacks the capability of handling complex control algorithms such as current and voltage control. An alternative solution is presented in Fig. 46.23, using separate transformers for each cell.
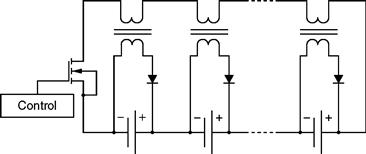
FIGURE 46.23 Schematic of a multiple transformer equalizer.
This solution is modified here, in order to use 1:1 transformers. Although, through this topology, a substantial amount of redundancy is obtained, only a very small dispersion can be accepted, with the added risk of experiencing current imbalance.
46.7 Practical Case Studies
46.7.1 Hybrid Electric and Plug-in Hybrid Electric Vehicles (HEV/PHEV)
It is an obvious fact that future vehicles are moving toward more electrification. It is widely agreed that more electric vehicles will depict major benefits over conventional vehicles in terms of improved performance, less harmful emissions, and higher drive train efficiency. Since the legislation of strict ultralow-emission standards by California Air Resource Board (CARB) in 1990, auto industries and research laboratories around the world are pursuing electric and hybrid electric vehicle research seriously. Motivation of auto manufacturers toward more electric and hybrid electric vehicles (HEVs) increased in 1993, by declaring the historic partnership program for next generation vehicles (PNGV) between the big three automakers (GM, Ford, and Chrysler) and the U.S. government.
Primarily, a hybrid electric vehicle improves total overall drive train efficiency over a standard drive system by supplying electric energy from an electric energy storage system to assist the main power source and reusing braking energy that would otherwise be lost. High-quality energy storage system (ESS) is one of the most crucial components that affects vehicles’ performance characteristics. The energy storage device charges, during low-power demands, and discharges, during high-power demands. Thus, it basically acts as a catalyst for providing an energy boost. Therefore, the engine ideally operates at its most efficient speed. Because of this intended operation, the energy storage device is sometimes referred to as the load-leveling device.
The most important traits that customers look for in the vehicles loaded by LLDs are acceleration rate, fuel economy, level of maintenance, safety, and cost [27]. All these requirements need to be supported by an efficient, fast responding, and high-capacity ESS. Therefore, improved energy storage devices are a key technology for next generation HEVs.
The introduction of large battery packs in advanced vehicles presents a major shift in how batteries are used; the profile is truly unique and varies greatly depending on the vehicle in question. In this section, typical battery load profiles are investigated in advanced vehicles. Depending on the battery usage, various battery designs are better suited for the application. In some cases, high-power batteries are required, whereas in other cases, high-energy density batteries are more appropriate. A number of simulations were performed to demonstrate the requirements from the batteries as a function of the application. The vehicles considered are the following:
• Electric vehicle with a 50- and 100-mile range
• Series PHEV with a 10-, 20-, and 30-mile all-electric range
The parameters of the simulated vehicles are given in Table 46.4, power-train specifications in Table 46.5, and the battery pack parameters in Table 46.6.
TABLE 46.4 Chassis specifications
| Parameter | Value |
| Glider mass (kg) | 900 |
| Frontal area (m) | 1.8 |
| Coefficient of drag | 0.3 |
| Wheel radius (m) | 0.3 |
| Rolling resistance coefficient | 0.009 |
| Battery capacity (Wh/kg) | 60 |
| Battery power density (W/kg) | 375 |
TABLE 46.5 Power-train specifications
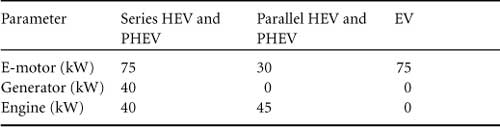
TABLE 46.6 Battery specifications
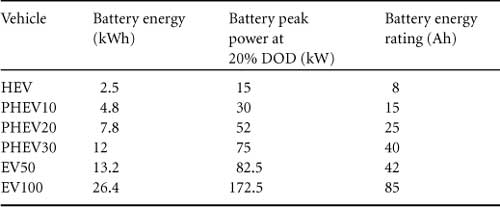
Note that the batteries are sized in accordance to the type of vehicle and the targeted all-electric range. The battery voltage was assumed to be 314 V, and the battery capacity was varied to achieve the total battery capacity required. This is equivalent to connecting strings of batteries in parallel. Battery pack specifications were chosen to be 60 Wh/kg (energy density) and 375 W/kg (power density). These specifications are well within what is achievable practically. The energy density is defined at the 1C rate, and the power is defined by the HPPC test at 20% DOD. The driving cycle is the urban dynamometer driving schedule (UDDS), representing typical urban driving. The vehicle is driven over 30 miles (four UDDS cycles), representing a typical daily commute.
Based on the parameters enlisted in Tables 46.4-46.6, the vehicles were simulated using the Advanced Vehicle Simulator (ADVISOR) software. Figure 46.24 shows simulation results for two electric vehicles with a 50-mile (EV50) and 100-mile (EV100) electric range. For each vehicle, the battery pack size was increased until the driving range reached 50 and 100 miles respectively. Because we are concerned with the battery operation, we will compare the current outputs out of the batteries, and the currents are normalized to the battery 1C rate to more easily compare the relative stresses on the battery. In the case of EV50, the currents reach a 2C rate quite often, whereas in the case of EV100, the peak current is about 1C. This stresses the need for different battery designs for the two vehicles. For EV50, the designer must chose a battery capable of supplying and absorbing a 2C rate without affecting battery life. For EV100, the designer can opt for a very high energy density battery as only 1C rate will be required. A higher density battery would in turn extend vehicle range due to the smaller vehicle mass.
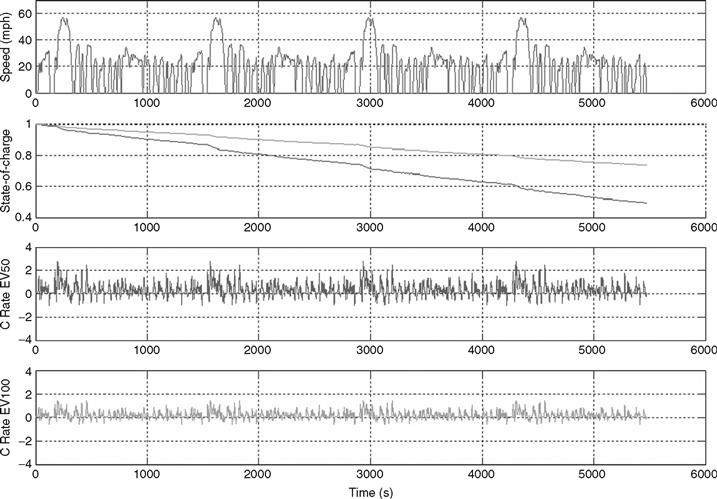
FIGURE 46.24 EV50 and EV100 simulation results (from top to bottom): drive cycle, state of charge, EV50 current, normalized to the battery Crate, EV100 current, normalized to the battery Crate.
Another issue that has to be considered for EVs and PHEVs is the recharge time of the battery. If the battery pack is designed for a maximum current of 1C, it would take over an hour to charge the battery. This may not be acceptable to the user in some cases.
In the next test, HEVs are considered, as shown in Fig. 46.25. Here, three cases are investigated: Parallel HEV, Thermostat Series HEV, and Load-Following Series HEV. The Parallel HEV uses the electrical system to assist the engine with vehicle acceleration and to propel the vehicle at low speeds where the engine operation is inefficient. The state of charge of the vehicle is kept close to the target value of 50%. As the electrical system is small, the batteries provide a relatively small portion of the total vehicle power. The batteries supply currents up to 5C, and the total energy demand from the battery is also very small. Therefore, a high specific power battery would be ideal for this application, and even ultracapacitors maybe considered, as the energy throughput is minimal.
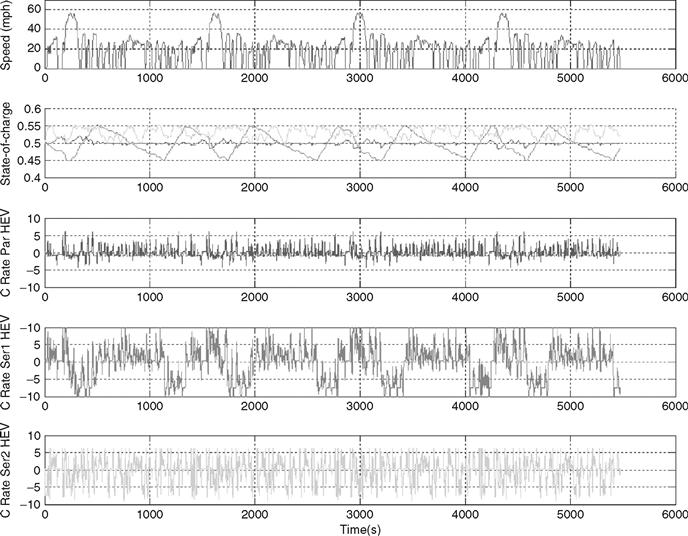
FIGURE 46.25 Parallel HEV, thermostat series HEV, and load following series HEV (from top to bottom): drive cycle, state of charge, parallel HEV current, normalized to the battery Crate, thermostat series HEV current, normalized to the battery Crate, load following series HEV current, normalized to the battery Crate.
The second case is the thermostat series hybrid. Here, the internal combustion engine is only operated at its most efficient point. The internal combustion engine is turned on when the battery state of charge reaches the minimum allowed (in this case, 45%) and is turned off when the battery state of charge reaches the maximum value (in this case, 55%). Such a control system is very demanding on the battery; in this simulation, the currents are shuffled at a IOC rate. Therefore, a practical implementation of this system would require a larger battery pack to reduce peak currents.
Finally, in the load-following series hybrid, the internal combustion engine tries to follow the road load as closely as possible, while still optimizing the use of the internal combustion engine to minimize fuel consumption. In this vehicle, the current usage drops as compared to the series thermostat. Note that the battery use in a fuel cell vehicle would be the same as in a series hybrid. If the load-following control strategy is implemented, the fuel cell is stressed more as its operating point changes, while for the thermostat control the battery pack is stressed more.
Recently, plug-in hybrids have received a great deal of attention. These vehicles act as a hybrid vehicle, where the battery pack can be recharged via the grid to supply some all-electric range. In these vehicles, the battery pack is discharged from a full charge to some target state of charge, where the vehicle is then operated as a regular hybrid. In simulations, as shown in Fig. 46.26, the target SOC is chosen to be 40%, as this value makes the most of the all-electric range, while ensuring that the life of the battery pack is not compromised by over-discharge.
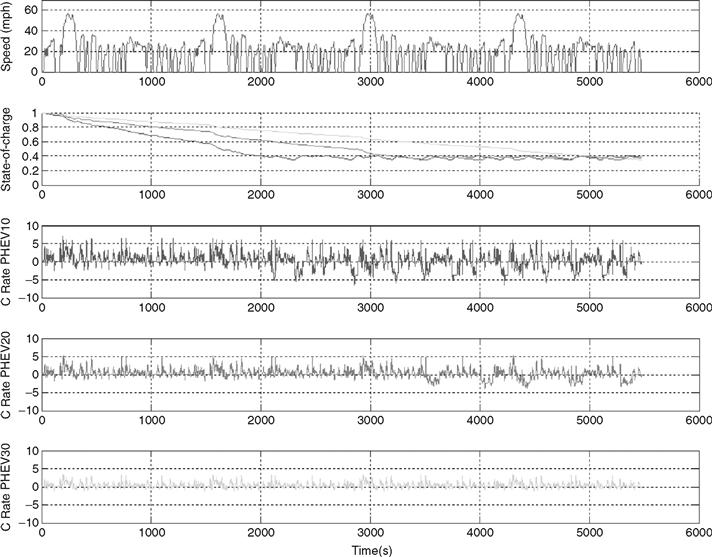
FIGURE 46.26 Series PHEV10, PHEV20, and PHEV30 (from top to bottom): drive cycle, state of charge, series PHEV10 current, normalized to the battery Crate, series PHEV20 current, normalized to the battery Crate, series PHEV30 current, normalized to the battery Crate.
Three vehicles are considered in this study, PHEV10, PHEV20, and PHEV30, which give a 10-, 20-, and 30-mile all-electric range, respectively. The vehicle of choice is the series hybrid, as it is capable of all-electric operation, wherein all of the propulsion power comes from the electric motor. As is clear, the C-rates are substantial on the PHEV10 and decrease for PHEV20 and PHEV30. PHEV10 proposes an interesting power versus energy density problem, where both the power and the energy density must be high. In contrast, as the all-electric range of the vehicle increases, high specific energy is critical.
46.7.2 Fuel Cells for Automotive and Renewable Energy Applications
For automotive applications, proton exchange membrane fuel cells (PEMFCs) appear to be most suitable compared to other fuel cell technologies, such as alkaline fuel cells (AFC) or solid oxide fuel cells (SOFC). This is due to the fact that the PEMFC working conditions at low temperature allow the system to start up faster than with those technologies using high-temperature fuel cells. Moreover, the solid state of their electrolyte (no leakages and low corrosion) and their high power density make PEMFCs extremely convenient for transport applications [28]. PEMFCs also provide a very good tank-to-wheel efficiency compared to heat engines. At the same time, PEMFCs need a great deal of auxiliary equipment as shown in Fig. 46.27.
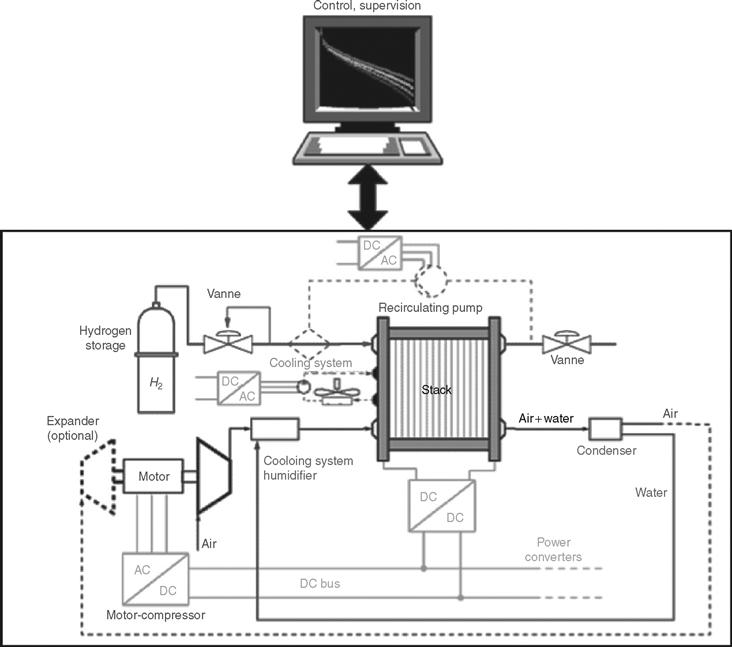
FIGURE 46.27 Proton exchange membrane (PEM) fuel cell system.
Automotive fuel cell technology continues to make substantial progress. However, fuel cell vehicles (FCVs) have not yet proven to be commercially viable nor have they been proven to be efficient. More recently, technological and engineering advancements have improved, simplified, and even eliminated components of the fuel cell system. The technical challenges and objectives for fuel cell systems in transportation applications have been well highlighted by the U.S. Department of Energy (DOE). Cost and durability are the major challenges for fuel cell systems. Air, thermal, and water management for fuel cells are also key issues. Power density and specific power are now approaching set targets. However, further improvements are needed to meet packaging requirements of commercial systems. The objective, by 2010, is to develop a 60% peak-efficient, durable, direct hydrogen fuel cell power system (including all auxiliaries) for transportation at a cost of $ 45/kW and, by 2015, at a cost of $ 30/kW, to become competitive with conventional internal combustion engine vehicles.
Another critical issue with fuel cells is their start-up times as well as operating temperatures. More recently developed fuel cell systems have been able to start and operate in temperatures ranging between –40°C and + 40°C. In these temperature conditions, start-up times of up to 50% of the rated power have been depicted: 30 s at –20°C and 5 s at 20°C. However, the size and the weight of current fuel cell systems have to be reduced drastically to meet the automotive compactness requirements, which apply both for the fuel cell stack and for auxiliary components such as the compressor, expander, humidifiers, pumps, sensors, and hydrogen storage [28]. The power mass density and the power volume density requirements for the fuel cell system are 650W/kg, 650 W/L, and 2000 W/kg or 2000 W/L, for the stack itself. The transient response of the stack is also a key issue and depends mainly on the air supply system inertia. Ideally, the transient response from 10 to 90% of the maximum power should be less than 1 s.
The hydrogen fuel is stored on-board and is supplied by a hydrogen production and fuelling infrastructure. For other applications (such as for distributed stationary power generation), hydrogen can be fuelled with reformate, produced from natural gas, liquefied petroleum gas, or renewable liquid fuels. For portable electronic devices in small equipment, methanol, and sometimes hydrogen, is the fuel of choice, using microfuel cell systems.
The objectives of hydrogen storage are the volume, weight, cost, durability, cycle life, and transient performance. On-board hydrogen storage solutions are summarized in Fig. 46.28. Some of the popular storage systems include high-capacity metal hydrides, high-surface area sorbents, chemical hydrogen storage carriers, low-cost and conformable tanks, compressed/cryogenic hydrogen tanks, and new materials or processes, such as conducting polymers, spillover materials, metal organic frameworks (MOFs), and other nanostructured materials. In general, there are two principal types of onboard storage systems. (1) On-board reversible systems, which can be refueled on-board the vehicle from a hydrogen supply at the fueling station. Compressed/cryogenic tanks, some of the metal hydrides, and high-surface area sorbents represent these solutions. (2) Regenerative off-board systems, which involve materials that are not easily refilled with hydrogen, while on-board the vehicle. These solutions include chemical hydrogen storage materials and some metal hydrides, where temperature, pressure, kinetics, and/or energy requirements are such that the processes must be conducted off-board the vehicle [28].
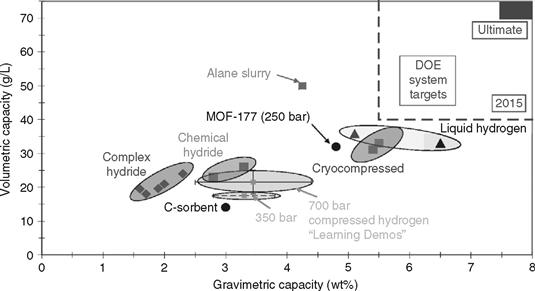
FIGURE 46.28 State-of-the-art hydrogen storage technologies and DOE system targets.
A majority of FCVs that are being proposed more recently use 350-bar hydrogen tanks, which have system gravimetric and volumetric capacities of 2.8–3.8% weight and 17–18 g/L, respectively. Cryo-compressed hydrogen and liquid hydrogen systems are also fast approaching U.S. DOE targets, as shown in Fig. 46.28. However, these solutions are still not affordable for mass production, as other requirements such as cost, hydrogen charging/discharging rates, and durability are also key issues for hydrogen storage. Liquid hydrogen storage is being demonstrated as workable, but with limitations. It provides both higher gravimetric and volumetric density advantages over compressed gas storage, but depicts issues with boil off and dealing with cryogenic liquids. Hence, it is not likely to be widely accepted by automobile manufacturers.
A more practical application for fuel cells is distributed generation (DG) power plants. The popular choices for DG are Phosphoric Acid FC, Molten Carbonate FC, Solid Oxide FC, and the Proton Exchange Membrane FC. Their applications in DG are briefly discussed here.
46.7.2.1 Phosphoric Acid Fuel Cell (PAFC)
Typically, PAFC units of the order 250–300 kW are available for commercial cogeneration, and more than 150 of such units are in operation worldwide. The typical efficiencies of such units are 40–50%, and the cost of production of power is approximately $ 4200/kW, which is beyond the economic margin unless a financial benefit can be demonstrated from the PAFC's emissions, power quality, and reliability merits [29].
46.7.2.2 Molten Carbonate Fuel Cell (MCFC)
MCFC operates at higher temperatures, of the order of 600° C, and was initially marketed for 1- to 5-MW plant applications. This system has a much higher efficiency compared to PAFCs with values reaching as high as 50%. The MCFC-based systems are typically rated at around 200 MW and exhibit an efficiency of about 75%. Upon further research, the MCFC's cost of power production is estimated to be as low as $1000/kW [29]. A hybrid MCFC/turbine cycle for maximizing the efficiency is shown in Fig. 46.29.
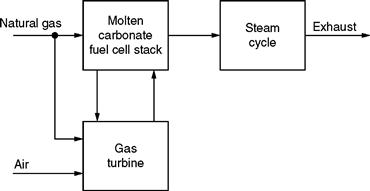
FIGURE 46.29 An MCFC-hybrid power cycle.
In such a system, about 70% of the power is produced by fuel cell and about 15% comes from the gas turbine generator.
46.7.2.3 Solid Oxide Fuel Cell (SOFC)
Comparatively speaking, a 100-kW MCFC system uses about 100–110 cells in stacks, whereas a similarly rated SOFC system would use about 1150 cells [29]. An example of a SOFC-based cogeneration plant is shown in Fig. 46.30.
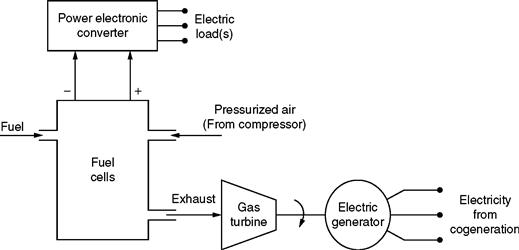
FIGURE 46.30 Typical layout of a SOFC-based cogeneration plant.
Here, pressurized air and fuel are the inputs to the SOFC because pressurized SOFC is being preferred for cogeneration purposes. The exhaust quality obtained by these units is comparatively higher. The hybrid fuel cell system, using a pressurized fuel cell, combined with the use of gas turbines, provides high efficiency and low emissions. A higher efficiency is gained by using the thermal exhaust from the fuel cell to power a noncombusting gas turbine.
46.7.2.4 Proton Exchange Membrane Fuel Cell (PEMFC)
This technology has attracted the attention of most utility companies as it has produced extremely low-cost power compared to other fuel cells. The cost of power production in PEMFC-based automobiles is as low as $ 100–$ 150/kW, which provides a competitive potential for stationary power production. It is expected that a successful market for PEMFC will have a significant impact on power generation because it could shift the primary role of the present-day grid to back up and peaking power [29]. In addition, PEMFCs find applications in cogeneration, in providing premium power, and in households.
It is apparent that several fuel cell types have strong potentials for entering the DG market. They can basically provide cost-effective cogeneration, grid support, and asset management. Also, long-term plans for fuel cell are underway with advanced designs for combined-cycle plants, which could eventually compete for a share of the DG market.
46.7.3 Fuel-Cell-Based Hybrid DG Systems
Individual fuel cell units ranging from 3 to 250 kW can be used in conjunction with high-speed microturbines, for high-power DG applications. The other popular DG technology is the PV power generation system, which is suited to provide up to 250 kW of power. These topologies are discussed in detail here.
46.7.3.1 Fuel Cell/Microturbine Hybrid DG System
Emission specification for the pressurized SOFC design is less than 1.0 ppm (parts per million) NOx and almost zero level of SOx. Another unique advantage of this unit is that a small percentage (about 15%) of fuel is wasted. The exhaust thermal energy is used to drive the microturbine. The hot exhaust from the plant supplants the microturbine combustor during the normal steady operation. It must be noted here that micro-turbine forms no additional pollutants [29]. The SOFC type of fuel cell is chosen for this application as it operates at the highest known temperature among fuel cells, at about 1000°C, and can be operated at high pressure. All these features are added up to provide additional thermal and electrical efficiency for the hybrid unit.
A diagrammatic representation of such a unit is shown in Fig. 46.5. Typical rating of such a hybrid system is about 250 kW and efficiencies of greater than 60% are targeted for the future. An important point to be noted here is that the fuel cell supplies about 80% of the output power, whereas the microturbine supplies the remaining 20%. Hence, micro-turbine functions primarily as a turbocharger for SOFC, with additional shaft power coming from microturbine for electrical power generation.
The National Critical Technologies (NCT) panel has identified fuel cells and microturbines as 2 of 27 key technologies in the United States for maintaining economic prosperity and national security. Several utilities facing with the dilemma of increasing transmission capacity are opting for DG technology. Such efficient packages of about 250-kW size could avoid the need to increase transmission capacity for years to come.
46.7.3.2 Fuel Cell/Photovoltaic (PV) Hybrid DG System
Fuel cells are attractive options for intermittent sources of generation such as PV, because of their high efficiency, fast response to loads, modularity, and fuel flexibility. Such a system is able to smoothen the PV problem of intermittent power generation by utilizing the fast ramping capabilities of fuel cells. Unlike batteries, which get discharged after a short time of operation, fuel cells can continuously provide the required amounts of power as long as the reactants (fuel + air) are supplied. Thus, the quality of power fed to the utility system by the hybrid system is of improved nature. A simple schematic of a PV-fuel cell hybrid system is depicted in Fig. 46.31.
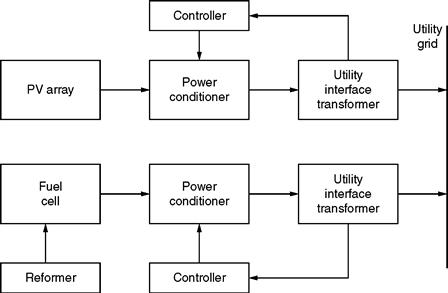
FIGURE 46.31 Block diagram of a fuel cell-PV hybrid system.
Figure 46.31 illustrates a grid-connected PV-fuel cell power plant including two feedback controllers, which basically can control the power conditioner switches. These power electronic switches, in turn, control the maximum power point and active and reactive power flows. In Fig. 46.31, the hybrid system consists of a PV array, a fuel cell stack, a reformer for purifying the hydrocarbon-based fuel, and power conditioners, which consist of dc–dc and dc–ac power electronic converters. The PV generator operates independently and is controlled to produce maximum available solar power. The fuel cell generating system is used as a supplement to this PV system to meet the system's power demand [29].
The PV array in Fig. 46.31 is made up of 80–100 series-connected and 450–500 parallel-connected solar modules, which produces 1.5–2 MW of power at 1400 V. In contrast, the fuel cell system made up of a PAFC unit generates about 2 MW and satisfies the system's demand for active and reactive power. Such a combination of fuel cells with PV arrays proves to be feasible for solving the inherent problems of standalone PV systems. Furthermore, because conventional fossil fuel energy sources are diminishing at a fast rate, such energy sources are attracting even more attention from utility companies. Much research is being devoted to such hybrid systems to bring down their O&M costs and render them favorable over conventional gas turbines and diesel engines.
46.8 Conclusions
This chapter dealt with the electrical characteristics and modeling techniques of major types of renewable energy systems and competent energy storage devices, namely batteries, fuel cells, PV cells, ultracapacitors, and flywheels. The introduced models can easily be simulated and validated for their performance by running a simple computer simulation. In addition, this chapter summarized the various up-and-coming applications for renewable energy systems and storage devices, thus making their modeling and simulation studies worthwhile. Future research and development work includes hardware-in-the-loop (HIL) implementation of the various topologies with novel control strategies for hybrid energy storage systems.
REFERENCES
1. Chalk SG, Miller JF. Key challenges and recent progress in batteries, fuel cells, and hydrogen storage for clean energy systems. Journal of Power Sources. September 2006; vol. 159(no. 1):73–80.
2. Sorensen B. Renewable Energy. 3rd ed. London, UK: Academic Press; August 2004.
3. Williams BR, Hennessy T. Energy oasis. Power Engineer. February 2005; vol. 19(no. 1):28–31.
4. Kreith F, Goswami DY. Energy Conversion. Boca Raton, FL, USA: CRC Press; 2007.
5. Emadi A, Williamson SS. Status review of power electronic converters for fuel cell applications. Journal of Power Electronics. October 2001; vol. 1(no. 2):133–144.
6. Williamson SS, Rimmalapudi SC, Emadi A. Electrical modeling of renewable energy sources and energy storage devices. Journal of Power Electronics. April 2004; vol. 4(no. 2):117–126.
7. Jiang Z, Dougal RA. A compact digitally controlled fuel cell/battery hybrid power source. IEEE Trans. Industrial Electronics. June 2006; vol. 53(no. 4):1094–1104.
8. Todorovic MH, Palma L, Enjeti PN. Design of a wide input range DC–DC converter with a robust power control scheme suitable for fuel cell power conversion. IEEE Trans. Industrial Electronics. March 2008; vol. 55(no. 3):1247–1255.
9. Ortuzar M, Moreno J, Dixon J. Ultracapacitor-based auxiliary energy system for an electric vehicle: implementation and evaluation. IEEE Trans. Industrial Electronics. August 2007; vol. 54(no. 4):2147–2156.
10. Lemofouet S, Rufer A. A hybrid energy storage system based on compressed air and supercapacitors with maximum efficiency point tracking (MEPT). IEEE Trans. Industrial Electronics. June 2006; vol. 53(no. 4):1105–1115.
11. Ise T, Kita M, Taguchi A. A hybrid energy storage with a SMES and secondary battery. IEEE Trans. Applied Superconductivity. June 2005; vol. 15(no. 2):1915–1918.
12. Tao H, Duarte JL, Hendrix MAM. Multiport converters for hybrid power sources. In: Proc. IEEE Power Electronics Specialists Conf.. June 2008: 3412–3418.
13. Henson W. Optimal battery/ultracapacitor storage combination. Journal of Power Sources. April 2008; vol. 179(no. 1):417–423.
14. Zheng JP, Jow TR, Ding MS. Hybrid power sources for pulsed current applications. IEEE Trans. Aerospace and Electronic Systems. January 2001; vol. 37(no. 1):288–292.
15. Jin K, Ruan X, Yang M, Xu M. A hybrid fuel cell power system. IEEE Trans. Industrial Electronics. April 2009; vol. 56(no. 4):1212–1222.
16. Briat O, Vinassa JM, Lajnef W, Azzopardi S, Woirgard E. Principle, design and experimental validation of a flywheel-battery hybrid source for heavy-duty electric vehicles. IET Electric Power Applications. September 2007; vol. 1(no. 5):665–674.
17. Shuai L, Corzine KA, Ferdowsi M. A new battery/ultracapacitor energy storage system design and its motor drive integration for hybrid electric vehicles. IEEE Trans. Vehicular Technology. July 2007; vol. 56(no. 4):1516–1523.
18. Matsuo H, Wenzhong L, Kurokawa F, Shigemizu T, Watanabe N. Characteristics of the multiple-input DC—DC converter. IEEE Trans. Industrial Electronics. June 2004; vol. 51(no. 3):625–631.
19. Solero LL, Pomilio A. Design of multiple-input power converter for hybrid vehicles. IEEE Trans. Power Electronics. September 2005; vol. 20(no. 5):1007–1016.
20. Kutluay K, Cadirci Y, Ozkazanc YS, Cadirci I. A new online state-of-charge estimation and monitoring system for sealed lead-acid batteries in telecommunication power supplies. IEEE Trans. Industrial Electronics. October 2005; vol. 52(no. 5):1315–1327.
21. Affanni A, Bellini A, Franceschini G, Guglielmi P, Tassoni C. Battery choice and management for new-generation electric vehicles. IEEE Trans. Industrial Electronics. October 2005; vol. 52(no. 5):1343–1349.
22. Chen LR. A design of an optimal battery pulse charge system by frequency-varied technique. IEEE Trans. Industrial Electronics. February 2007; vol. 54(no. 1):398–405.
23. Kutkut NH, Wiegman HLN, Divan DM, Novotny DW. Design considerations for charge equalization of an electric vehicle battery system. IEEE Trans. Industry Applications. January 1999; vol. 35(no. 1):28–35.
24. Tolbert LA, Peng FZ, Cunnyngham T, Chiasson JN. Charge balance control schemes for cascade multilevel converter in hybrid electric vehicles. IEEE Trans. Industrial Electronics. October 2002; vol. 49(no. 5):1058–1064.
25. Baughman AC, Ferdowsi M. Double-tiered switched-capacitor battery charge equalization technique. IEEE Trans. Industrial Electronics. June 2008; vol. 55(no. 6):2277–2285.
26. Cassani PA, Williamson SS. Status review and suitability analysis of cell-equalization techniques for hybrid electric vehicle energy storage systems. IEEE Power Electronics Society Newsletter. Second Quarter 2008; vol. 20(no. 2):8–12.
27. Emadi A, Rajashekara K, Williamson SS, Lukic SM. Topological overview of hybrid electric and fuel cell vehicular power system architectures and configurations. IEEE Trans. Vehicular Technology. May 2005; vol. 54(no. 3):763–770.
28. Blunier B, Pucci M, Cirrincione G, Miraoui A. A scroll compressor with a high-performance induction motor drive for the air management of a PEMFC system for automotive applications. IEEE Trans. Industry Applications. November 2008; vol. 44(no. 6):1966–1976.
29. Williamson SS, Emadi A, Shahidehpour M. Distributed fuel cell generation in restructured power systems. In: Proc. IEEE Power Engineering Society General Meeting. June 2004: 2079–2084002E.