Appendix B

The Aerospace Engineer’s Formula Sheet

B.1 Cost Analysis

Quantity discount factor:

image

Number of engineering manhours:

image

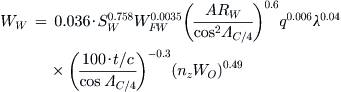
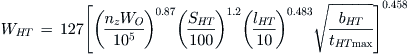
Number of tooling manhours:

image

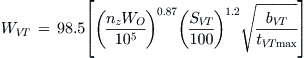
Number of manufacturing labor manhours:

image

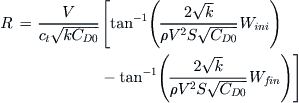
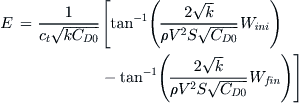
Break-even analysis:

image

B.2 Constraint Analysis

T/W for a level constant velocity turn:

image

T/W for a desired specific energy level:

image

T/W for a desired rate-of-climb:

image

T/W for a desired T-O distance:

image

T/W for a desired cruise airspeed:

image

T/W for a service ceiling:

image

CLmax for a desired stalling speed:

image

B.3 Weight Analysis

Design gross weight:

image

Useful load:

image

W0 consists of:

image

Fuel weight ratio:

image

Empty weight ratio:

image

This can be solved for W0:

image

Sailplanes:

image

Powered sailplanes:

image

Light Sport Aircraft (land):

image

Light Sport Aircraft (amphib):

image

GA single engine:

image

GA twin piston:

image

GA twin turboprop:

image

Agricultural:

image

Wing Weight

Raymer:

image

Nicolai:

image

Horizontal Tail (HT) Weight

Raymer:

image

Nicolai:

image

Vertical Tail (VT) Weight

Raymer:

image

Nicolai:

image

Fuselage Weight

Raymer:

image

Nicolai:

image

Main Landing Gear Weight

Raymer:

image

Nicolai:

image

Nose Landing Gear Weight

Raymer:

image

Installed Engine Weight

Raymer:

image

Nicolai:

image

Fuel System Weight

Raymer:

image

Nicolai:

image

Flight Control System Weight

Raymer:

image

Nicolai:

image

image

Hydraulic System Weight

Raymer:

image

Avionics Systems Weight

Raymer:

image

Nicolai:

image

Electrical System

Raymer:

image

Nicolai:

image

Air-conditioning and Anti-icing

Raymer:

image

Nicolai:

image

Furnishings

Raymer:

image

Nicolai:

image

Center of gravity:

image

CG in terms of %MGC:

image

B.4 Power Plant

The Basics of Energy, Work, and Power

Image

UK system (T in lbf, V in ft/s):

image

SI system (T in N, V in m/s):

image

To convert torque and RPM to SHP:

image

Gagg and Ferrar model:

image

Use the Mattingly method to estimate the effect of airspeed and altitude on the thrust of gas turbine engines.
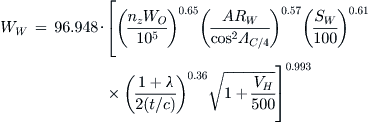
Electric Power

Image

B.5 Wing Planform

Image

General lift curve slope:

image

The Law of Effectiveness:

image

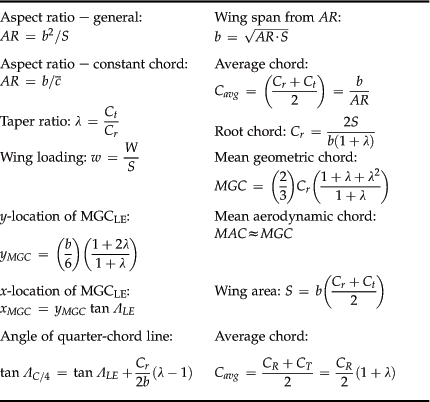
METHOD 1: Empirical estimation for straight wings:

image

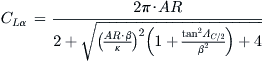
METHOD 2: Empirical estimation for swept wings:

Raymer:

image

Brandt:

image

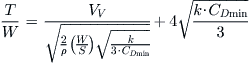
METHOD 3: Douglas method:

image

B.6 Tail Sizing

Horizontal tail volume:

image

Vertical tail volume:

image

HT dependent tail arm:

image

VT dependent tail arm:

image

HT and VT dependent tail arm:

image

B.7 Lift and Drag

Image

B.8 The Propeller

Power coefficient:

image

Thrust coefficient:

image

Torque coefficient:

image

Power-torque relation:

image

Propeller efficiency:

image

Propeller thrust:

image

Thrust quadratic spline:

image

Ideal efficiency:

image

Static thrust, TSTATIC:

image

Corrected static thrust:

image

B.9 The Atmosphere

Image

B.10 Airspeeds

Calibrated airspeed:

image

Equivalent airspeed

image

True airspeed:

image

Mach number:

image

Speed of sound:

image

B.11 Take-off

Torenbeek’s balanced field length:

image

Acceleration on a flat runway:

image

Acceleration on an uphill slope γ:

image

Lift-off speed:

image

Time to lift-off:

image

Ground run:

image

Ground run for piston props:

image

Rotation distance:

image

Climb angle:

image

Transition distance:

image

Transition height:

image

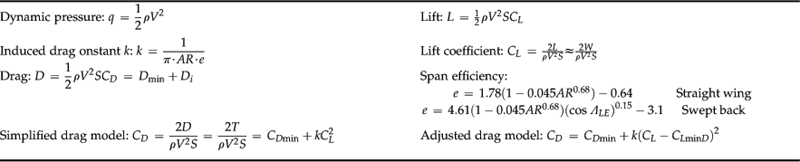
B.12 Climb, Cruise, and Maneuvering Flight

Jets in climb:

image

Propellers in climb:

image

Rate-of-climb:

image

General angle-of-climb (AOC):

image

Min/max airspeed:

image

Stalling speed:

image

Level stalling speed at load factor n:

image

Stalling speed at angle of bank ϕ:

image

Minimum thrust required, VTRmin, or best glide speed, VBG, VLDmax:

image

Max L/D:

image

Carson’s airspeed:

image

Power required:

image

Bank angle:

image

Load factor:

image

Turn radius:

image

Time to turn ψ degrees:

image

Turn rate in radians/sec:

image

Thrust required at a load factor n:

image

Load factor that can be sustained at a given thrust T and airspeed V:

image

Airspeed for a given CL:

image

Max sustainable load factor:

image

Maximum sustainable turn rate, image:

image

Minimum sustainable turning radius:
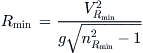
image

where: image = load factor and image = airspeed for minimum turning radius

Maximum level bank angle:

image

Specific excess power:

image

Specific energy and height:

image

B.13 Range and Endurance

Range profile 1:

image

Range profile 2:

image

Range profile 3:

image

Endurance profile 1:

image

Endurance profile 2:

image

Endurance profile 3:

image

TSFC for a jet:

image

where cjet = SFC for a jet

TSFC for a piston engine:

image

where cbhp = SFC for a piston

Specific range:

image

..................Content has been hidden....................

You can't read the all page of ebook, please click here login for view all page.
Reset
3.133.108.241