Designing Experiments
Performance analysis and optimization is a data-driven endeavor. It then follows that the work’s success or failure depends on its ability to collect accurate data. Just as the correct data will lead the project to the correct conclusions, incorrect or misleading data will lead the project to incorrect conclusions. Therefore, it is crucial to understand how to design experiments that produce accurate data.
Unfortunately, errors in data collection are very easy to overlook and may not manifest themselves until much later in the project. These issues often are a result of the inherent complexity of modern computing, such as the complex interactions between hardware and software or between shared resources utilized by multiple processes simultaneously. While it isn’t possible to always mitigate these issues, it is still important to quantify and understand their impact on the data.
5.1 Choosing a Metric
In Chapter 4, the importance of measurement was highlighted throughout the performance workflow. In the early stages, such as defining the problem, the focus rests on choosing the proper measure of performance. These measures are referred to as metrics.
Many different metrics exist, but there are two popular categories for performance metrics, either metrics that measure the cost of performing an operation once or metrics that measure how often that operation can occur during a given interval. Metrics in the first category, when measuring time, are often referred to as measuring latency. Metrics in the second category are often referred to as measuring throughput.
To illustrate this point, consider two metrics for measuring graphics rendering performance, frame time and frame rate. Since the frame time metric measures the cost, in time, of performing one operation, rendering a frame, it would fall into the first category. Since the frame rate, measured in frames per second, measures how many operations, frame renders, can occur for a given interval, one second, it would fall into the second category.
When selecting a metric, it is important to choose a metric at an appropriate level of detail, which is dictated by the component being measured. For example, when comparing the performance of two algorithms for a given CPU pipeline, clock cycles is an appropriate level of detail. On the other hand, when comparing graphics rendering performance, clock cycles would probably be too low-level of a detail.
All metrics fall into one of three categories in terms of their interpretation, higher is better (HIB), lower is better (LIB), or nominal is better (NIB). As the reader might expect, when comparing two measurements for an HIB metric, the higher value is the better performing. HIB and LIB metrics are far more common than NIB metrics, in which neither too high of a value nor too low of a value is ideal.
5.2 Dealing with External Variables
As mentioned in Section 4.4, it is important when benchmarking to reduce exposure to external variables that can impact performance. When designing an experiment, there are two types of external variables to consider, the controllable and the uncontrollable.
5.2.1 Controllable External Variables
Controllable external variables are simply variables whose effects can be completely mitigated, and thus won’t affect performance measurements. The effects of some external variables can be discarded by controlling when data collection begins and ends. Other effects require engineering small controlled scenarios, often referred to as microbenchmarks.
For example, consider how to accurately measure the time required for a web browser to render a HTML page. First, let’s define our operation, “rendering an HTML page,” to include parsing an HTML file into the necessary internal data structures, and then producing a rendered image. The real-world use case for this feature most likely involves:
2. Network initialization (DNS host lookup, TCP handshake, and so on)
3. Retrieve multiple remote resources
4. Parse resources into internal data structures
5. Render data structures into rendered webpage
6. Displaying rendered webpage to user
As described in Section 4.4, experiments should be fully automated, requiring no human interaction, and thus Item 1 should be eliminated from the experiment. This can be achieved by programmatically invoking the next steps for a fixed workload, or by starting the data collection after the user has submitted a query. The first controllable external variable, the human, has been mitigated.
Now consider the next two steps, which retrieve the remote resources. Each of these steps requires interaction with networked computers, thus exposing the experiment to variance from the network. For instance, one run of the experiment might occur while the network is suffering from heavy congestion, thus elongating measured time. Or perhaps after the first fetch, the resources will be cached, making their subsequent retrievals faster, and thus reducing measured time. Depending on what aspects of this use case are being measured, there are a couple different ways to avoid introducing this variance.
One potential method for shielding our experiment from these disparities is to create a private closed network for testing. This allows for significant control over network bandwidth, congestion, and other network variables. In fact many complex situations, such as heavy congestion, can be simulated on such a network. However for our specific example, our measurements aren’t dependent on exact network interactions, therefore this type of setup is overkill.
Another method for avoiding the network variance is to only start data collection after all the network resources have been downloaded. Unfortunately for our example, parsing the HTML file can trigger other resources to be downloaded. As a result, the solution is to bypass the network and serve all the content locally from the disk. The second controllable external variable, the network, has been mitigated.
While the variability of disk performance is significantly less than than the variability introduced by the network, it still can have a large impact on results. Both spinning platter and solid state drives are huge sources of variability. One reason for this is the amount of buffering and caching utilized at both the software and hardware layers. Assuming the dataset is small enough, the disk can be removed from our measurements by serving them from memory.
There are two primary techniques for accomplishing this, either copying the files into a RAM-backed filesystem, like tmpfs, or by leveraging the mmap(2) system call.
An advantage of the first technique, using tmpfs, is that no code modifications are required. This is because tmpfs files are accessed through the normal VFS operations, such as open(2) and read(2), just like a disk-backed filesystem. In order to utilize tmpfs, a mount point must be created, the files must be copied to that location, which effectively loads the files into memory, and then the application can interact with the files stored at that mount point.
Many Linux distributions maintain a tmpfs mount at /dev/shm/. Some distributions also use tmpfs for /tmp/. This can be easily verified by running:
Adding a tmpfs mount point is as simple as running:
The second technique, using the mmap(2) system call, allows an application to map files or anonymous pages into the process’s address space. This then returns a pointer to the beginning of the file’s memory address, allowing for the application to manipulate it, like it would any data in memory. Paging in Linux is performed lazily, that is, the page mappings are added to the process’s page tables, but the data isn’t retrieved from disk until the first page fault to that page. To avoid this page fault overhead from occurring during the measurements, use the MAP_POPULATE flag for mmap(2), which causes the pages to be loaded immediately.
Serving our HTML resources from memory, as opposed to the network or disk, will greatly decrease the variance present in our experiments. If the resources are small enough to fit into the LLC, it’s possible to go even further, by iterating the data to warm the cache. This ensures that memory accesses never actually hit memory during the measurements. Of course, this assumes that the measurement is focusing on the processor pipeline efficiency, for an algorithm that is invoked with cache warm data. Data can still be served cache cold from memory by ensuring cache line alignment and using the clflush or nontemporal store instructions.
Now that our microbenchmark has accounted for variance in Items 1 through 4, it’s time to look for controllable sources of variance during the actual rendering measurement. Variance can be introduced by CPU power-saving features, such as P and C states, as well as some features designed to improve CPU performance, for example, Intel® Turbo Boost and Intel® Hyper-Threading Technology. Often these features can be temporarily disabled in the BIOS. The author doesn’t recommend disabling them for any longer than the test duration.
The variance introduced via P states and Intel Turbo Boost stem from the possibility of varying clock frequencies between measurement runs. For instance, the clock frequency could be 800 MHz for one run, and 1.6 GHz for another. In the deeper C states, such as C6, the caches are powered down and thus invalidated, causing previously warm caches to turn cold. If P states can not be disabled, the Linux kernel’s cpufreq frequency scaling driver, CONFIG_CPU_FREQ, can be used in conjunction with the performance governor. This will keep the CPU frequency constant between tests.
Another source of variance is CPU migrations, where the process moves from executing on one processor to another, again leading to situations where the cache state suddenly changes. Migrations can be avoided by pinning the process to an individual CPU. This can be done either with the taskset command or programmatically via the sched_setaffinity system call.
Variance can also be introduced by running the benchmark on a system running other processes that are consuming significant amounts of resources. This type of system is often referred to as a noisy system. These other processes can lead to issues such as increased CPU migrations or thermal issues. One way to mitigate this issue is to boot the Linux kernel in single user mode, by adding “single” to the kernel command-line, or setting the init program to a shell, by adding init=/path/to/shell to the kernel command-line. Once the system has booted to this minimal configuration, the benchmark can be run without interference from other processes. If the benchmark requires other programs to run, such as a graphical application requiring an instance of Xorg running, those will need to be started manually.
5.2.2 Uncontrollable External Variables
As mentioned in Section 4.4, it is important, when benchmarking, to reduce exposure to external variables that can affect performance. However, when designing experiments, it is also necessary to recognize that many external factors are outside of our immediate control.
Since these factors cannot be mitigated, they must be accounted for in the design of the experiment. To accomplish this, the benchmark should be run multiple times, and then these multiple data points should be analyzed to quantify the effects of the external variables on the results.
The number of data points required to be collected, in order to provide an accurate measurement, depends on how significantly the benchmark is affected by the uncontrollable variables. As a general rule of thumb, measurements at a smaller level of granularity will require more runs than measurements at a higher granularity. When in doubt, the author recommends erring on the side of collecting too many data points, which wastes time but provides a more accurate measurement, rather than too few, which saves time but provides a potentially misleading measurement.
As an aside, in statistics the distinction is made between calculations involving the population and calculations involving samples. The population represents the entire set of elements, whereas samples involve a subset of the population. To calculate the population mean of a benchmark would require averaging the result of every single run ever, an infinite set. Due to the impossible nature of this task, a sampling of the population set is used. Statistics are calculated from the sample set in order to reason about the properties of the population. The law of large numbers dictates that as the number of data points within the sample set increases, the sample’s behavior approaches the behavior of the total population (Renze and Weisstein, 2014).
The most common statistic for summarizing performance samples is the mean. The population mean is denoted μ, whereas the sample mean is denoted as ![]() . While most readers will be familiar with the algorithm for calculating the mean, the author includes it in Equation 5.1 for completeness.
. While most readers will be familiar with the algorithm for calculating the mean, the author includes it in Equation 5.1 for completeness.
However, it’s important to understand that the sample mean only estimates the population mean, given the snapshot of samples available. Different samples, representing the same population, may have significantly different means. In order to determine the accuracy of the sample mean’s estimation of the population mean, it is necessary to also calculate the sample variance. The sample variance estimates the dispersion of the population’s distribution. As the sample variance approaches zero, the members of the population move closer to one another, thus instilling more confidence in how well the sample mean estimates the population mean. As such, when reporting a mean, always also report the corresponding variance. Variance is typically expressed as its root, the standard deviation. The reason for reporting the standard deviation, as opposed to the variance, is that the standard deviation is in the same units as the mean, making it easier to reason about (Miller and Miller, 1998). The population variance is denoted σ2, whereas the sample variance is denoted as S2. Equation 5.2 is the formula for calculating the variance, while the standard deviation is simply the square root of the variance.
As an aside, the reader may be wondering why the dividend in Equation 5.2 is n − 1 rather than the intuitive value of n. The key insight here is that the sample variance estimates the population variance. Estimators can be categorized as unbiased, that is, the expected value of the statistic equals the estimated value, or biased. Obviously a statistic with the unbiased property is preferable to a statistic with the biased property (Miller and Miller, 1998). Because the sample mean, not the population mean, is used for calculating the variance, dividing the sample variance by n yields a biased estimator, whereas dividing by n − 1 yields an unbiased estimator. For more information, see “Bessel’s Correction” (Weisstein, 2014).
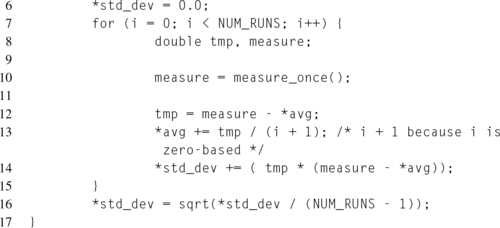
Note that in the variance formula, Equation 5.2, that each value is subtracted by the mean. This makes the calculation susceptible to floating point catastrophic cancelation, when a datum and the mean are very close. As the two close numbers are subtracted, the valid bits are essentially canceled out, leaving the number to be dominated by rounding errors (Goldberg, 1991). In order to prevent this, the author typically uses a different formula, first introduced by Welford (1962), which is less susceptible to catastrophic cancelation. An example implementation can be found in Listing 5.1.

This then raises the question of how to determine whether the difference between two samples, say one sample containing experiment runs for one algorithm and one sample containing experiment runs for a different algorithm, is caused by the variance within the data, or by an actual change in the population, that is, whether the change is statistically significant. To make this distinction, hypothesis testing is performed.
5.3 Timing
In order to write benchmarks, it is necessary to understand how to take accurate measurements. One of the most commonly taken measurements is that of time, that is, how long a snippet of code takes to execute a given workload. While the process for measuring time might seem like it should be fairly straightforward, computer timers are actually a fairly complex subject.
When using timers, or taking any other measurement, it is necessary to always be aware of the measurement resolution, that is, the smallest measurable element. For instance, if two algorithms are being measured, and the first algorithm runs for 1 ms and the second runs for 100 ms, but the timer used for measurement only has a resolution in seconds, then both algorithms will be recorded as taking zero seconds and the significant differences between the two algorithms will be lost.
Another important aspect to consider is whether the timer is monotonically increasing. A monotonically increasing timer always returns a result that is greater than or equal to previously returned results, and thus ensures that the timer never moves backwards. A timer without this guarantee could yield misleading results. In the best case, the backwards movement would lead to an arithmetic underflow when comparing the second reading against the first, and thus the results would be obviously wrong. In the worst case, the backwards movement would be slight enough to not cause an underflow, but would still provide an inaccurate reading, and thus the results would be silently corrupted.
It is also important to determine whether the timer measures wall time or process time. The wall time measures the total time that has elapsed during the measurement period. On the other hand, the process time only measures time accounted to the process being measured. For instance, if the execution of one process takes a total of 30 seconds, with 10 seconds of that time spent with the core executing a different process, the wall time would be 30 seconds, and the per-process time would be 20 seconds.
5.3.1 CPU Cycles
At the processor level, the CPU keeps track of time by counting the number of clock cycles. A cycle represents one iteration of the CPU core’s loop for fetching, decoding, executing, and retiring instructions. Because the CPU is a pipeline, each of these phases occur concurrently. So during one cycle, 16 bytes worth of instructions are fetched, instructions from the previous cycle’s fetch are decoded, or continue decoding, instructions decoded from an earlier cycle are executed, or continue executing, and instructions executed from an even earlier cycle are retired. The frequency of a processor estimates the number of these cycles that can occur per second, that is, a hertz. For example, a processor that operates at a frequency of 1.0 GHz, would perform one billion clocks each second.
The cycle count can be accessed either through the time-stamp counter or via PMU events. This section focuses on the time-stamp counter. For more information on the PMU events, see Chapter 6.
The time-stamp (TSC) counter is a MSR, IA32_TIME_STAMP_COUNTER_MSR, that holds the 64-bit number of clock cycles since the processor was booted. Originally, the TSC incremented at the actual CPU frequency, however on modern Intel® processors the TSC is invariant. Unlike the other methods for accessing the cycle count, the TSC does increment while the processor is halted. The TSC is also monotonically increasing, except in the case of 64-bit overflow.
Access to the TSC is provided via the RDTSC and RDTSCP instructions. Since the behavior for these instructions is the same for both 32- and 64-bit, the top 32 bits of the 64-bit counter are stored in the EDX register, while the lower 32 bits are stored in the EAX register. The RDTSCP instruction also returns the contents of the current hardware thread’s 32-bit IA32_TSC_AUX_MSR in the ECX register. Linux sets this MSR to the hardware thread’s logical id number, allowing for the code to also detect CPU migrations.
Due to the out-of-order execution of modern CPU pipelines, it is necessary to verify that reads to the TSC only count the instructions that are being benchmarked. In order to accomplish this, it is necessary to add two serialization points into the pipeline. A serialization point, in the form of a serializing instruction, will flush the pipeline and enforce that all previous instructions have finished executing, and that all future instructions haven’t started executing.
The RDTSC instruction performs no serialization, while the RDTSCP instruction verifies that all prior instructions have finished executing, but makes no guarantee about future instructions. In order to ensure accurate results, a fully serializing instruction, typically CPUID, is used. Listing 5.2 demonstrates two small inlined functions for accessing the TSC, along with their serializing CPUID instructions on lines 8 and 26. Note that line 9 uses a regular RDTSC instruction, since it is fully protected by the prior CPUID, whereas line 23 uses a RDTSCP instruction to ensure that the benchmarked code has finished executing before making the measurement. The final CPUID instruction on line 26 ensures that no later instructions begin executing before the TSC has been read.
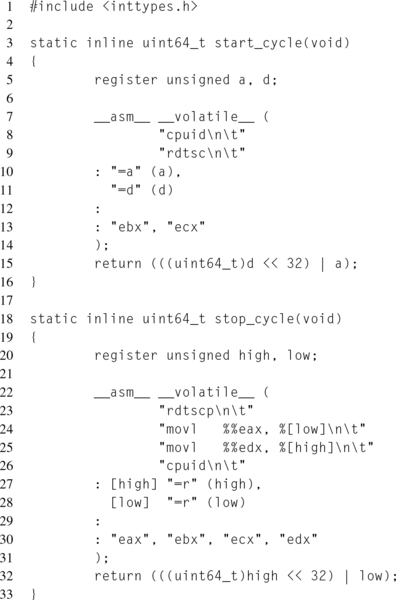
Notice that since the TSC is a MSR, and therefore duplicated per hardware thread, and increments at a fixed rate regardless of the core state, the cycle count corresponds to the wall time, not the process time.
Combining the functions defined in Listing 5.2, and the technique for computing the average and standard deviation from Listing 5.1, it would be possible to count the number of cycles for a given workload with the following code snippet:
5.3.2 Clock Time and Unix Time
As mentioned previously, the processor has no concept of time outside of clock cycles. Therefore, all of the interfaces for accessing time in the normal human units of time, such as seconds, are provided by the operating system, rather than the instruction set. The Linux kernel has a few different options for a clock source.
Traditionally, the Linux kernel ticked, that is, it would program the hardware timer to generate an interrupt at a given frequency, representing one tick. Each of these interrupts would cause the kernel to pause the current user space program, perform some accounting, and then choose the next process to run. This tick would occur at an interval selected at compile time, via the CONFIG_HZ Kconfig option. The possible configuration options for x86 were 1000, 350, 250, and 100 Hz. For instance, a kernel configured with HZ = 1000 would receive 1000 tick interrupts every second, limiting the resolution of the timers to 1 ms.
Selecting this frequency was a tradeoff between the number of interrupts generated, which keeps waking the processor up and therefore reduces the effectiveness of deep sleep states, and the ability to respond quickly to interactive tasks, due to the scheduler’s smaller time quantum. Each tick would increment the jiffies kernel variable. Since a tick corresponds to a precise time, that is, the value of a jiffy is equal to ![]() seconds, the number of jiffies could be used as a clock source.
seconds, the number of jiffies could be used as a clock source.
Nowadays, users who care about power consumption configure the Linux kernel to be tickless, that is, CONFIG_NO_HZ=Y. In a tickless kernel, interrupts only occur when needed, as opposed to a fixed interval. This prevents the tick interrupts from waking the CPU out of deeper sleep states as frequently, and thus saves power.
The available clock sources for the system can be queried through sysfs by reading available_clocksource and current_clocksource in /sys/bus/clocksource/ devices/clocksource0/. For instance:
The default clock source in the Linux kernel is now the TSC register described above in Section 5.3.1. The kernel uses a scale factor to convert cycles into nanoseconds. The exact scaling formula can be seen in the cycles_2_ns() function in ${LINUX_SRC}/arch/x86/kernel/tsc.c. In the case where the system TSC is not invariant, or demonstrates that it is not reliable, the High Precision Event Timer (HPET) is used instead.
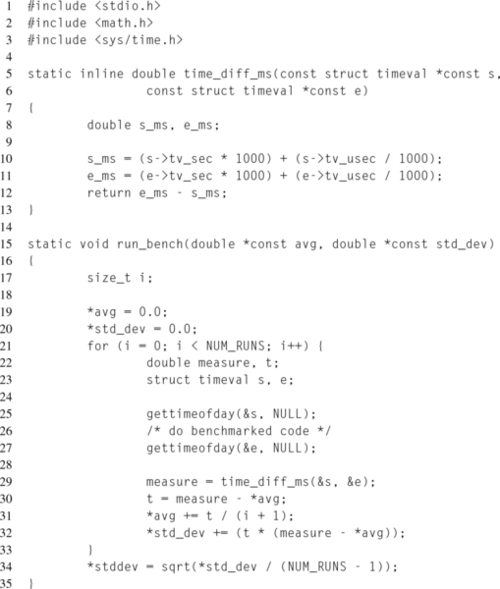
The clock source is then exposed to user space through a series of time system calls, including time(2), gettimeofday(2), and clock_gettime(2).
The time(2) system call returns UNIX time, that is, an integer representing the number of seconds since the UNIX Epoch, midnight, January 1, 1970. Because UNIX time is a single integer, it is very easy to work with. Unfortunately, it counts seconds, and therefore has a resolution of 1 second, making it impractical for exact measurements.
The clock_gettime(2) system call, provides access to a number of different clocks, each with a slightly different behavior with regards to what they measure. The resolution of each available clock can be measured with clock_getres(2). The following clocks are available:
CLOCK_REALTIME Measures wall time. Affected by changes to the system clock.
CLOCK_REALTIME_COARSE Similar to CLOCK_REALTIME, but trades precision for better performance.
CLOCK_MONOTONIC Measures the uptime of the system. Unaffected by manual changes to the clock, but is affected by updates via adjtime(3) and NTP. Does not include time in sleep state.
CLOCK_MONOTONIC_COARSE Similar to CLOCK_MONOTONIC, but trades precision for better performance.
CLOCK_MONOTONIC_RAW Similar to CLOCK_MONOTONIC, but unaffected by changes to changes in the system clock.
CLOCK_BOOTTIME Similar to CLOCK_MONOTONIC, but includes sleep states.
CLOCK_PROCESS_CPUTIME_ID Per-process CPU timer
CLOCK_THREAD_CPUTIME_ID Per-thread CPU timer.
The gettimeofday(2) system call is essentially identical to clock_gettime(2) using CLOCK_REALTIME. The timezone parameter is deprecated, and should be set to NULL.
5.4 Phoronix Test Suite
Aside from running one of the most popular websites dedicated to Linux performance news, http://www.phoronix.com, Phoronix Media also produces a framework designed specifically for benchmarking. This framework, known as the Phoronix Test Suite, provides a flexible architecture that is easily extendable through custom modules and benchmarks. While Phoronix typically focuses on Linux performance, the Phoronix Test Suite is cross-platform.
Leveraging the Phoronix Test Suite provides a significant number of advantages over writing a custom benchmark manager. One of these advantages is the presence of advanced benchmarking features, such as the ability to automatically rerun test runs with a high variance or the ability to leverage Git bisection in order to automatically pinpoint the source of performance regressions.
Another one of these advantages is the ability to generate publication-ready graphs for plotting results and displaying system information. These graphs are of considerable quality, highlighting not only the results, but also the relevant test and system configurations, as well as clearly labeling the metrics. The attention paid to producing high quality graphics for summarizing the benchmarking data highlights the fact that the Phoronix Test Suite is used for generating content for Phoronix news articles.
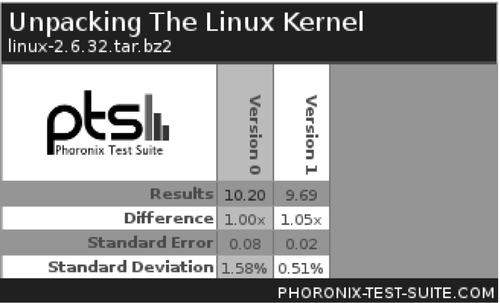
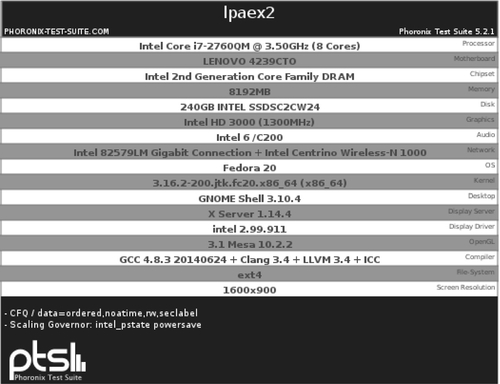
For instance, Figures 5.1–5.3 depict examples of the graphs created for displaying results. In this case, two different software configurations, “Version 0” and “Version 1” were tested with a single benchmark, “Unpacking the Linux Kernel.” For each benchmark that is run, one bar graph, such as the one in Figure 5.1, and one graphical table, such as the one in Figure 5.2, are generated. Depending on the test configuration, some of these graphs may be annotated at the bottom with relevant configurations, such as the compiler flags used to build the benchmark. Also, two summary graphics are created, one displaying the system configuration, shown in Figure 5.3, and one displaying a table summarizing all of the individual results. If two results from different configurations are merged, the system configuration will highlight differences between the two configurations.

As mentioned in Chapter 4, the ability to clearly communicate performance results is essential for influencing the decisions of others. The advantage of having high quality and professional looking graphs automatically generated, that can be placed on a website or attached to an email, cannot be overstated.
Another useful feature of the Phoronix Test Suite is the ability for automation, including a “batch” mode that runs preconfigured benchmarks without requiring any human interaction. This allows for integration into existing performance frameworks or the ability to utilize only some of the advanced functionality while handling the other aspects with custom implementations.
5.4.1 Running Phoronix
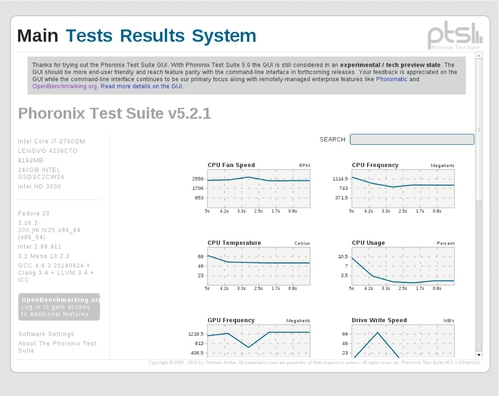
There are two interfaces available for controlling the Phoronix Test Suite, the command-line interface and the GUI, shown in Figure 5.4. This section focuses solely on the command-line interface, as the concepts introduced here also apply to the GUI, so it should be self-explanatory. All commands are multiplexed through the phoronix-test-suite shell script. A complete list of commands can be obtained by running the script without any parameters.
Each benchmark in the Phoronix Test Suite is represented by a corresponding test profile. This profile is responsible for defining how the benchmark will be installed, how the benchmark will be run, how the results will be parsed, and the metadata describing what the results mean. Multiple test profiles can be grouped together to form a test suite.
Included with the framework are a multitude of predefined test profiles and test suites, providing access to popular benchmarks. Table 5.1 samples some of the available benchmarks and their descriptions. Notice that in this list, there are two similar tests, “GZIP Compression” and “System GZIP Compression.” The Phoronix tests that lack the “System” designator are designed to hold software constant and test the differences in hardware. To accomplish this, these tests download and compile their own versions of software, rather than testing the versions installed by the Linux distribution. When making decisions based on tests, always double-check what is being measured.
Table 5.1
Examples of Available Phoronix Benchmarks
| Name | Type | Description |
| Apache Benchmark | System | Measures how many Apache requests per second a given system can sustain |
| BlogBench | Disk | Replicates load of a real-world busy file server with multiple threads of random reads, writes, and rewrites |
| Timed Linux Kernel Compilation | Processor | Measures how long it takes to build the Linux kernel |
| C-Ray | Processor | Measures floating-point performance via the C-Ray raytracer |
| Cairo Performance Demos | Graphics | Measures Cairo drawing performance |
| Gzip Compression | Processor | Measures how long it takes to compress a file using a downloaded gzip |
| System Gzip Compression | Processor | Measures how long it takes to compress a file using the system’s gzip |
| Ogg Encoding | Processor | Measures how long it takes to encode a sample WAV file to Ogg format |
| FFmpeg | Processor | Measures the system’s audio/video encoding performance |
| Idle Power Usage | System | Measures the power usage during system idle |
The full list of official tests can be retrieved by executing:
These test profiles, along with test results from the community, are available at http://www.openbenchmarking.org. After the Phoronix Test Suite has finished collecting the desired results, the option is available to upload those results to the OpenBenchmarking website, which publishes the results publicly. Along with the results, some system information, such as distro and software versioning, and hardware information are also published, allowing others to compare results between platforms of interest. Each result is assigned a unique result id, that can be used to reference that test and its results. Aside from hosting public results, the OpenBenchmarking website allows users to publish and share custom test profiles.
When passing tests to the phoronix-test-suite script, there are a number of different methods for referencing tests. Commands can usually perform their actions on one of more of:
Test Profile Command operates on the individual test.
Test Suite Command operates on every test profile contained within the group.
OpenBenchmarking.org ID Command operates on the same test profile or suite associated with the given result ID on OpenBenchmarking.org.
Test Result Command operates on the same test profile or suite associated with the given result name.
Additionally, test profiles and suites can be referenced by their file system path, relative to the appropriate Phoronix directories. This allows for the grouping of related items in subdirectories and for clarification of ambiguous requests.
Test profiles and suites are categorized as either local or official. This categorization serves to indicate where the test came from, and also to reduce ambiguity in the case of two tests with the same name. The directory structure for test profiles and suites also reflects this categorization. Under the directory for available test profiles and suites, two folders exist, local, which contains the local tests, and pts, which contains the official Phoronix tests. At the time of this writing, the Phoronix Test Suite only checks in those two directories for profiles during installation. Within those directories, and within the test results directory, custom directory hierarchies can be created in order to organize content.
For instance, consider the situation where there are two projects, project 0, and project 1. Each of these projects consists of three test profiles, test0, test1, and test2. In order to accomplish this, two project folders could be created within the local test profile directory, and then three test profile directories could be created within each of those folders. Because the names of the test profiles, test0, test1, and test2, are ambiguous, the full path, relative to the test profile directory, would be used to reference the individual tests, that is, local/project0/test0 and local/project1/test0.
By default, Phoronix stores all of the test profiles, test suites, and test results in ${HOME}/.phoronix-test-suite/. Tests are also typically installed into and execute from this directory. Inside ${HOME}/.phoronix-test-suite/, the following directories exist:
download-cache Contains local copies of remote files downloaded for testing
installed-tests Contains the installed benchmark executables and any runtime files required for testing
modules Contains available modules
openbenchmarking.org Contains any resources downloaded from the OpenBenchmarking website
test-profiles Contains the test profile definitions which are responsible for describing each test and performing the installation
test-suites Contains the test suite definitions
xsl Contains the eXtensible Stylesheet Language (XSL) files
Configuration
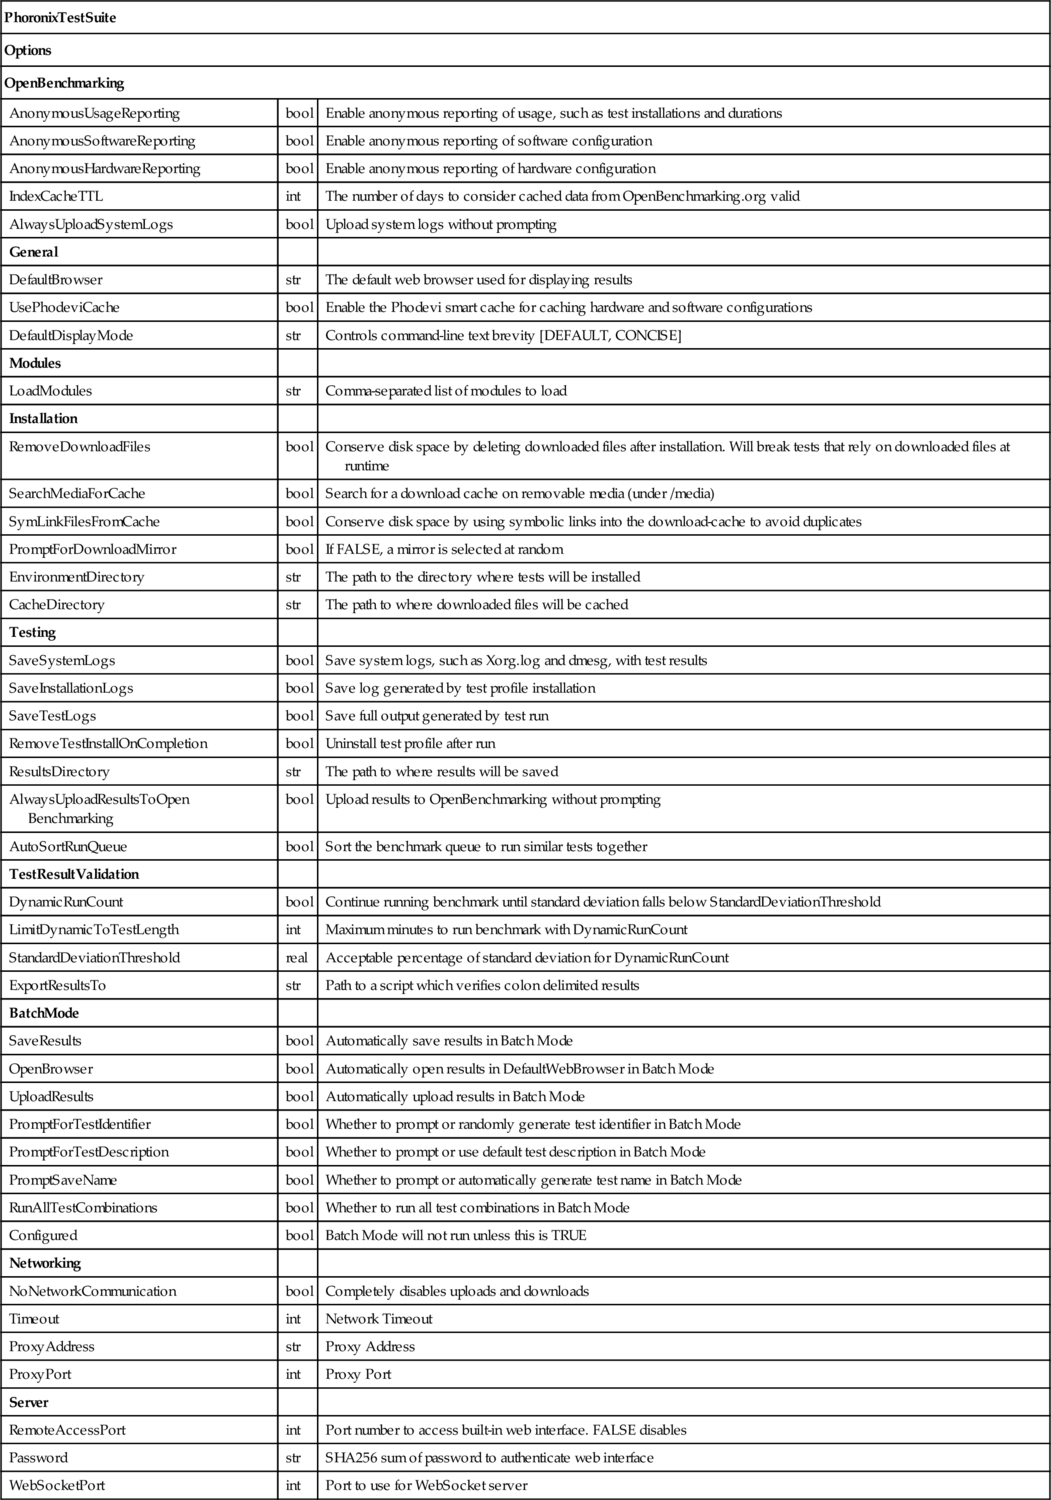
Before installing and running benchmarks, it is necessary to configure the framework. Almost all of the configuration options exposed by the Phoronix framework, as opposed to the individual tests, are controlled by the ${HOME}/.phoronix-test-suite/user-config.xml file. For reference, Table 5.2 documents all of the options exposed via this XML file.
Table 5.2
Schema of user-config.xml (Larabel, 2012)
| PhoronixTestSuite | ||
| Options | ||
| OpenBenchmarking | ||
| AnonymousUsageReporting | bool | Enable anonymous reporting of usage, such as test installations and durations |
| AnonymousSoftwareReporting | bool | Enable anonymous reporting of software configuration |
| AnonymousHardwareReporting | bool | Enable anonymous reporting of hardware configuration |
| IndexCacheTTL | int | The number of days to consider cached data from OpenBenchmarking.org valid |
| AlwaysUploadSystemLogs | bool | Upload system logs without prompting |
| General | ||
| DefaultBrowser | str | The default web browser used for displaying results |
| UsePhodeviCache | bool | Enable the Phodevi smart cache for caching hardware and software configurations |
| DefaultDisplayMode | str | Controls command-line text brevity [DEFAULT, CONCISE] |
| Modules | ||
| LoadModules | str | Comma-separated list of modules to load |
| Installation | ||
| RemoveDownloadFiles | bool | Conserve disk space by deleting downloaded files after installation. Will break tests that rely on downloaded files at runtime |
| SearchMediaForCache | bool | Search for a download cache on removable media (under /media) |
| SymLinkFilesFromCache | bool | Conserve disk space by using symbolic links into the download-cache to avoid duplicates |
| PromptForDownloadMirror | bool | If FALSE, a mirror is selected at random |
| EnvironmentDirectory | str | The path to the directory where tests will be installed |
| CacheDirectory | str | The path to where downloaded files will be cached |
| Testing | ||
| SaveSystemLogs | bool | Save system logs, such as Xorg.log and dmesg, with test results |
| SaveInstallationLogs | bool | Save log generated by test profile installation |
| SaveTestLogs | bool | Save full output generated by test run |
| RemoveTestInstallOnCompletion | bool | Uninstall test profile after run |
| ResultsDirectory | str | The path to where results will be saved |
| AlwaysUploadResultsToOpen Benchmarking | bool | Upload results to OpenBenchmarking without prompting |
| AutoSortRunQueue | bool | Sort the benchmark queue to run similar tests together |
| TestResultValidation | ||
| DynamicRunCount | bool | Continue running benchmark until standard deviation falls below StandardDeviationThreshold |
| LimitDynamicToTestLength | int | Maximum minutes to run benchmark with DynamicRunCount |
| StandardDeviationThreshold | real | Acceptable percentage of standard deviation for DynamicRunCount |
| ExportResultsTo | str | Path to a script which verifies colon delimited results |
| BatchMode | ||
| SaveResults | bool | Automatically save results in Batch Mode |
| OpenBrowser | bool | Automatically open results in DefaultWebBrowser in Batch Mode |
| UploadResults | bool | Automatically upload results in Batch Mode |
| PromptForTestIdentifier | bool | Whether to prompt or randomly generate test identifier in Batch Mode |
| PromptForTestDescription | bool | Whether to prompt or use default test description in Batch Mode |
| PromptSaveName | bool | Whether to prompt or automatically generate test name in Batch Mode |
| RunAllTestCombinations | bool | Whether to run all test combinations in Batch Mode |
| Configured | bool | Batch Mode will not run unless this is TRUE |
| Networking | ||
| NoNetworkCommunication | bool | Completely disables uploads and downloads |
| Timeout | int | Network Timeout |
| ProxyAddress | str | Proxy Address |
| ProxyPort | int | Proxy Port |
| Server | ||
| RemoteAccessPort | int | Port number to access built-in web interface. FALSE disables |
| Password | str | SHA256 sum of password to authenticate web interface |
| WebSocketPort | int | Port to use for WebSocket server |
Changes can be made by directly editing the file, or by executing:
If no user-config.xml exists, the phoronix-test-suite script will create one with the default values. So at any time, the configuration can be restored to the default values by either deleting the user-config.xml file, and letting the phoronix-test-suite script regenerate it, or by executing:
The basic formatting, colors, and watermarks for the result graphs can be customized by editing the style fields in ${HOME}/.phoronix-test-suite/graph-config.json.
Aside from these configuration files, there are about twenty environmental variables that can modify the behavior of the tests, result output, and so on.
For convenience, there is also an interactive command for configuring networking:
Installing Tests
Before any benchmarks can be run, they must first be installed. This operation is performed by executing:
For example, in order to install the three test profiles that measure boot time with Systemd:
First, Phoronix creates a lock file in the client’s temporary directory, entitled “phoronix-test-suite.active.” This serves to prevent multiple instances of Phoronix processes from interfering with each other.
Second, the test profile’s support_check.sh script runs to determine whether the benchmark is actually appropriate for the current system. For instance, in the previous example, the systemd boot time test profiles, this script checks whether the system uses systemd as the init program. If not, there is no point in attempting to install the test, since it has no meaning on this system. The exit status from the script is used to communicate whether the features needed by the test are supported.
Third, the list of test dependencies is checked against the currently installed software. For convenience, Phoronix integrates with the package managers of many popular Linux distributions, such as Fedora, Gentoo, and Ubuntu, in order to automate the dependency installation process. To facilitate this, the dependencies of each test profile are expressed with a generic name, which is then translated to the distro-specific package name via a predefined list. For instance, a test profile might require the generic “gtk-development” package, which will translate to “gtk2-devel” on Fedora, “x11-libs/gtk+” on Gentoo, and “libgtk2.0-dev” on Ubuntu. In the case where packages must be installed but the current user does not have the necessary privileges, the user will be prompted for their root password, and then the packages will be installed automatically. The generic package names and their corresponding package names for each package manager can be found in ${PTS_SRC}/pts-core/external-test-dependencies/xml/.
Fourth, a directory is created for the test installation. This directory will reside within the ${HOME}/.phoronix-test-suite/installed-tests directory, under either the pts, for official tests, or local, for custom tests, directories. For example, if the official test profile unpack-linux-1.0.0 is installed, it will be installed into ${HOME}/.phoronix-test-suite/installed-tests/pts/unpack-linux-1.0.0.
Fifth, any remote resources required for testing are downloaded. These resources typically include the benchmark’s workloads or source code. Phoronix supports checking both the file size and checksum in order to verify each file’s download integrity. Before each file is downloaded, the download cache is searched. If the file is found, and meets the integrity requirements, the download will be skipped and the file will be copied from the download cache into the test’s installation directory. By manually copying files into the download cache, tests can be installed and run on systems that lack a network connection. If the file is not found within the download cache, Phoronix will attempt to download it into the cache and then copy it into the test’s installation directory.
Sixth, the test profile’s install.sh script is executed. This script is responsible for creating the executable, typically a script, that will set up and perform the actual benchmarking, as well as setting up any prerequisites. For example, a common function of the installation script is to compile any downloaded code and then create the script that runs the benchmark.
Once this script has finished executing, the test is installed and ready to be run. If a test suite is referenced, this process will occur for every test profile contained within the test suite. If a local or OpenBenchmarking.org result is referenced, this process will occur for every test profile referenced within the test result.
Running Tests
Once a benchmark has been installed, it is ready to be run and for results to be collected. Running individual benchmarks or test suites can be accomplished by running
First, the Phoronix Test Suite will check to ensure that the selected benchmark, or benchmarks, are installed. If not, the user will be prompted whether they wish to install the tests or abort.
Second, the pre-test script, pre.sh, will be run, assuming it is present in the test profile. This allows the benchmark to set up the initial system state prior to execution. For example, this might involve starting a daemon or altering the system configuration.
Third, the test executable will be invoked repeatedly. The exact number of benchmark runs will depend on a few factors, such as whether DynamicRunCount is enabled in user-config.xml, the value of StandardDeviationThreshold in user-config.xml, and also the value of the TOTAL_LOOP_TIME environmental variable. In between each invocation of the benchmark’s executable, the interim test script, interim.sh, will run, assuming it exists in the test profile directory. This script allows the benchmark to clean up any state left over after each test, providing a clean slate for each run.
Fourth, the post-test script, post.sh, will be run, assuming it is present in the test profile. This allows for the benchmark to clean up any state initialized during the benchmark run. In general, any changes made to the system by the pre-test script should be reversed.
Finally, the results, along with the system logs, will be saved into the ResultsDirectory, with the directory named after the test name. Typically this directory will be ${HOME}/.phoronix-test-suite/test-results.
Inside each test result directory is a number of files that represent the system state during the test run, the results of the test, and the resources generated for summarizing the test results.
The system-logs directory contains a copy of various system logs from the time of execution. This includes files such as the full dmesg, the compiler version and configuration, the environment variables, the CPU information, and so on. Essentially a snapshot of relevant files in /proc and /var/log, this information allows for performance disparities in future results to be debugged. Additionally, if leveraging the Phoronix Test Suite as part of a larger performance infrastructure comprised of multiple machines, these files can be parsed to determine what configuration the results correspond to.
The results-graph directory contains a copy of each of the generated graphics for the test, each stored in Scalable Vector Graphics (SVG) format. Using a vector-based format, as opposed to a bitmap-based format, allows for the images to be scaled to various sizes, without losing image quality. For each test profile in the result, two images will be generated. A bar graph plot of the test results are seen in Figure 5.1 and a table summary of the results are seen in Figure 5.2. The names of these files correspond with the test numbers. So if the test was the xth test run, the plot will be called x.svg, and the table will be called x_table.svg.
Apart from the two images generated per test profile, two summary images are also created. An overview table, overview.svg, contains an entry for each test profile, summarizing the results. Also as shown in Figure 5.3, a table is created, systems.svg, that lists the system’s hardware information. If different pieces of hardware are compared, the differences in configuration are highlighted.
The raw results for each test profile are stored in an XML file. Similar to the test result image, the name of the file depends on the test number. For test number x, the results are stored in test-x.xml. Parsing this file allows for the raw results to be retrieved. Note that the file contains the average result and also the raw values for each test run. This is especially useful if using the Phoronix Test Suite along with a custom performance infrastructure, since all of the samples across multiple runs can be aggregated for reporting and analysis. Finally, all of the individual test results are combined into a single XML file, composite.xml, that contains all of the results.
Batch Mode
Running the Phoronix Test Suite in batch mode allows for operations, such as installing and running tests, to occur in a manner that requires no human interaction. This is especially useful if integrating into an automated performance infrastructure.
Before batch benchmarks can be run, the batch mode options must be configured. As shown in Table 5.2, the batch mode options are part of the PhoronixTestSuite.Options.BatchMode schema. If PhoronixTestSuite.Options.BatchMode. Configured is set to false, batch mode operations will fail with an error message stating that batch mode must first be configured. Because batch mode is not interactive, these configuration options dictate how the benchmarks are run.
Once configured, tests can be installed and run with:
5.4.2 Working with Results
Typically, when using the Phoronix Test Suite, the interesting data is not one specific test result, but a comparison of multiple test results, highlighting the performance delta between one or more changes. To accommodate this, Phoronix has commands for splicing and extracting test data from one result into another result.
Any of the test results posted to OpenBenchmarking.org can be downloaded locally with:
This downloads the full result, including the system-logs folder, which allows for researching the exact system configuration, the composite.xml file, containing all of the test results, and the graphs. These files are downloaded into the default test-results directory, with the directory named after the test id.
Multiple results, such as a local result and a result cloned from OpenBenchmarking.org, can be combined with:
If there is test overlap, that is, the same test was run in both results, those results will be merged onto the same graph. The test results being merged aren’t modified by the merge operation. Instead, a new result is created in the default test-results directory, starting with the name merge-.
5.4.3 Creating Custom Tests
Regardless of whether published or not published, adding custom tests to the default repertoire is very simple. Essentially, a test profile is a collection of XML files and executables, normally shell scripts, for performing installation and benchmarking.
First, create a new directory for the test profile in $HOME/.phoronix-test-suite/test-profiles/local. In this directory, all of the files needed for installing the test, except for any external resources, will be created.
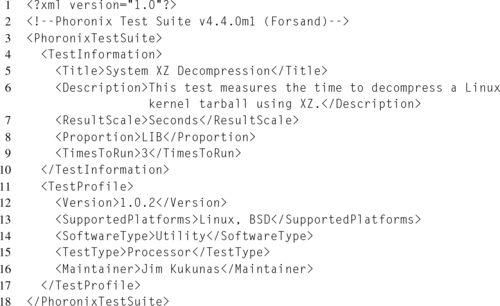
The heart of a test profile is the test-definition.xml file. This XML file describes not only the test metadata, such as the name and description, but also the required software dependencies, PhoronixTestSuite.TestProfile.External Dependencies, the executable for running the actual benchmark, PhoronixTestSuite.TestInformation.Executable, as well as data about the result metrics. The PhoronixTestSuite.TestInformation.ResultScale property is the label used for the metric, such as “seconds” or “MB/s.” The PhoronixTestSuite.TestInformation.Proportion property sets whether the metric is reported as “HIB” or “LIB”.
Due to the complexity of the test-definition.xml file, the author recommends simply copying one from any existing test profile, and then updating or adding fields as required. Listing 5.4 demonstrates a simple test definition.
If the test profile depends on a specific system configuration, create a support-check.sh script. This script runs before the test is installed in order to determine whether the test is applicable to the system. A positive return value from this script indicates that the test is not applicable for the current system configuration. Listing 5.5 demonstrates a simple support check script.

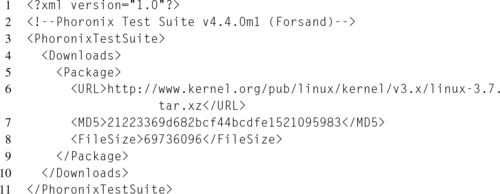
Next, if the test requires any external dependencies, a download manifest is created in downloads.xml. This XML file lists the URL, filename, filesize, and MD5 checksum for each required file. At install time, these files will be fetched from the URL, validated against the filesize and MD5 checksum, and then copied into the test profile directory under $HOME/.phoronix-test-suite/installed-tests/. Listing 5.6 demonstrates a simple download manifest.
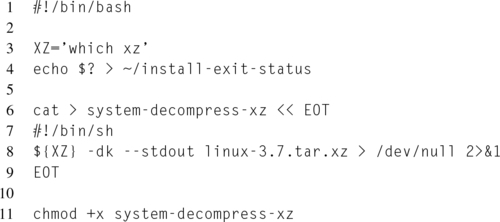
Next, create an install.sh script, which will carry out the actual installation of the test. Typically, this script is responsible for generating the shell script that will run the actual benchmark and redirect the results to the Phoronix result parser. Listing 5.7 demonstrates a simple install script. Notice how the executable benchmarking script, system-decompress-xz, is created on line 6. All of the test output is redirected to the $LOG_FILE environmental variable. This is very important, as only the output sent to $LOG_FILE will be parsed for results. Also, always remember to make the script executable, as seen on line 11.
Additionally, if pre.sh, interim.sh, or post.sh scripts are present in the test profile directory, these scripts will be executed before, between runs, and after the benchmark, respectively.
Finally, the last step is to define a results-definition.xml file. This XML file explains how Phoronix should parse the test output. Results can come either from the output of the benchmarking script, or from the Phoronix sensors. Listing 5.8 demonstrates a result definition that utilizes the time sensor to monitor the script’s duration.

Alternatively, the results definition can be sample output, or a snippet of sample output, from the benchmarking script, that is, the output that was written to the $LOG_FILE environmental variable. In the sample output, the numbers to be parsed out of the results are replaced with parser variables. Parser variables begin with a “#_” and end with a “_#.” Thus for the majority of cases, replace the one important result in the sample output with #_RESULT_#.
5.4.4 PHORONIX RESOURCES


