Business Modeling for Business Leaders
Abstract
This chapter is about VDML (Value Delivery Modeling Language), a relatively new specification from the Object Management Group (OMG). VDML supports business models that integrate capabilities, collaborations, and value creation to provide a robust representation of how the enterprise works at a level of abstraction suitable for understanding and analysis of business leaders. The chapter first describes the key concepts and relationships represented in VDML along with an overview of the basic graphical diagrams. It then describes how VDML supports the Value Networks of Verna Allee, the Business Model Canvas of Alex Osterwalder, and the Business Model Canvas of Peter Lindgren.
Keywords
VDML; Business model; Business design management; Business capabilities; Business collaboration; Business value
▪ Introduction
Business leaders are confronted with increasing business complexity. This complexity is compounded when there are initiatives that cross traditional organizational boundaries and shared capabilities contribute to the value streams of multiple lines of business. In addition, optimization of capabilities requires an enterprise-level perspective and involves more than just cost, quality, and timeliness of operations—it depends on customer value delivery.
This complexity challenges the ability of managers to anticipate the consequences of proposed changes and to provide clear direction for the implementation of strategic initiatives. Management of this complexity requires computer-based modeling. Furthermore, such models are needed for accountability and control, for business analysis and design, for planning business changes, and for solution of operating problems. Models must allow each community of interest to focus on particular aspects of the business without other details getting in the way. At the same time, all communities must be assured that they are sharing a consistent representation of the business. In addition, modeling must support analysis of “what-if” scenarios with consideration of different business designs as well as different products and markets.
VDML (Value Delivery Modeling Language) was adopted by the Object Management Group (OMG) to address these needs of business leaders. It models a conceptual business design with different points of view. It provides sufficient detail for understanding of how the business works, or will work, without getting into the intricacies of exceptions and variations that are resolved in operational design and management of the business operations.
VDML fills a conceptual modeling gap between top-management strategic planning and the operational-level design and management of the business. It brings together multiple dimensions of the business design so that a VDML model can represent a consistent integration of multiple factors. The level of detail supports the level of detail usually addressed by business leaders, but it also provides sufficient additional detail to validate a solution and to provide clear representation of the conceptual design of the business and consistent requirements for development of operational business processes and computer applications. Furthermore, the architecture of a VDML model supports the design of an efficient and effective business that exploits current computer and communications technologies. For example, capabilities are shared as services that can be engaged through secure, internet-based, service request technology supporting remote participants. Nevertheless, VDML can be used to model traditional system architectures and is particularly useful to identify embedded capabilities.
VDML does not specify the details of decisions and actions on individual units of production, but, instead, it statistically describes the flow of deliverables through activity networks per unit of production. At the same time, contributions of values are measured statistically for aggregation in value propositions. The aggregation of values can then be expressed in value propositions for different market segments or other stakeholders.
VDML also supports a broader perspective that includes customers, suppliers, and other business partners and the values they exchange in business networks. This provides for analysis of business models that rely on the participation of multiple business entities.
This chapter is about VDML. We will first examine the primary components of a VDML model, their relationships to each other, and their relationships to the business, followed by an overview of standard VDML graphical displays. Then we will consider VDML support for graphical displays that reflect Allee's Value Networks, Osterwalder's Business Model Canvas, and Lindgren's Business Model Cube.
VDML Key Concepts
The VDML language specification defines concepts and relationships used to represent the design of an enterprise. The fundamental purpose of an OMG modeling specification is to specify these concepts and relationships in such a way that when the language is implemented by different vendors, the models created with one implementation can be exchanged to function in a different VDML implementation.
This goal of interoperability extends to specification of the core VDML user interface so that it is the same when a model is moved from one VDML product to another. The developers of the VDML specification provided for a minimal set of user displays because it is expected that additional displays will be developed in response to needs of users that emerge as VDML implementations are used.
A VDML model may represent the design of a department within a company, a single company with customers and suppliers, or it may represent multiple companies, integrated to operate as an integrated, virtual enterprise with a joint purpose. VDML also supports modeling of conventional, silo-oriented business designs as well as an architecture based on integration of shared capabilities implemented as services.
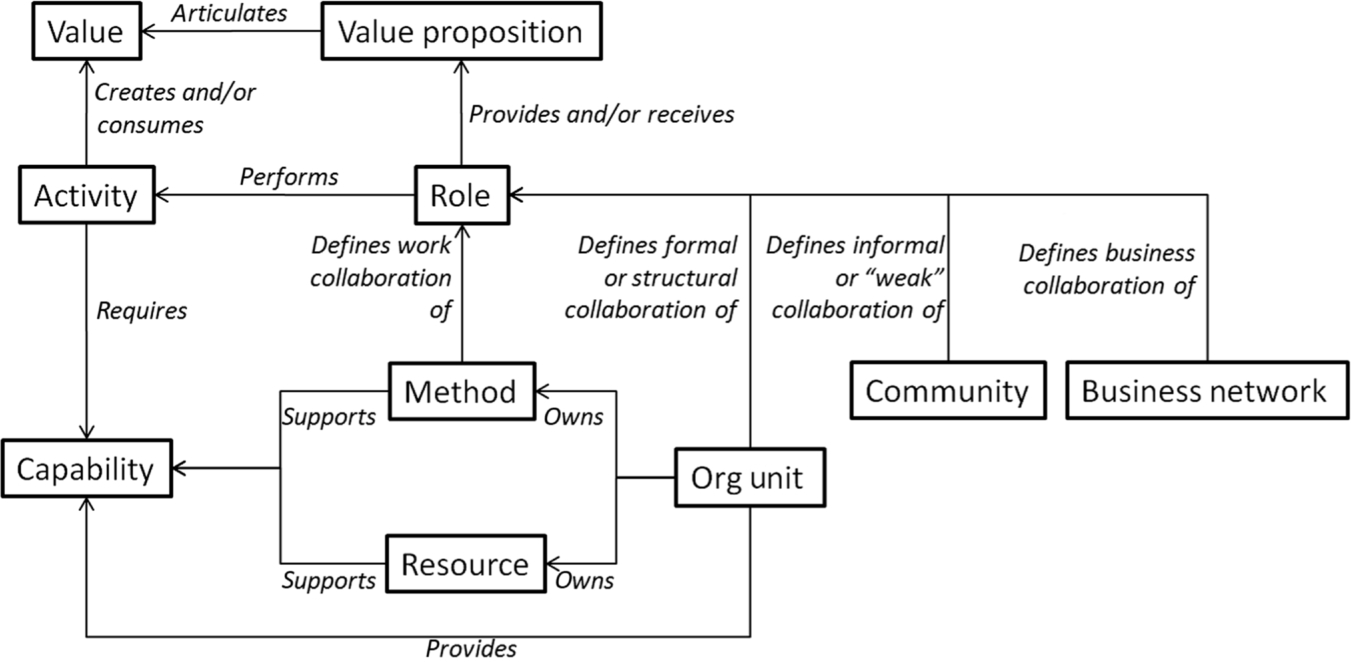
Fig. 2.1 illustrates an overview of VDML concepts and relationships. Methods, Org Units, Communities, and Business Networks are special types of collaborations—participants interacting for a shared purpose. A collaboration has participants in roles that perform activities. Activities produce deliverables and contribute values that are the basis of value propositions to recipients of products or services. An Org Unit can have one or more method(s) that is a collaboration that provides a capability with roles performing activities and consuming resources.
VDML incorporates libraries of sharable concepts: a Capability Library, a Role Library, a Value Library, a Business Item Library, and a Practice Library. These libraries name and define key concepts in a VDML model. In addition, Measure Libraries define measures to be applied to VDML elements and to support computations, particularly measurements of value. VDML libraries are designed to be shared by different VDML models, different user communities, and different VDML implementations. These libraries of concept names and definitions may be developed for a specific enterprise, but it is expected that VDML tool vendors will provide initial definitions to help new users get started, and that industry groups will develop and share definitions appropriate to each industry. The development of shared libraries is important to reduce the initial work of VDML modeling, but it is also important for promoting consistency for commonly occurring concepts that will improve compatibility of business industry standards, regulatory requirements, systems software, outsourcing, and other business integration initiatives. The application of these libraries will be described further in the sections for the associated concepts below.
In the sections that follow, we will explore these concepts and some more for a robust but abstract representation of how a business works from a business leader perspective.
Capabilities
In VDML, a capability represents the collection of personnel, facilities, intellectual property, supporting technology, and methods to perform a particular type of work. A VDML model can include a Capability Library with a taxonomy of capabilities. The taxonomy serves three purposes: (1) it helps a user recognize similar or equivalent capabilities that exist elsewhere in the enterprise, (2) equivalent capabilities are referenced with the same name since each concept is defined only once in the library taxonomy, and (3) it helps a user find a needed capability when exploring changes to the business. The taxonomy also provides the basis for a capability map display, discussed in Chapter 1, for consideration of needs for improvement. It is expected that industry groups may develop prototypical capability libraries.
Capabilities may reference Practice Definitions in a Practice Library. This is helpful for identification of best practices and in understanding differences in implementations of capabilities provided by different organizations. The differences may be important for such concerns as consolidations, security, regulatory compliance, and risk management.
Within a traditional, line-of-business organization, a capability may be embedded in a larger process so that it is not clearly distinguished from other capabilities in the same process. The capability may be applied in different parts of the same or different processes of the line-of-business. The different applications of the capability may use some of the same resources—possibly the same team, but it is likely to be implemented with different variables.
The capability library is the starting point for consideration of capability consolidations. The detail of capability methods, discussed later, provides additional insight on the potential for consolidation. A capability to be consolidated may include multiple, more granular capabilities in the library taxonomy. So, consolidation may involve multiple services associated with that capability to be managed by a single organization unit, described here as a capability unit.
A shared capability can achieve economies of scale with shared fixed costs, resources, methods, and expertise. When changes or policies must be applied to a consolidated capability, the changes need only be implemented by one organization. Only one organization is accountable for the value contributions of the capability. On the other hand, the LOB organizations that use the capability no longer have direct control over the capability implementation or operation, and there may be some trade-offs between the specific needs of a LOB and the needs of other LOB. These are factors to be considered when evaluating a consolidation. Consolidation may also be impractical when the needs for the capability exists in different countries so that there are barriers to communication or delays in transportation.
Collaborations
A collaboration is a group of people working together for a shared purpose. Usually, the participants have identified roles that describe the nature of their contribution to the collaboration, and a participant in a role is responsible for performing certain activities. Some collaborations may transfer some work to other collaborations. A supporting collaboration may receive inputs and provide outputs through delegation, or it may receive inputs and provide outputs through shared stores (discussed later).
In VDML, an enterprise is a network of collaborations that work together to achieve the purpose of the enterprise. VDML defines four specialized forms of collaboration: Community, Business Network, Org (organization) Unit, and Capability Method.
Community
A Community is a relatively unstructured collaboration where participants are described as Members. The members of a professional, religious, or political organization or a market segment are members of a community that share interests and goals. A market segment represents potential customers of a product or service. Shareholders are a community. Often a community will pursue a potential campaign or initiative, and selected members may become members of a specialized collaboration with a distinct purpose, where participants have more distinct roles and activities.
Business Network
A Business Network is a collaboration for interaction of business entities for exchange of money, products or services, or possibly other benefits. It is a cooperative exchange—there is no central coordinator. Each participant is described as a Party. These parties will have distinct roles and activities, and they will exchange certain deliverables and associated values. A Business Network may be displayed as an exchange of deliverables or as an exchange of Value Propositions (discussed later).
Org (organization) Unit
A typical management hierarchy is a composition of org units. An Org Unit is a group of people and possible suborganization units that work together at one level in the management hierarchy. The participant roles in an org unit are represented as Positions. An executive team of a company is an org unit; the leadership team of a division or department is an org unit; and a work group, team, committee, task force, or project team is an org unit. These are each part of a management chain where the managers are responsible for people, resources, and other assets. The typical org unit has a leader/supervisor/manager/director that is in charge of the org unit activities and allocation of resources. The person in charge is also a participant in the parent organization—the collaboration managed by his or her boss. This, along with the engagement of org units in roles of other org units, defines the management hierarchy.
As the owners of assets and resources, org units provide capabilities. These may be provided by simply staffing a formal collaboration that applies a capability or by staffing an ad hoc collaboration with appropriate resources. For staffing or providing resources or other business items for collaborations, an org unit has Stores and Pools (discussed later).
Capability Method
A Capability Method is a collaboration that specifies an activity network with activities, stores, roles, deliverable flows, and value contributions involved in the application of a capability. A capability method is an abstraction of a business process. The capability of an organization unit may be applied by different capability methods for different purposes. For example, an order entry capability may involve receipt of orders for standard products and receipt of orders for specialized products. So, the order entry organization might provide one capability method with activities for all products, or it may provide two different subcapability methods for the two more specific capabilities dealing with standard products vs specialized products. This will depend on the significance of the differences and the performance measurements of interest.
A capability method may be engaged as a service by delegation. A requesting activity sends a business item request and receives a business item result. A Business Item represents any form of deliverable that is conveyed in a VDML model. The requesting activity interacts through the defined interface and expects compliance with a level of service agreement. The exchange is “synchronous” because the requesting activity sends a request and waits for a response.
A capability method may also be engaged asynchronously by delivery of a business item to a shared store that is input to the capability method. This occurs less frequently, but typically occurs when there is a side effect of the primary operations or an exception that requires processing to proceed along an alternative path. In some cases, a deliverable of the alternative path may reenter the main stream at a later point through another shared store.
An organization that provides a capability is identified by a Capability Offer that is located by reference to the capability definition in the library. There may be multiple capability offers for a particular capability, each identifies a different organization that provides the specified capability. A delegating activity, discussed later, identifies a capability method by reference to the capability offer(s) for that capability.
As depicted in Fig. 2.2, a capability offer links a capability definition to an organization unit that provides the capability and a capability method (an abstract specification of a capability service) used by the organization unit to deliver the capability. In the diagram, there are two capabilities defined in the Library: Capability A and Capability B. Each refers to one capability offer. Both capability offers refer to Org Unit Y, but the offer for Capability A refers to Capability Method M and the offer for Capability B refers to Capability Method N. However, Org Unit Y is both the owner and the user of Capability method M, but it is only the user of Capability N since Organization Unit Z is the owner of Capability Method N.
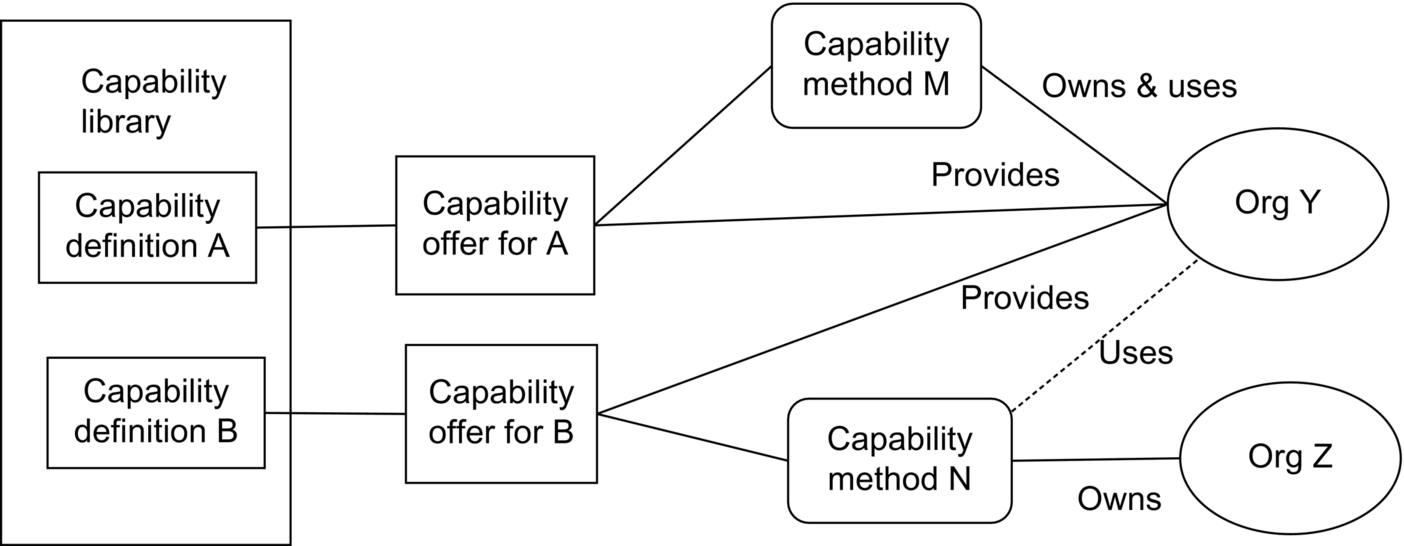
The provider of a capability method is usually the owner of the capability method. An owner organization is responsible for the design of the method (which usually includes automation), but the owner may be a separate organization from the provider(s). For example, the accounting organization may be the owner of a sale-processing capability method that is applied by multiple retail sales locations. The owner ensures consistency, policy compliance, and authorization. Each provider has the staff and other resources required to deliver the capability.
Roles
A Role represents a requirement for a participant in a collaboration. Each specific role is defined in the context of a collaboration, and each must have a name that is unique within the context of the collaboration.
Each role may be assigned to one or more activities in the collaboration. A participant in a role must be capable of performing all of the activities to which the role is assigned.
A participant in a role may be a person, a collaboration, or another role. In general, persons available for assignment to a role are persons in roles of other collaborations. For example, persons assigned to roles in a capability method are typically persons in position roles of the responsible organization unit. However, a person may be assigned to a role because they are assigned to another role that brings with it the capabilities and relationships required for that other role.
For example, a position (role) in an organization unit may be assigned (1) to a member role of a community, (2) to a performer role in a capability method, or (3) to a position role in another org unit. A manager position (role) in an organization unit X fills a position role in the parent organization unit Y indicating that the position in org unit Y must be filled by the person assigned to the manager role of organization unit X.
This is not the same as when the same person is assigned to two different roles. If a new person becomes a manager of organization unit X, then that new person will implicitly become the participant in organization unit Y. Because the participant is in both collaborations X and Y, that participant brings knowledge of collaboration X to collaboration Y, and vice versa.
When a role is filled by a collaboration, the assignment usually represents a delegation to an organization unit. That is, the basis of a conventional organization structure—a hierarchy of organization units. Assignment of an organization unit as a performer (in a capability method role) is to provide a capability available from that organization. That capability requirement is typically satisfied by a capability method and performers of that method that are typically managed by the organization unit (some may be from other organization units). The capability method is then engaged by delegation to apply the required capability. If the role filled by the organization unit occurs in multiple activities of a collaboration, then the organization unit must have the capability required by each of those activities.
VDML provides a Role Library. This supports consistent naming of roles. A role name must be unique within a collaboration, but the same name can be used in different collaborations. In order to avoid confusion, it is desirable that a Role name has a consistent meaning throughout the VDML model and the enterprise. We will see in Chapter 7 that this consistency of role names is also useful for management of access authorizations.
Activity Networks
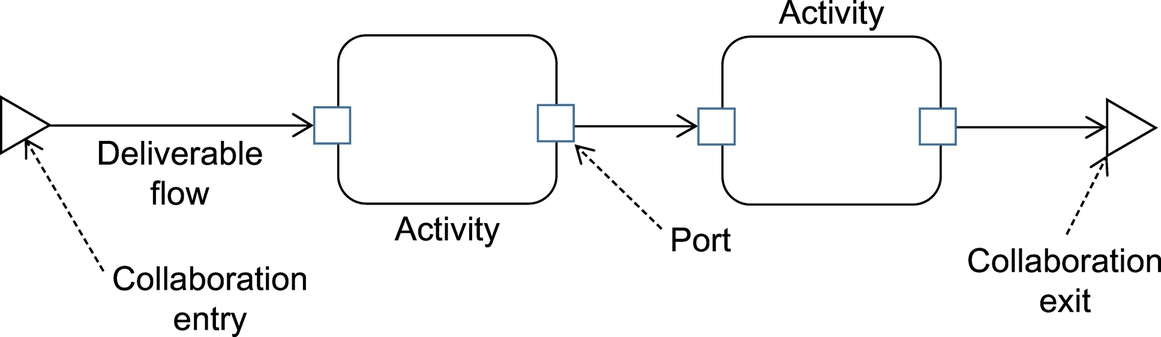
Activity networks model the work of the enterprise. Activities are defined in the context of a collaboration. A collaboration activity network consists of activities and stores contributing to values and linked by deliverable flows that specify dependencies. Fig. 2.3 illustrates a simple activity network originating with entry of the collaboration and terminating with exit from the collaboration (triangles). Deliverables flows (arrows) are connected to activities with ports (small squares on boundaries). Ports are cursor sensitive in a display for access to associated information.
An activity network begins and ends within the context of a collaboration. Activities are connected by deliverable flows, and collaboration activity networks are connected together through flows between collaborations. Any type of collaboration can have an activity network, but most activity networks will be modeled in capability methods.
This simplified view does not include all of the elements that can occur in an activity network. The following sections will start with further discussion of activities followed by discussions of deliverable flows, business items, stores, pools (specialized stores), and delegation.
Activity
An Activity specifies a unit of work to be performed by a participant. The participant is identified by the role associated with the activity. An activity is performed by one role. If there is a need for more participants, then the activity delegates to a collaboration among those participants. Delegation is discussed later.
Action by an activity depends on receipt of input deliverables. An activity may have multiple inputs, and the port specifications determine the inputs required to initiate actions such as all deliverables are required, any one deliverable is required, or multiple deliverables are required.
The performance of work and contributions of value of activities and the flows between activities are measured statistically. Within each collaboration, activity network measurements are based on one unit of collaboration production. The deliverable flows between activities define the portion of production routed out of and into each activity. The contributions of value are weighted according to the portion of production to which they apply. If there are multiple outputs, each output port will specify the percentage of outputs from that port. The output port also identifies the value contributions associated with that output.
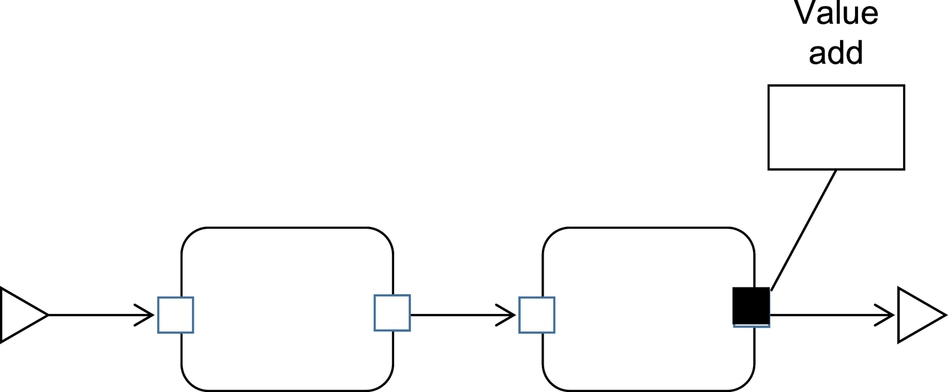
Fig. 2.4 illustrates an activity with a value add element connected to its output port. The black output port indicates that there is value contributed since the value add element is not visible in a standard activity network view. Value adds are elements in a value aggregation network discussed later.
Deliverable Flow
A Deliverable Flow depicts the flow of a business item (deliverable) from a collaboration entry or the output port of one activity or store to the input port of an activity or store, or a collaboration exit.
By default, a deliverable flow is shown with a solid line. The deliverable flow may be distinguished as “tangible” or “intangible.” A tangible deliverable flow is the default and is recognized in the business as formally defined in business process specifications. An intangible deliverable flow, indicated by a dashed line, is informal (eg, not identified in business process specifications) but is important to understand how the business actually works. This notation comes from Value Networks analysis (Allee, 2008) where the actual operation of the business is captured for analysis. Value Network analysis is supported by VDML.
Output ports determine the relationships between multiple outputs of an activity. Outputs may be mutually exclusive, concurrent, or based on a condition on the output port. The port specifies a Planning Percentage that is the portion of executions of that activity when that port produces an output and adds value.
Business Item
A Business Item element references anything that may be produced, consumed, conveyed, or stored in an activity network or exchanged by collaborations. This includes parts, products, and other physical things, as well as documents and oral or electronic communications that convey information necessary for subsequent action.
The name of the business item type is defined in the Business Item Library. The business item in the model represents the business item in the business and may include attributes that describe the business item. As such, the Business Item Library represents an abstract information model about things that are consumed, produced, and exchanged in the business. The same type of business item may occur elsewhere in a model, but it does not represent the same occurrence of the business item type unless the reference is to the same model element.
A business item may represent a person who is the subject of activities in the network. The same person may also be a participant in a role of the network. For example, a patient is admitted to a hospital and is the subject of various tests and treatment activities. Incoming patients may be held as business items in a store awaiting treatment. The same person has a role in treatment planning activities and as a customer for services.
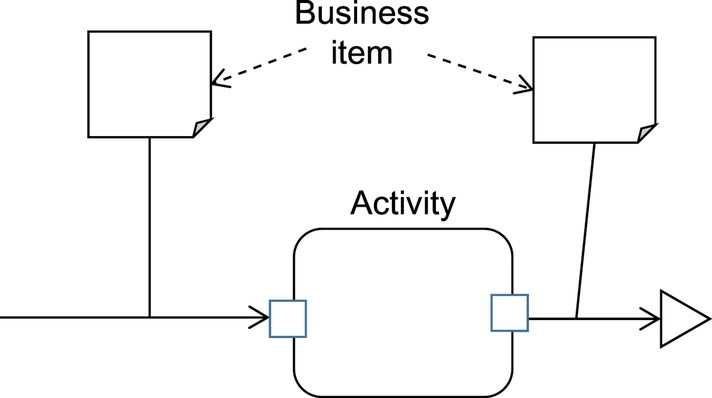
Fig. 2.5 depicts business items associated with deliverable flows. A standard activity network view does not show the business items. The input and output of an activity may be the same business item element indicating that there is a change to the business item (some value may be added), but the business item is essentially the same thing, before and after the activity, with some modification.
Store
A Store receives and provides business items in an activity network. A store holds business items waiting for consumption by one or more activities. A store could represent, for example, a bin of parts, finished products in a warehouse, or orders waiting to be processed. Stores receive business items by deliverable flows and pass business items to activities by deliverable flows. Stores define inventory levels and delays due to business items waiting for processing. Since a store holds business items that have business value, a store has an org unit owner.
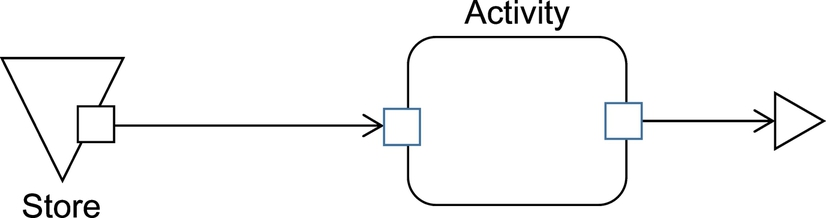
Fig. 2.6 illustrates a store providing input to an activity. The store may be the source of input to the collaboration, so there is no distinct collaboration entry element. Input to this store then occurs elsewhere in the model.
Instead of entry by delegation, a collaboration may initiate activity in another collaboration by passing a deliverable through a shared store. The same store, identified by name, appears in both the sending activity network and the receiving activity network. A result may be returned later, through another store, or it may be passed on to another value stream. For example, a sheet metal stamping operation may produce a part for an automobile body, but the scrap sheet metal is passed on as input to another value stream where the scrap is used on the production of another product.
The flow of control through stores also represents the flow of many traditional business processes where deliverables, as well as responsibility, are passed from a process in one department directly to a process in another department. These inputs and outputs occur through Stores because they are “asynchronous;” the receiver may not immediately act on its input, and the sender does not wait for the receiver to accept. A store holds one or more business items it receives, waiting for a subsequent activity to accept each business item.
A specific shared store can appear in multiple activity networks. Each appearance of the shared store is then a receiver of business items or a supplier of business items. The multiple appearances of a shared store are views of a single store element that is identified in each view by the store name which must be unique within a VDML model.
In the trivial case, one activity network sends business items to the store and another activity network accepts business items from the store. Often business items will be sent by multiple activity networks to be processed by one activity network. Sometimes, one activity network produces business items that are consumed by multiple receiving activity networks. The store is essential to represent the business items that are held until a receiving activity network is ready to accept them.
In a capability-oriented architecture, we have described these flows through stores as “side-effect flows” because they often produce outputs that are ancillary to the primary operation of the activity network. For example, this may be used to represent a reporting flow or handling of exceptions. It may also represent a diversion of some of the production output such as scrapped units of production or material for a by-product. Generally, the scrap or by-product flow produces some value that offsets the cost of the mainstream product.
Stores are also used to represent asynchronous flows of deliverables between business entities. For example, a product shipment is generally sent when the sender has it ready and received to be held for processing. The sender does not wait for the receiver to be ready to process the shipment.
Pool
A Pool is a specialized store. A pool holds and tracks business items (resources) that are reusable. Conceptually, a business item accepted from a pool is marked as in use. When the reusable business item reaches a particular point in a series of activities, it is released and again becomes available for reuse. The pool computes delay in availability of resources based on the number of resources assigned to the pool and the duration of assignments of the resources. In a discrete event simulation or a system dynamics simulation, the pool would keep track of individual resources. Simulation is not included in the current version of the VDML specification.
Delegation
Delegation involves an activity of one collaboration engaging another collaboration to do the work of that activity. Essentially, the activity engages the other collaboration as a service. This is fundamental to the capability-oriented architecture where a capability is shared as one or more services.
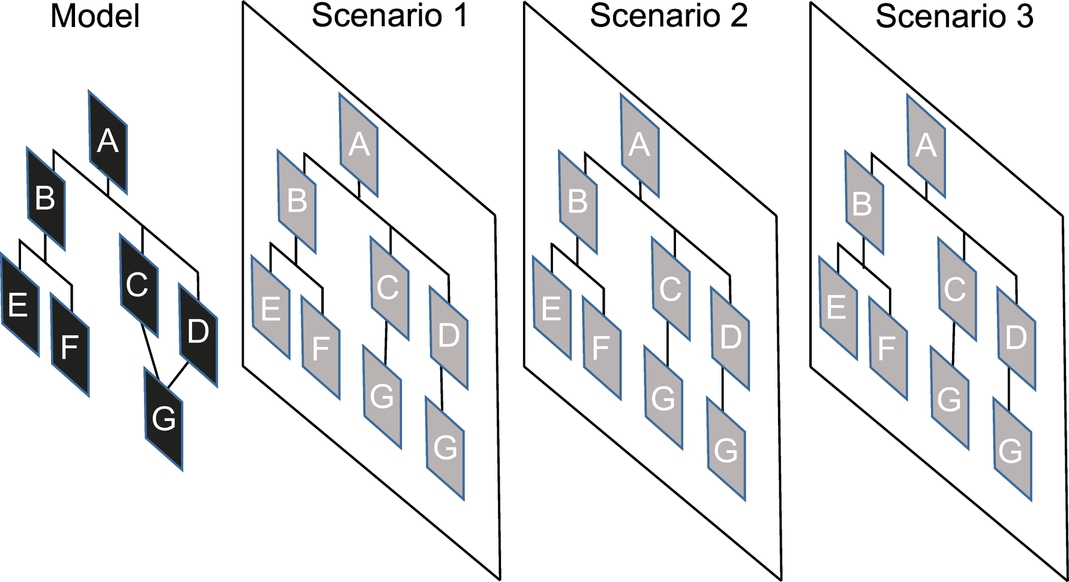
Fig. 2.7 illustrates the implications of delegation. The group of boxes with black backgrounds, on the left side, represent the VDML model of capability methods linked through delegation. The scenario panels to the right represent different uses of the same capability method. The letters indicate different capability methods. Capability method G is engaged by both capability method C and capability method D. In each delegation, deliverable(s) are passed for each delegation to method G, so there are different deliverables and measurements associated with the different occurrences of method G.
Scenarios
The Fig. 2.7 panels labeled Scenario 1 through 3 depict the model in different circumstances, that is, different scenarios. The gray boxes represent different contexts for the associated capability methods. In each scenario, each capability method has a different context, depicted by the gray boxes, that have the measurements associated with that capability method in that scenario. The delegation context also defines the inputs and outputs of the associated capability method in that context.
In this diagram, capability method G is engaged by capability methods C and D, so these define different contexts (gray boxes) in each of the three different scenarios. So, while there is only one specification for capability method G (black box), there are six different contexts.
A capability method can be engaged in multiple contexts in the same or different scenarios; in other words, the same capability method may be used in different lines of business, in other collaborations, or in different activities in the same collaboration. Each of these delegations may involve different subject matter and measurements. So, while the capability method model is the same, the measurements for each use of a capability method are independent.
The delegation context also identifies the exchange of value measurements that occurs in the delegation. The performance of a particular capability method may be evaluated in these different circumstances by looking at the measurements in the different contexts.
Note that Fig. 2.7 is not a standard display but is used here to illustrate relationships of elements involved in delegation.
A scenario incorporates a set of measurements that represent the performance of the business under certain circumstances such as for a particular production rate or product mix (as where a product has various options for each unit of production). This includes any measurements associated with activities, stores, roles, value adds, and value propositions.
A scenario element is the root context of a delegation tree. When a delegation is created, it is created in the context of an existing delegation (or scenario). The new delegation context is linked to the existing delegation context. This forms a tree of delegation contexts linked to delegation contexts depicted by each of the scenario planes of Fig. 2.7. When a user is working with a VDML model and assigns or looks at measurements, the user is working within a specified scenario, in other words, a specific delegation context tree. The circumstances associated with the scenario must be understood so that measurements are added and used consistent with those circumstances.
Value Contribution Network
The work of activities contributes values. The value measurements for a particular value stream are aggregated in value proposition(s) of that value stream that reflect the interests of customers or other stakeholders. In the following sections, we will discuss the network of value adds, the structure of a value proposition, the concept of the value stream, and the value library.
Value Adds
The values contributed by an activity are expressed as value add elements. The value add elements are associated with the output ports for which the contributions apply. For example, the cost of an activity is a value added. If the activity produces more than one output, some of the cost could be allocated to each output. On the other hand, the duration of an activity is also a value added. If there are multiple outputs, the same activity duration may be associated with each of the outputs. Note that outputs may be concurrent or may each be a fraction of the overall output.
The value contribution network is based on deliverable flows. An activity adds value associated with an output of a deliverable. The deliverable flows to another activity which contributes added value to its outputs and associated deliverables. Each value add element is linked to the value add elements of the same value type that are associated with deliverable inputs to the activity. At the same time, each value add is linked to the value adds of the same type that are associated with the outputs of the activity receiving the deliverable.
Value Aggregation
Fig. 2.8 illustrates the aggregation of value contributions adjusted for activity output percentages. This is not a standard diagram but is intended only to illustrate the value computations.
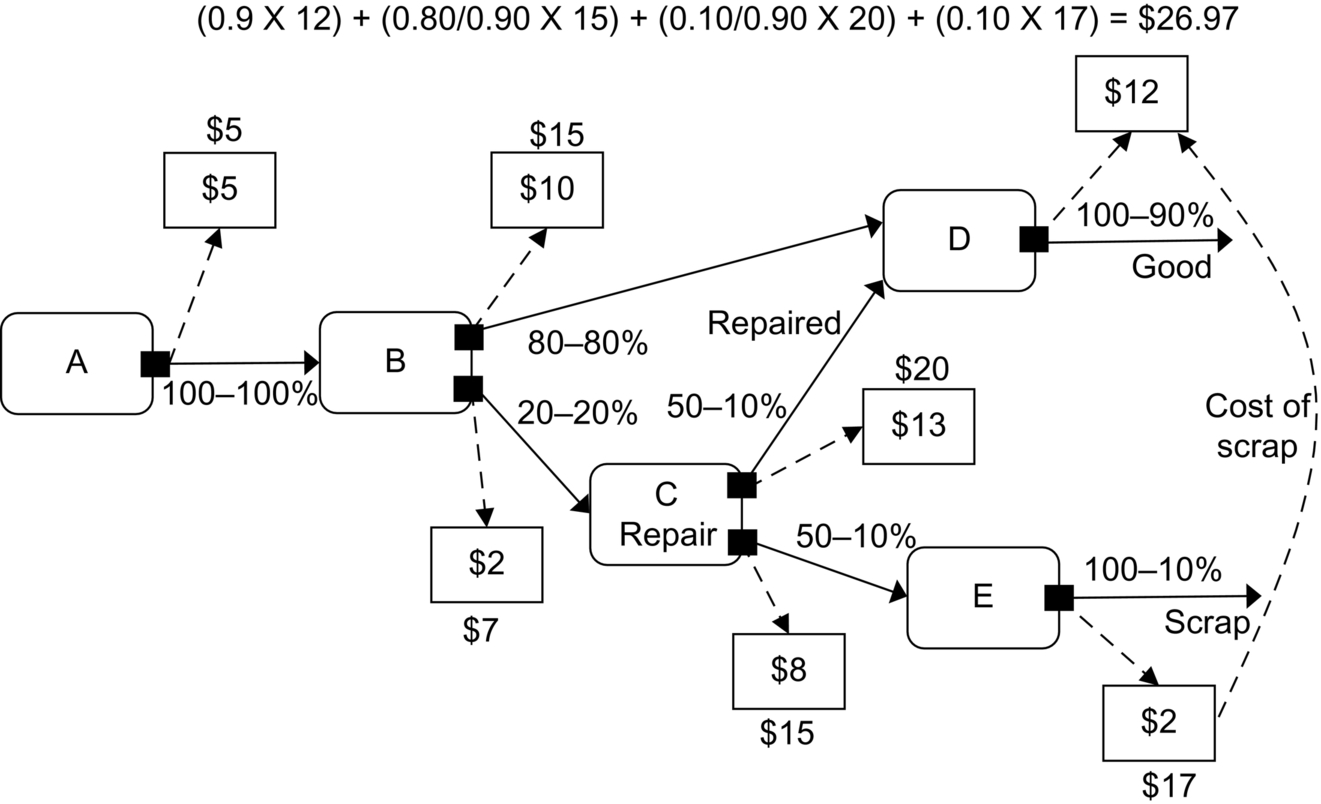
Activity A, the first rounded rectangle, processes each unit of production and has one output. The portion of production flow is represented by two numbers on the output deliverable flow. The first number, 100, represents the share of output of activity A, 100%. The second number represents the share corrected for the share of production directed to activity A; in this example, activity A receives 100% of production, so its output is 100% of production.
Activity B receives 100%, but it has two outputs, split between 80% for good product and 20% for defective products. Consequently, 80% of the total production goes to activity D, and 20% of total production goes to activity C. Activity C receives 20% of production for repairs and that is split, 50–50 between good and defective product on outputs. Since activity C has only 20% of production, the outputs are each only 10% of total production. The scrap output of activity C goes to activity E to handle the scrap, and 100% of that input is output as scrap representing 10% of total production.
The simple rectangles represent value add elements. They are associated with the activity outputs with dashed arrows. The number within each box represents the cost contributed by that activity that is associated with that output. For activity A, the total cost is $5 per unit of production and that is associated with all of the output. The number above the box represents the value allocated to that share of production which is also $5 for activity A.
For activity B, the added cost per unit of good production is $10, and the cost per unit of defective production is $2 (presumably the defects are caught before more is invested). The cumulative costs above/below the boxes are the sum of the input cost and the associated output cost: $15 for good units and $7 for bad units.
The defective units are directed to activity C. Activity C repairs half of the units at a cost of $13 and rejects the other half at a cost of $8 (presumably after attempting some repair). The two outputs now each represent 10% of total production. The repaired units are directed back into production at activity D.
Activity D now receives 80% of production as good units at a cumulative cost of $15, and 10% of total production as repaired defective units at a cost of $20 per unit. So the total input is only 90% of production. In addition, the cost of defective units is added into the cost per unit for the 10% of total production coming from activity D.
Consequently, the input costs and scrap cost are added as a weighted average that is added to the cost of activity D of $12 per unit of 90% of production. So the total cost per unit from activity D is $26.97 per unit for 90% of production.
These computations effectively represent measurement computations in a particular scenario. A different scenario will have the same structure, but different measurements. In our examples, unless otherwise specified, we will examine the model in one scenario with the understanding that there could be other scenarios with different measurements.
Value Proposition
A value proposition expresses the expected level of satisfaction of a market segment or other stakeholder based on the values associated with a product or service. A business relationship may be considered at a high level as an exchange of value propositions. The primary use of value propositions is for representation of the values offered to a customer.
In this section, we will consider a value proposition example, define the concept of a value stream, and discuss a business network exchange of value propositions.
An example value proposition is depicted in Fig. 2.9. The first column identifies the value type for each row. Three common value types are shown: Price, Duration (time for delivery), and Defects (number per unit). Other values will depend on the product or service and the interests of the recipient. We will focus on the Price row. The second column is the aggregated value for the value type of that row. In this example, we can assume that the Price is based on a profit margin added to cost. The cost is an aggregation of cost contributions from the activities that lead to production of the end product. So if the cost is $26.97 from the Fig. 2.8 example, then the profit is $3.03 per unit.
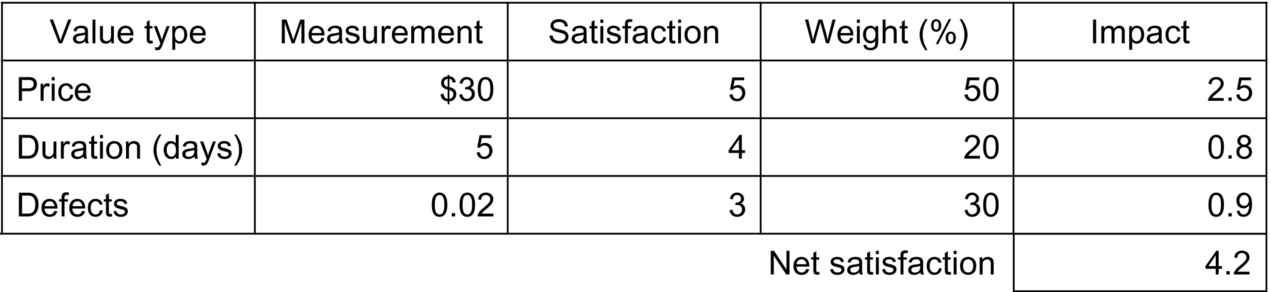
The third column is a measure of the satisfaction of the recipient market segment or other stakeholder. Here, satisfaction is a value from 1 to 5—nominally unacceptable, poor, fair, good, and excellent. The level of satisfaction for the value proposition should be derived from a formula applied to the value measurement of column 2 so that when the value measurement is updated, the satisfaction level will be adjusted accordingly. The translation of value measurement to satisfaction level will depend on the recipient. In this example, the market segment is quite pleased with the price, but not with the number of defects. The level of satisfaction of the market segment will tend to be related to the performance of competitors, so “excellent” could represent a significant competitive advantage.
The fourth column, Weights, defines weights assigned to the different value types. These factors are also based on recipient interests. Here the numbers are percentages indicating that the market segment considers the price most important, the defects are somewhat less important, and the duration is of relatively low importance.
The last column, Impact, is the weighted satisfaction level. This is computed for each value type by multiplying the satisfaction level by the weight and dividing by the total of the weights. The Net Satisfaction is the sum of the weighted measurements. In the example, the net satisfaction is 4.2 out of 5, closer to good than excellent, so, potentially, a modest competitive advantage.
A value proposition may also be applied to internal business operations. The aggregated value measurement of an internal capability method (a service) can be reported as a value proposition representing satisfaction of the internal consumers of that service.
A composite value proposition can be configured as an integration of multiple, contributing value propositions such as a value proposition that combines the value propositions of different market segments for the overall market value. A composite value proposition can be configured for top management or the board of directors representing the values delivered by a line of business for multiple products.
A value proposition can be developed for coupling the sale of a package of products. For example, a home theater may be offered as a package of multiple components, or a printer may be sold at a loss to generate sales of print cartridges.
Value propositions provide a useful perspective on a business network collaboration of business partners. For example, an Internet publishing business relies on submission of authors, contracts with advertisers, and subscriptions or purchases of consumers. Each of these contributes values and expects to receive values in return. If not all of the participants perceive that they receive greater value than they contribute, the business will fail.
Value Stream
In VDML, a value stream is the network of value adds and activities that contribute to the delivery of a product and associated value proposition(s). A value stream can be identified by tracing the deliverable flows and value add links backward from the value proposition and end product delivery. The same model can have many value streams that include many of the same capability methods. Conversely, a capability method may contribute to multiple value streams and may contribute to the same value stream in more than one context. Consequently, we may be interested in the impact of a change to a capability on the value proposition of a value stream or the value propositions of multiple value streams.
A value stream can be configured for consideration of a new product or line of business. Initially, the focus is on building a network of capabilities. To begin, there is no need to express the individual activities and deliverable flows, but rather to focus on delegations and direct flows (ie, through stores), of the value stream, incorporating existing capabilities and making place-holders for needed capabilities. The relationships between capabilities become a tree (or river with many tributaries) of capabilities. Subsequent development of the activity networks of the needed or modified capabilities will refine cost and other value estimates and may uncover the need for additional capabilities.
Conceptually, a value stream includes suppliers. However, the details of supplier's operations are usually not available. Instead, the performance of a supplier can be represented with a value proposition. The receiver can define the satisfaction formulae and weights. A supplier may have a contract involving multiple products and commitments that may be represented as a composite value proposition or exchange of value propositions. This is an appropriate level for evaluation of supplier performance.
For input to a value stream, it is the supplier's value measurements that are important. These may be incorporated into the aggregation of value measurements for the value stream. For example, the price (cost of purchase) and defect rate will be of interest. Duration may be important if the product is built to order and a supplier request occurs after receipt of an order.
Value Library
A Value Library provides the names, definitions, and measurement characteristics of value types. The library is a taxonomy to facilitate lookup. VDML vendors or an industry professional group may provide a value library with commonly occurring value types to promote consistency and make it easier for a business to get started using VDML.
Measures Library
VDML incorporates the SMM (Structured Metrics Metamodel) specification from OMG (Object Management Group). SMM defines the structure for definition of measures and for the representation and computation of measurements that occur in a VDML model. SMM also defines the mechanism by which different measurements are associated with each VDML scenario and delegation context.
In addition to the measurements in the VDML model, SMM defines a measures library that defines the characteristics of different measures. When a measurement is represented in VDML, an associated library element defines the characteristics of the measure. A value type element in the value library identifies a measure in the measures library that defines the characteristics of the measurements in value add elements and the value proposition entry for that value type.
As with the other libraries, VDML vendors or professional groups should provide value types and basic measures libraries. Once the libraries are established, a user should, for example, identify a value add for entry of a measurement, and the VDML system should offer a selection of value types.
Once a value type is selected, the measure characteristics are obtained from the measures library by a reference in the value type element.
VDML Graphics
The VDML specification includes graphical elements for key concepts and a number of graphical displays of different aspects of a VDML model. Here we will provide highlights of displays to provide a general understanding of the graphical modeling capabilities. These will be complemented by tabular displays that are dependent on the particular implementation.
VDML Graphical Elements
Fig. 2.10 shows a sampling of VDML graphical elements. These elements are used in various ways in different types of diagrams. The following paragraphs provide brief descriptions of each of the elements in Fig. 2.10.
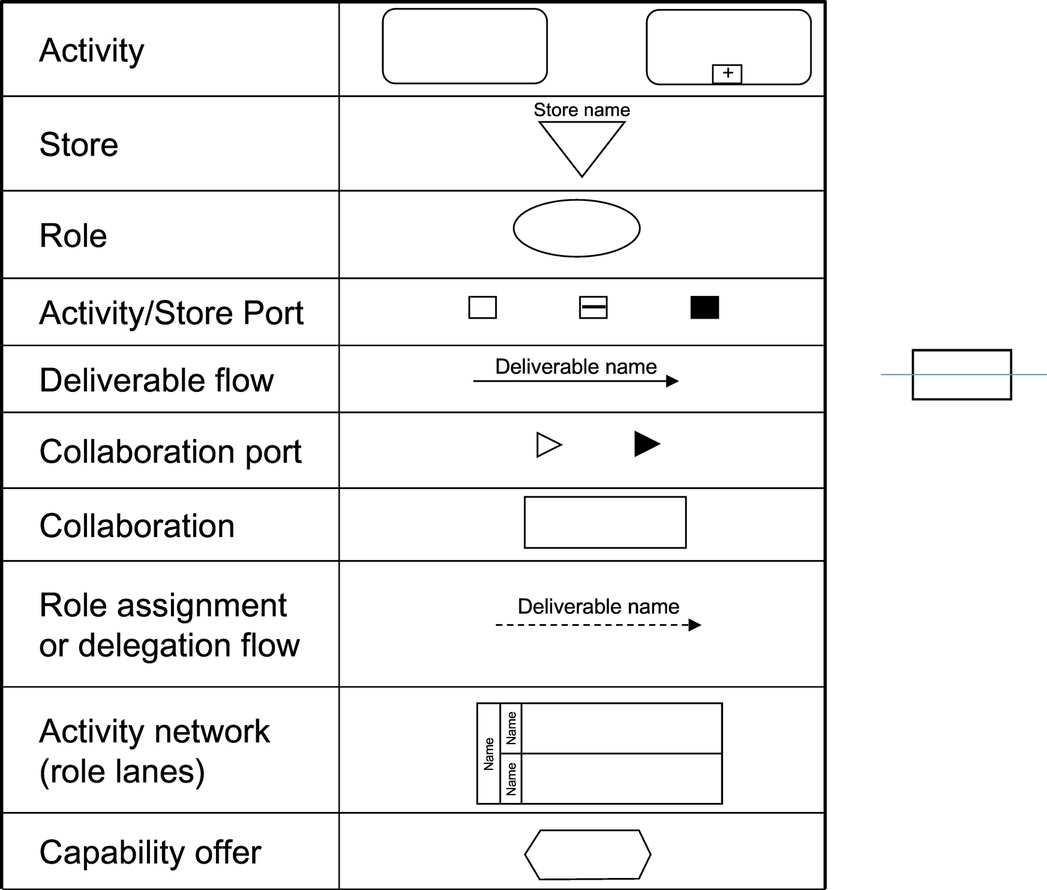
Activity. A VDML activity is similar in appearance to a BPMN (2011) or CMMN (2014) activity; however, it represents a statistical occurrence of an activity, so an activity network does not have the detail of flow control. An activity with a plus sign in the little box is an activity that engages another collaboration through delegation.
Store. There is no element in BPMN or CMMN corresponding to a store. A store holds business items or resources pending their consumption by an activity. Stores provide for asynchronous communication (eg, store and forward buffer) where the receiver may be operating on a different schedule. For example, a store will occur in a collaboration receiving input from a customer or business partner over a business network collaboration.
Role. A role defines the need for a participant in a collaboration. Roles are visible in business networks representing the different parties engaged in the collaboration, and in collaboration structure diagrams (ie, an extended organizational structure).
Port. A port is attached to an activity or store or collaboration to connect an input or output. If the box has a black background, it indicates there is value contribution attached. If the output port has a horizontal line through it, there is an associated output constraint or a planning percentage such that only a portion of the output is directed to that deliverable flow.
Deliverable flow. A deliverable flow arrow indicates the flow of a business item from or to an activity or store, the input or output of a collaboration, exchanges between roles in a role collaboration diagram, or exchanges of value propositions in a business network. A dashed line may be used to depict an intangible (or informal) flow.
Collaboration port. A collaboration port, or entry/exit, occurs within a collaboration and indicates the point at which a delegation input enters the activity network, or where a delegation return leaves the activity network. A collaboration output port that has a black background has associated value contributions.
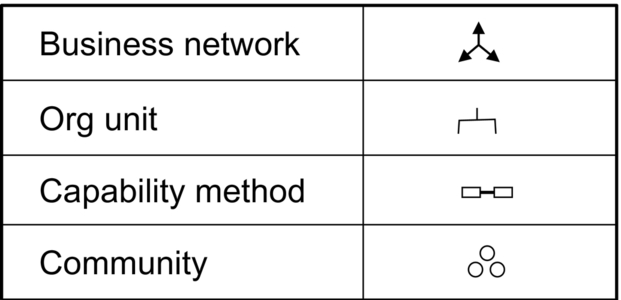
Collaboration. A collaboration is a simple rectangle that is used in several different diagram types. The type of collaboration is indicated by an icon in the upper left corner of the rectangle. The icons are shown in Fig. 2.11.
Role assignment or delegation flow. The dashed line is used to indicate assignment of roles to roles in a collaboration structure diagram, or to depict flows from/to collaboration ports within a collaboration, or to depict the link from capability offers to the capability methods they represent in a capability management diagram.
Activity network. An activity network can be displayed with roles shown as swim lanes containing the activities of the assigned roles with deliverable flows within and across swim lanes (see Fig. 2.13). An activity network can also be displayed without exposing roles, as just a network of activity rectangles (as specified, earlier) connected by deliverable flows.
Capability offer. A capability offer represents a capability available from an organization unit. The graphic is currently used only in capability management diagrams.
VDML Graphical Displays
The following sections briefly describe the various types of graphical diagrams defined in the VDML specification. Additional examples can be found in the VDML specification. The VDML-defined views are a basic set expected to be extended by implementers in response to market interest.
Role Collaboration
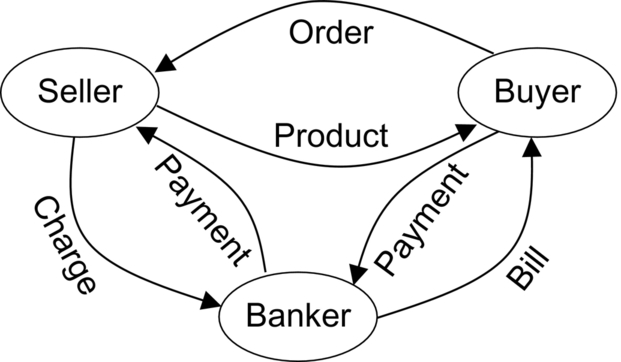
A role collaboration diagram focuses on the exchange of deliverables between participants as depicted in Fig. 2.12. It is used primarily as a view on a business network but can be applied to view the relationships between participants in any collaboration.
Value Proposition Exchange
A value proposition exchange depicts the exchange of values between participants in a business network. This is somewhat similar to a role collaboration diagram except that one value proposition may correspond to the delivery of multiple deliverables, so the diagram is more abstract.
Activity Network
An activity network based on part of the role collaboration diagram of Fig. 2.12 is depicted in Fig. 2.13 with roles represented as swim lanes. This represents deliverable flows in the business network collaboration. A similar diagram may be used to represent deliverable flows in other collaborations. An activity network may also be represented without the role swim lanes, so the diagram requires less space.
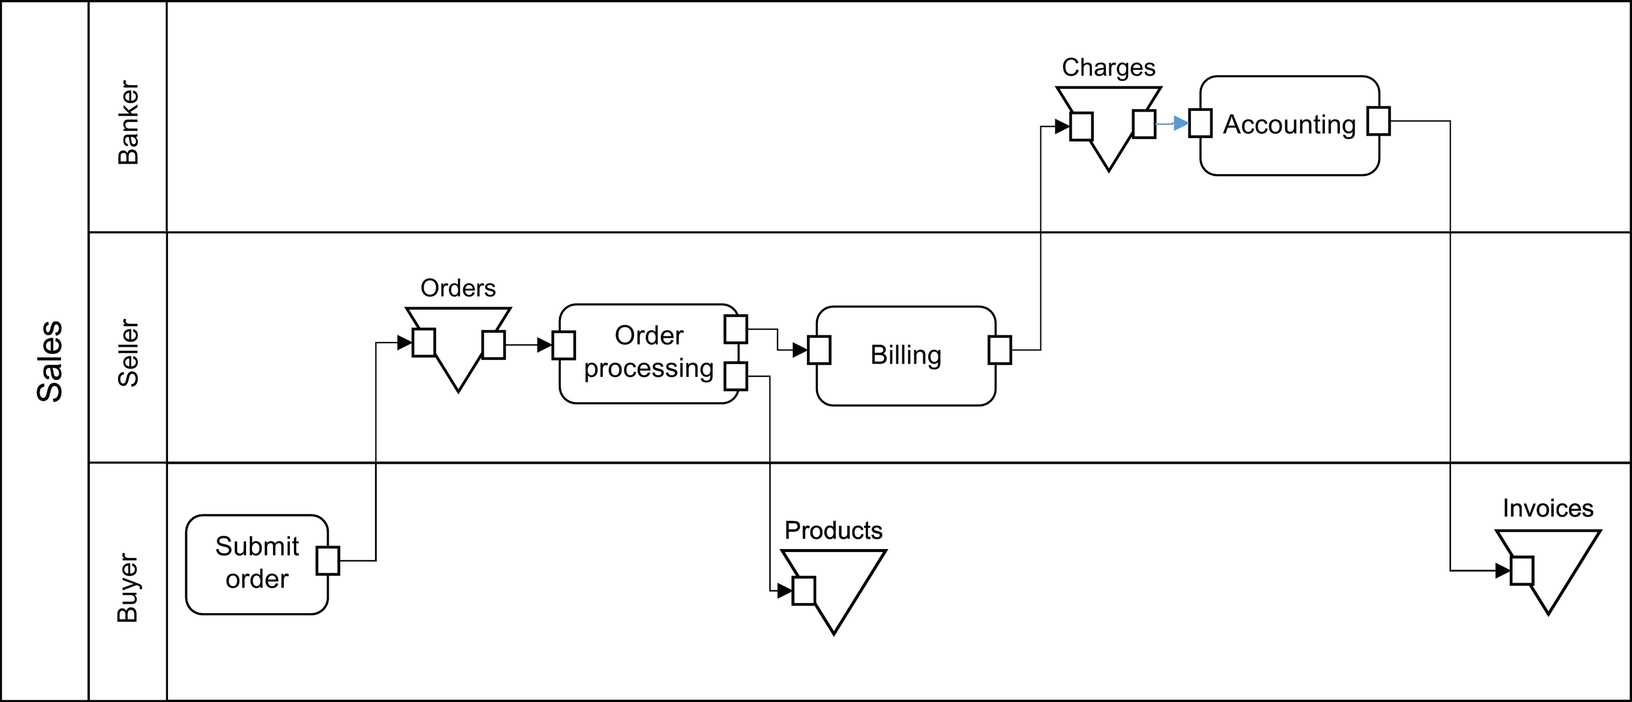
Note the use of stores in this activity network. Since the participants are independent business entities, they will receive deliverables in stores because they may not be processed immediately. The store may contain a substantial number of inputs indicating a delay in processing.
Collaboration Structure
A collaboration structure is an extension of a conventional organizational hierarchy that includes additional roles and collaborations.
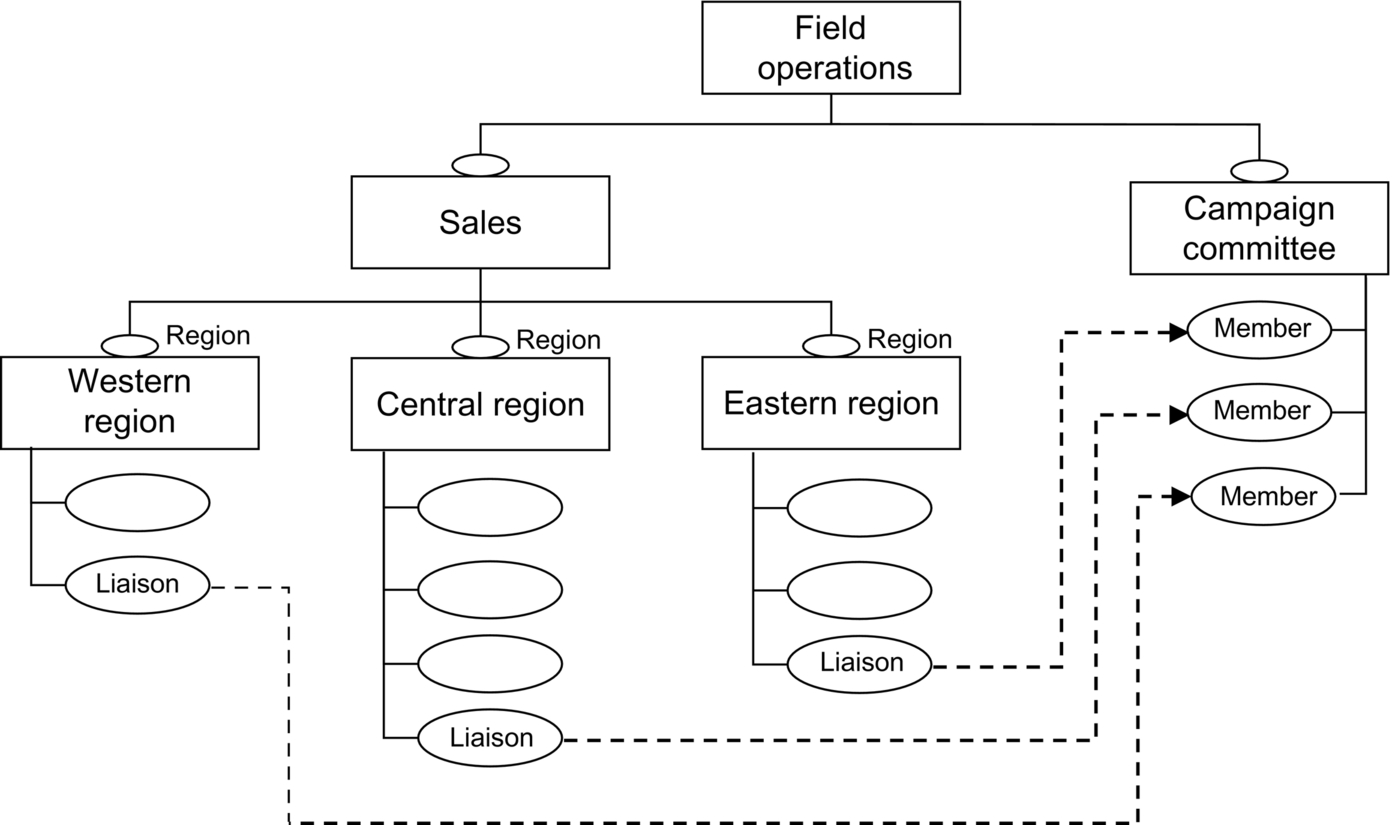
Fig. 2.14 illustrates a hypothetical collaboration structure. Field Operations has three regions, and a Campaign Committee that consists of Liaison representatives from each of the regions. Roles are ellipses. The Liaison roles have actors assigned (not shown). Each Liaison role is a role in a region but is also assigned to a Member role in the Campaign Committee as indicated by the dashed arrows. This illustrates roles of roles. The small ellipse above each collaboration indicates that it is filling a role in its parent org unit.
Capability Map
A capability map is a conventional graphical display. Capability rectangles are nested according to their positions in the taxonomy of the capability library. If certain capabilities are highlighted, then it is a “capability heat map.” An example is illustrated in Chapter 1.
Capability Management
A capability management diagram, Fig. 2.15, shows one or more org units (large rectangle with the name on the top border) that may be linked by providing and consuming their capability methods. The boundary of an org unit contains capability offers (hexagons) that are each linked with a dashed line to the associated capability method (rectangle) used to fulfill the offer. The capability method may engage one or more supporting capability methods through the dotted lines to the capability offers of the associated organization units.

In Fig. 2.14, Capability Offer A of Org Unit X links to Capability Method A performed by Org Unit A. Capability method A engages Capability Method C through the Capability Offer C of Org Unit Y. Capability Offer B links to Capability Method B that is owned by Org Unit Y but is performed by Org Unit X which provides the Capability Offer.
Measurement Dependency
A measurement dependency network shows the measured characteristics that contribute to the computation of an end measurement. Each arc in the network indicates if the effect is positive or negative. Typically, the end measurement is a value measurement in a value proposition.
Related Business Analysis Techniques
The displays discussed above are included in the VDML specification to support understanding of the specification and to provide a minimal set for implementations. However, it is expected that implementers will develop additional displays based on user needs and market demand. Some displays may best be presented as tabular displays (spreadsheets).
Different business design and analysis techniques rely on additional graphical displays. Of particular interest are Value Networks displays based on the work of Verna Allee, and the multiple dimensions of the Lindgren, Business Model Cube (Lindgren et al., 2011) and the Osterwalder, Business Model Canvas (Osterwalder and Pigneur, 2010), discussed in the following sections. These techniques and associated displays can be supported with the content of a VDML model. Additional discussion of these techniques can be found in the Appendix of the VDML specification.
Allee Value Network
Support for the Allee, Value Network requires a display that is similar to the role collaboration display of Fig. 2.12, depicting the exchanges of deliverables between roles. A Value Network uses the distinction between tangible (formal) deliverables and intangible (informal) deliverables by using dashed lines for informal deliverables. These diagrams may also indicate a sequence of deliverable flows to improve understanding of the interactions.
A Value Network diagram may be derived from a collaboration activity network, but these are more useful when they depict a broader scope of exchange. The broader scope may depict observations of exchanges in an existing value stream to support analysis of existing business operations without regard for delegation to shared capabilities and the bounds of collaborations.
The broader scope may also be applied to a VDML value stream where the delegations are flattened to expose the participation of roles at multiple levels. A user might select a primary collaboration and then selectively expand the subcollaborations.
Lindgren Business Model Cube
Peter Lindgren has defined a Business Model Cube in which six dimensions of interest are defined and could be presented as VDML diagrams. The relationship of these to VDML concepts is discussed later.
Competencies. A competency is a key capability (VDML) for which the enterprise possesses the necessary components to provide the capability. For the Business Model Cube, this dimension will include the selected competencies that are essential to the particular business interest. These should appear as capabilities in the VDML capability library and could be flagged as competencies.
Network. The Business Model Cube network includes selected business partners that are essential to the success of the business being modeled. In VDML, these business partner networks will be represented in various business network collaborations.
Relations. The Business Model Cube expresses exchanges between internal processes and external business partners and customers that are critical to the success of the business. In VDML, these exchanges are represented as selected deliverable flows in business network collaborations.
User and customer. In the Business Model Cube, a typical customer is a direct recipient of the business product or service; a user is a typical participant in the activities or services of the customer. In VDML, the customer is typically a representative of a market segment (community collaboration) who is a party in a business network collaboration. Users may be represented as communities of individuals who interact through business network collaboration as part of the customer business relationship; in other words, the customer is the recipient of the value proposition and determines the more specific benefits provided to users.
Value chain. The Business Model Cube value chain is the sequence of high-level stages that define the operation of the business. In VDML, these stages are high-level abstractions of activities that engage much more detailed decomposition of the business operations.
Value formula (Profit formula). In a Business Model Cube, this describes the factors considered in the computation of profit. In VDML, profit may be computed from value measurements, such as cost, in one or more value propositions along with other factors such as profit margin.
Value proposition. In a Business Model Cube, the value proposition expresses the values offered to a customer or other stakeholder. In VDML, a value proposition expresses the same values, but these are supported by the network of value contributions along with satisfaction criteria and weights to represent the level of interest of the recipients.
Osterwalder Business Model Canvas
Alex Osterwalder has defined a Business Model Canvas in which nine dimensions of interest are defined and might be presented as VDML diagrams. The relationship of these to VDML concepts is discussed below.
Channel. A channel is a path for sales and distribution of product and services. In VDML, such paths are depicted with business network collaborations and a channel attribute.
Cost structure. In a Business Model Canvas, the cost structure describes all the costs to operate the business. In VDML, costs are a type of value contributed by activities and aggregated in value propositions for each particular product or service.
Customer relationships. In a Business Model Canvas, customer relationships are interactions with customers leading to delivery of products or services. In VDML, such relationships are represented as business network collaborations.
Customer Segment. In a Business Model Canvas, a customer segment is the segment of the customer market where customers have common interests or needs related to products or services. In VDML, the market segment is a community (collaboration) of customers.
Key activities. In a Business Model Canvas, key activities are typically VDML capabilities that are critical to the business and may be necessary for differentiation. In VDML, these key capabilities also may be identified with attributes to be highlighted in a capability heat map. Key capabilities can be identified as key competencies indicating that they must be retained within the enterprise (not outsourced) to preserve competitive advantage.
Key partnerships. In a Business Model Canvas, key partnerships are relationships with business partners that are critical to the success of the business. In VDML, business partners are identified in business network collaborations and critical (key) partners can be highlighted.
Key resources. In a Business Model Canvas, key resources are facilities, people, raw materials, etc., that are critical to the success of the business. In VDML, the key resources may be identified as key business items that may be scarce or not available to competitors. Most of these should be found as inputs to key capabilities (key activities, earlier).
Revenue stream. In a Business Model Canvas, the revenue stream is the income from sale of the product or service. In VDML, the revenue stream is represented by the exchange of value propositions in business network collaboration(s) between the business and market segments where the revenue is the sale price received from customers (represented in the value proposition received) minus the cost of the product delivered (represented in the value proposition delivered).
Value proposition. In a Business Model Canvas, a value proposition represents the values offered to the market. In VDML, there may be multiple value propositions reflecting the expected levels of satisfaction of relevant values to multiple market segments.
Going Forward
In the next chapter, we will give further consideration to the analysis, development, configuration, and management of shared capabilities as the building blocks of the current enterprise and potential future business designs. Subsequent chapters will address implementation of an advanced agile enterprise and additional, supporting technologies. Chapter 11 will describe future work to further develop business modeling capabilities.