
Introduction
Faisal Khan1; Seyed J. Hashemi Centre for Risk, Integrity and Safety Engineering (C-RISE), Faculty of Engineering & Applied Science, Memorial University of Newfoundland, St. John’s, NL, Canada
1 Corresponding author: email address: [email protected]
Abstract
This chapter provides an overview of process safety regulatory and technological evolutions. A shift from personal safety to process safety and an increased attention to corporate safety culture are two primary shifts in process safety and loss prevention strategies for process industries. Other than these sociotechnical developments, this chapter also reviews the latest advancements in risk-based approaches to process loss prevention. Finally, this chapter provides examples of different Methods in Chemical Process Safety (MCPS), which are classified here as methods to identify process hazards and to implement, measure, evaluate, monitor, and manage safety of hazardous processes. Where applicable, a comparison of advantages and disadvantages of different methods is also provided.
Keywords
Risk assessment; Inherent safety; Leading indicators; Process safety management; Layers of protection
1 Background
1.1 Major Accidents Are Still Occurring
The growing dependence of society on energy resources has resulted in extensive exploration of hydrocarbon resources and the rapid development of the process industry. But, has process safety technology developed proportionally to the growth of the process industry? This needs to be investigated but what is clear is that major accidents are still occurring. Does this mean that we do not know what is the right thing to do? Or, do we know but have failed to act? Considering the alarming rate of the continued occurrence of major accidents in the oil and gas industry, the answer to both questions is “Yes,” at least partially. Until we can answer “No” to these questions with confidence, if the future is similar to the past, unfortunately we should expect more accidents. For those who have been in the industry for very long, this is a given assumption.
1.2 People or Systems? Where Does the Blame Lie?
The answer to this question seems obvious. Crowl and Louvar reviewed the causes of the largest hydrocarbon and chemical plant accidents from Marsh's 100 largest losses report in the period from 1972 to 2001 and came to this conclusion: “Human error is frequently used to describe a cause of losses. Almost all accidents, except those caused by natural hazards, can be attributed to human error. For instance, mechanical failures could all be due to human error as a result of improper maintenance or inspection” (Crowl & Louvar, 2011). This conclusion is also aligned with Kletz's statement in his work titled “Still Going Wrong!” that: “Missing from this book is a chapter on human error. This is because all accidents are due to human error” (Kletz, 2004).
In 2005, an explosion at BP's Texas City refinery claimed 15 lives and caused much more injury and destruction. The company's vice president of North American refining testified in 2007 that: “Our people did not follow their start-up procedures […] If they’d followed the start-up procedures, we wouldn’t have had this accident” (Calkins & Fisk, 2007). Later, when it was found that the equipment was substandard, the company questioned managerial decisions to use it. Examples such as these are familiar in the field of professional safety, where expert investigators, managers, and the public respond to accidents by pointing to a “Bad Apple” tendency, and focusing on human failure as the root cause of accidents (Holden, 2009). Accordingly, the oil and gas industry has focused on making progress in process safety by protecting the system from unreliable employees/workers through selection, procedures, automation, training, and discipline.
However, it appears that outside the oil and gas industry, the situation is different, for example, in the aviation and nuclear energy sectors. Studies such as those by Dekker (2001) and Holden (2009) have referred to the “Bad Apple” approach of safety management (in industries such as oil and gas) as the “old view,” according to which one “identifies bad apples (unreliable human components) somewhere in an organization, and gets rid of them or somehow constrains their activities” (Dekker, 2001). In contrast to the “old view” that posits human error as the cause of many accidents, the “new view” considers human error as a symptom of more complicated systematic issues (Holden, 2009). Perhaps this focus on flawed systems rather than human is one of the reasons behind the significantly fewer major accidents in the aviation and nuclear industries. Of course, humans, the creators of the systems, are involved in accidents, but they are not necessarily the sole or primary cause of losses. There is an emerging need for modern safety professionals to “reinvent” the understanding of human error more holistically by tracing the connections between human error and the tools through system-centered solutions. More discussions on the role of human factor in process safety are provided in the chapter “Role of Human Factor in Process Safety” by Mearns.
1.3 Learning From the Experience
Unfortunately, there is no shortage of new accident reports. Accident investigation reports are influential documents in the growth of process safety science. They are very beneficial in the light of what the industry currently knows—or assumes—about the nature of accidents (Lundberg, Rollenhagen, & Hollnagel, 2009). However, time, distance, and cultural challenges such as litigation, fear of adverse publicity, internal procedure, and disclosure of confidential information may influence how well the industry learns from its previous mistakes (Kletz, 2004). Usually, only those incidents that have had catastrophic consequences are publicized and used for developing new safety barriers. Moreover, some of the incident reports still describe only the immediate technical causes, failing to investigate the accident from different aspects.
The scope of improving process safety should also include learning from near misses. Near misses are symptoms of underlying process issues and provide valuable information to understand how systems work (Dahle et al., 2012). Learning from accidents and near misses requires a system-thinking approach to assess the interdependence of people, technology, and organizations rather than considering these elements in isolation (Dahle et al., 2012; Tjorhom & Aase, 2010; Wiig & Aase, 2007). The main assumption in system-thinking approach is that accidents do not occur solely because of incompetent operators, wrong procedures, poor techniques, faulty processes, or organizational failures. Instead, it is the combination of correlated, multicausal variables that interact to create the conditions in which accidents may occur. Failure to consider all aspects of organizational, cultural, technological, and human factors in accident investigation has usually resulted in the identification of lack of competence, experience, and risk awareness of operators as the primary cause of accidents (Dahle et al., 2012).
According to Lundberg et al. (2009), the causes found during investigations reflect the assumptions in the accident model following the principle of “What you look for is what you find.” Moreover, the identified causes typically become specific problems to be solved during implementation of remedial actions, which follows the principle of “What you find is what you fix” (Lundberg, Rollenhagen, & Hollnagel, 2010). Therefore, the learning process from these experiences should focus on a bigger picture of causes of the wide range of accidents, using a holistic approach that includes all factors involved in accidents.
Another important issue relates to our ability—or lack of ability—to learn from positive results. There are several good examples of where the industry does appear to have learnt from incidents and has made improvements on a global basis (Marsh, 2016). However, in addition to focusing on “what went wrong,” the oil and gas industry can benefit from asking “what went well,” perhaps by examining the aviation, nuclear, and healthcare sectors. The chapter “Learning From the Experience” by Mannan is devoted to learning from the past success and failure experiences.
1.4 Are Major Accidents Black Swans?
“Black Swan” events are extreme and rare events, and in practice impossible to anticipate. Understanding and evaluating the potential exposure to “black swan” events has been a topic of discussion in recent years, particularly in the actuarial industry (Taleb, 2007). As expressed in Marsh's 100 Largest Losses report: “none of the losses listed in this document should be considered black swan events” (Marsh, 2016). Blowouts in drilling and well operations, flooding in distillation processes, runaway conditions in reactor systems, and other extremely dangerous process conditions are all inherent hazards of the process industry and are foreseeable. The disastrous Deepwater Horizon incident in the Gulf of Mexico in 2010, the largest oil spill in oil and gas history, was also not a “black swan” event. “On the day of the April 20 tragedy, no effective safeguards were in place to eliminate or minimize the consequences of a process safety incident” (CSB, 2014b).
Effective process safety management (PSM) should be able to identify safety and security issues that threaten process safety and include appropriate safety barriers and mitigation measures to prevent serious losses. For example, an attack on security (such as a cyber-attack) along with failure of all protection layers in place should not be considered as a “black swan” event. The identification of new and developing threats and forming strategies to prevent and mitigate their impact are integral parts of a continuously improved PSM system.
1.5 Low Oil Prices and Process Safety
There is a concern, from the process safety point of view, that the oil and gas industry will implement cost-cutting strategies to counteract low oil prices, disregarding the fact that lowering safety standards increases not only the possibility of human and environmental harm but also financial loss. Other than the cancellation of new projects and hiring freezes, these strategies unfortunately may include risk control measures, reductions, fewer investments in inspection and maintenance activities, and training cuts. According to research by Marsh, different periods of price falls have been followed by a significant increase in the total values of upstream losses over the past 40 years (Marsh, 2016). Although this correlation between oil price and losses does not imply their causal relationship (Marsh, 2016), it should serve as a reminder that chemical companies and refineries need to continue to invest in process safety and preventive maintenance, even as the economic downturn cuts into sales and profits (Bresland, 2008).
It is understood that the aging infrastructures, limited resources, and increasing production demands, along with fluctuating oil prices, have made investment decision making a challenge for energy companies. Nevertheless, decision makers, if they value safety, sustainability, and profit, should holistically look into this challenge and seek for a balance among cost, risk, and value of cost-saving initiatives over the asset's entire life cycle (ISO, 2014). As famously declared by Dr. Trevor Kletz: “downturns and recessions can actually be a good time to take care of deferred maintenance.” This is because of the reduced financial impact from temporarily shutting down a process during periods when sales are depressed (Bresland, 2008). Cost-saving decisions should be assessed carefully to ensure that all risks introduced to the system are measured and mitigated effectively and also to evaluate their long-term value and impact.
2 Overview of Process Safety
2.1 What Is Process Safety?
The oil and gas industry is an inherently risk-laden sector. The extraction, transportation, and processing of hydrocarbons involve complex operations with high pressure, reactive chemicals, and complex chemistry. Increasing energy demand and related business opportunities have been the main drivers to push the operators to take higher risks by exploring deeper waters and more remote locations with extreme climates. The results have been larger facilities, more complex processes, and compact facility designs.
The continued occurrence of major process incidents has increased the awareness within the process industry about the importance of making development and operational decisions based on a thorough assessment of the associated risks to identify measures that can be taken to prevent potential losses. This increased awareness has shaped and influenced process safety science. Accordingly, API 754 defines process safety as: “a disciplined framework for managing the integrity of hazardous operating systems and processes by applying good design principles, engineering, and operating and maintenance practices” (API, 2010).
Unlike the occupational safety approach, which focuses on hazards that could result in health issues (e.g., slips, trips, and falls), process safety focuses on the identification, prevention, and mitigation of process hazards and near misses that may result in the release of chemicals or energy (HSE, 2015a). Such hazards could ultimately result in serious impacts including human health loss, environmental damage, asset loss, and loss of production. Because of this difference in the scope, the blend of engineering and management skills required to manage process safety exceeds those required for managing occupational safety.
2.2 The Evolution of Process Safety Regulations
“The driving force for process safety has been primarily based on catastrophic events” (Mannan, Reyes-Valdez, Jain, Tamim, & Ahammad, 2016). Lessons learnt from events such as Flixborough (1974, United Kingdom), Seveso (1976, Italy), Bhopal (1984, India), Piper Alpha (1988, United Kingdom), Phillips 66 (1989, United States), BP Texas City (2005, United States), and Deepwater Horizon (2010, United States) have improved safety management systems and technological solutions. These disasters have also framed the global regulatory environment.
Fig. 1 illustrates a few examples of significant industry and process-related incidents and the legislative responses. It was mostly after highly publicized disasters such as those in Flixborough (United Kingdom, 1974), Seveso (Italy, 1976), and Bhopal (India, 1984) that governments and regulatory agencies began to establish what is now called PSM (Khan et al., 2016).

2.2.1 European Union
In Europe, a serious explosion at a chemical manufacturing plant in northern Italy in 1976 spurred the European Union (EU) to adopt, on June 24, 1982, Directive 82/501/EEC on the major-accident hazards of certain industrial activities, also known as the Seveso Directive (EC, 1982). Subsequent incidents led to amendments to the Seveso Directive, and Seveso II (Directive 96/82/EC) was eventually adopted on December 9, 1996 (EC, 1997). In response to incidents such as explosions in the Sandoz chemical plant near Basel, Switzerland in 1986 and the AZF fertilizer factory in Toulouse, France in 2001, the Seveso III (Directive 2012/18/EU) was adopted in 2012 to:
• integrate new categories of fertilizers;
• accommodate additional requirements for preventing environmental damage;
• align national Seveso legislation with the new classification scheme for chemical substances; and
• acknowledge the community's right to know provisions.
The Seveso III Directive was amended in 2013 to include safety of offshore oil and gas operations (Macza, 2008; Sreenevasan, 2015).
2.2.2 United Kingdom
Following the Flixborough (1974) and Piper Alpha (1988) accidents, the Control of Major Accident Hazards (COMAH) Regulations came into force in the United Kingdom on April 1, 1999. The COMAH regulations were further amended in 2005. The purpose of these amendments was to take all necessary measures to prevent major accidents involving dangerous substances. Major onshore hazard regulation in the United Kingdom now derives primarily from the EU's Seveso Directives and is largely implemented by the COMAH Regulations, including Safety Case Regulations (HSE, 2005).
A Safety Case is a structured argument, supported by evidence, intended to provide criteria to judge when a system is acceptably safe for a specific application in a specific operating environment. The Safety Case regulations have implemented the main recommendations of Lord Cullen's Report, derived from the Public Inquiry into the Piper Alpha Disaster (Macza, 2008). The latest revised version of this agreement was slated to be enacted in 2015 (HSE, 2015b). This common-sense approach is a recognized practice in Europe prior to an operating permit being issued and is likely to be adopted internationally by other legislative bodies.
2.2.3 United States
Despite major accidents involving highly hazardous substances, the United States did not have a process safety standard until the early 1990s. In response, Congress required action by both the Occupational Safety and Health Administration (OSHA) and the Environmental Protection Agency (EPA), through amendments to the 1990 Clean Air Act. In 1990, the American Petroleum Institute (API) published API 750, Management of Process Hazards voluntary guidelines. The API standard was a basis for the proposed PSM standard by OSHA, which was published in 1992. One year later, the US EPA released its Risk Management Program (RMP) Rule (McAteer & Whiteman, 1993). Based on this regulation, RMPs must be revised and resubmitted to the EPA every 5 years.
2.2.4 Australia/New Zealand
The Longford explosion in 1998 and the Montara oil spill in 2009 are landmark events that have influenced Australian process safety regulations. These events resulted in the development of the Major Hazard Facilities Regulations in 2004 (Macza, 2008) and the establishment of the National Offshore Petroleum Safety and Environmental Management Authority (NOPSEMA) in January 2012. Now, NOPSEMA operates as a single regulatory body for all offshore operations including major accidents (Sreenevasan, 2015). Australia also follows the Safety Case regime developed in the United Kingdom following Piper Alpha (CAPP, 2014). Unlike Australia, New Zealand does not rely only on regulations. A Business Leaders’ Health & Safety Forum provides guidance and training to Chief Executives in New Zealand. No such initiative or program is available in Australia (Sreenevasan, 2015).
2.2.5 Canada
The 1982 sinking of the oil rig Ocean Ranger, which took the lives of the entire crew of 84 men on the Grand Banks of Newfoundland, is a major disaster in Canadian oil and gas history that has influenced Canadian offshore petroleum safety regulations. As an example, the Newfoundland Offshore Petroleum Drilling and Production Regulations has the requirements for a “Safety Plan,” which requires the identification of hazards and a plan to manage them (C-NLOPB, 2010).
Unlike the offshore industry, PSM in the Canadian chemical industry follows a voluntary path. Canada responded to Bhopal by creating the Major Industrial Accident Council of Canada (MIACC) in 1987 (CAPP, 2014). From 1987 until its dissolution in 1999, this partnership included the federal, provincial and municipal governments, industry, labor, emergency response groups, public interest groups, and academia. This collaboration resulted in the development of a series of industrial guidelines. The application of these guidelines is not mandatory, and the industrial organizations and companies voluntarily adopted them.
The MIACC dissolved in 1999 due to the decline in funding and participation, and the developed intellectual property was transferred in 2000 to the newly created Process Safety Management Division (PSMD) of the Canadian Society for Chemical Engineering (CSChE). CSChE published its PSM standard in 2012 based on the original version of the United States’ Center for Chemical Process Safety (CCPS) PSM guidelines (CSChE, 2012). In 2012, PSDM and the Canadian Chemical Producers Association (CCPA) jointly initiated the Process Safety Network (PSN) and are likely to work more closely together to form a larger PSM body in Canada (Macza, 2008; Sreenevasan, 2015).
2.2.6 Future of Regulatory Focus
A review of the state of current regulations shows an evolution in regulatory thinking that provides a path for advancing process safety within the process industry. Three important shifts are taking place and gaining momentum (CAPP, 2014):
(i) a shift from rule-based to performance-based regulations,
(ii) a shift from personal safety to process safety, and
(iii) increased attention to corporate safety culture.
The regulatory environment will continue to evolve, at least until the process industry achieves a “zero harm” milestone. Hopefully, the global PSM initiatives will not wait for more process-related disasters to ensue. The future evolution of process safety regulations can be obtained through a higher degree of involvement and collaboration among regulators, regulated organizations, and employees. The regulatory context of process safety is discussed in more details in the chapter “Regulatory Context” by Attwood.
2.3 The Evolution of Process Safety Technology
The body of knowledge of process safety in the 1970s was mainly focused on engineering principles. However, process accidents in the early 1980s, such as the Bhopal disaster, brought process safety knowledge into mainstream consideration within the industry. Consequently, the industry started to recognize the importance of engaging management and incorporating social concerns in PSM. In the 1990s, risk-based approaches were developed to include safety in design as well as economic considerations (Khan et al., 2016). Recently acknowledged is the important analysis of the “human factor” to reduce and prevent process safety incidents. Moreover, safety management systems began to be incorporated in regulations and procedural systems around the world (Dahle et al., 2012; Mannan et al., 2016). In the 2000s, the inherent safety approach gained recognition and process safety engineering made significant progress. More recently, the concept of dynamic risk management has been emphasized in process safety literature due to the limitations of traditional risk analysis (Amyotte et al., 2016; Khan et al., 2016). Table 1 demonstrates the industrial initiatives and recommendations that resulted from the investigation of the causes of major accidents since the Flixborough disaster in 1974.
Table 1
Process Safety Initiatives and Technology Development Influenced by Major Incidents
| Year | Accident | Description of Technology Development |
| 1974 | Flixborough |
• Increased attention to risk assessment • Introduction of Management of Change (MOC) • Introduction of Hazard and Operability (HAZOP) study |
| 1976 | Seveso |
• Enhanced inherently safer design • Improved emergency planning and response |
| 1984 | Bhopal |
• Improved release modeling and understanding of runaway reactions • Inherently safer design • Release modeling |
| 1988 | Piper Alpha |
• Stronger implementation of permits to work systems and incident reporting systems • Enhanced emergency response systems • Introduction of “Step Change in Safety” • Enhanced safety training • Changes to platform design |
| 2005 | BP Texas City |
• Improved risk assessment and management of change • Improved process knowledge among senior/corporate management and board members • Increased liability for senior/corporate management and board members • Adequate physical devices and technology (barriers) • Occupational vs process safety indicators |
| 2009 | Montara |
• New requirements for safety barriers risk assessment • Lower threshold for conducting risk assessments and independent reviewing • Operators emergency assistance • Communication and information sharing between stakeholders • Broader context when conducting decisions and risk assessments |
| 2010 | Deepwater Horizon |
• Proposed introduction of a Safety Excellence Institute (Graham et al., 2011) • Stricter operating permit conditions (well integrity and oil-spill response) • Enhanced safety culture • Increased system, operation and risk understanding • Enhanced blowout prevention (BOP) and oil-spill recovery technologies |
| 2013 | West Fertilizer explosion |
• Enhanced emergency response procedures • Establishing safety procedures • Enhanced safety culture |
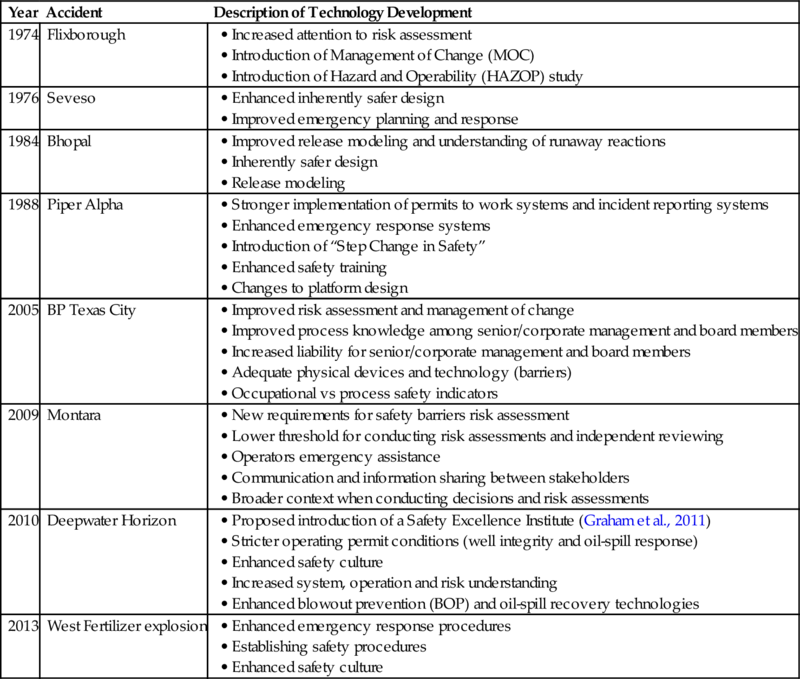
Adapted from Dahle, I. B., Dybvig, G., Ersdal, G., Guldbrandsen, T., Hanson, B. A., Tharaldsen, J. E., & Wiig, A. (2012). Major accidents and their consequences for risk regulation. In Advances in Safety, Reliability and Risk Management: ERSEL 2011 (pp. 33–41). France: Taylor & Francis Group; Mannan, M. S., Reyes-Valdez, O., Jain, P., Tamim, N., & Ahammad, M. (2016). The evolution of process safety: Current status and future directions. Annual Review of Chemical and Biomolecular Engineering, 7, 135–162. https://doi.org/10.1146/annurev-chembioeng-080615-033640.
Other than the regulatory and sociotechnical developments identified in Table 1, another major change in process safety programs has been the introduction of risk-based approaches in the late 1980s. Although different organizations may choose to implement multiple strategies at the same time (CCPS, 2014), in general, there has been an increased focus on risk-based strategies in recent years. The main objective of the Risk-Based Process Safety (RBPS) approach is to help process industries build and operate a more effective PSM system (CCPS, 2007). The chapter “Risk-Based Process Safety” by Seider is devoted to a risk-based approach to process safety management.
In Europe, the Canvey Island (HSE, 1978,1981) and Rijnmond area (Rijnmond Public Authority, 1982) pilot studies are considered as the precursors of RBPS in the chemical sector. In 1988, a project aiming at risk-based decision making was developed in the corporate chemical cluster of Ravenna (Egidi, Foraboschi, Spadoni, & Amendola, 1995). In the European framework, RBPS has been applied to manage, control, and reduce the risk in single facilities and also in large chemical clusters (Rijnmond Public Authority, 1982) and for land-use planning around chemical sites to reduce risk to the population (Christou, Amendola, & Smeder, 1999; Cozzani, Bandini, Basta, & Christou, 2006; Spadoni, Egidi, & Contini, 2000). Publications such as the Dutch “Purple Book” (Uijt de Haag & Ale, 1999) provide guidelines, practical procedures, and data to support such practices. In the United Kingdom and in the Netherlands, such methods are now required to support the implementation of Seveso Directives (HSE, 2015a; Uijt de Haag & Ale, 1999). In the United States, however, risk-based approaches to PSM were introduced much later. It was in 2007 that the CCPS proposed the introduction of risk-based process safety (CCPS, 2007).
The conditions in process facilities are dynamic, with changes in operating parameters often being reflected in changed operating procedures and equipment (NOPSEMA, 2012c). Raw materials’ quality and availability, services’ quality and availability, product quality and throughput, plant equipment availability and environmental conditions, links with other plants, drifting and decaying factors, process materials behavior, plant equipment malfunction, and control system malfunction (Mannan, 2012) along with causes such as mechanical integrity degradation, improper methods, and human factors can cause abnormal situations that can eventually result in severe consequences (Hashemi, Ahmed, & Khan, 2014). However, due to their static structure, conventional risk assessment approaches fail to capture the variation of risks as deviations or changes in the process and plant take place. Dynamic risk assessment has gained increased attention in academia as the next generation of risk and management approaches that help to enable safer complex process systems operating in extreme environments (Amyotte et al., 2016; Khan et al., 2016). However, there is still a compelling need to conduct research on dynamic risk assessment techniques in order to apply them effectively for practical process safety.
3 Methods in Chemical Process Safety
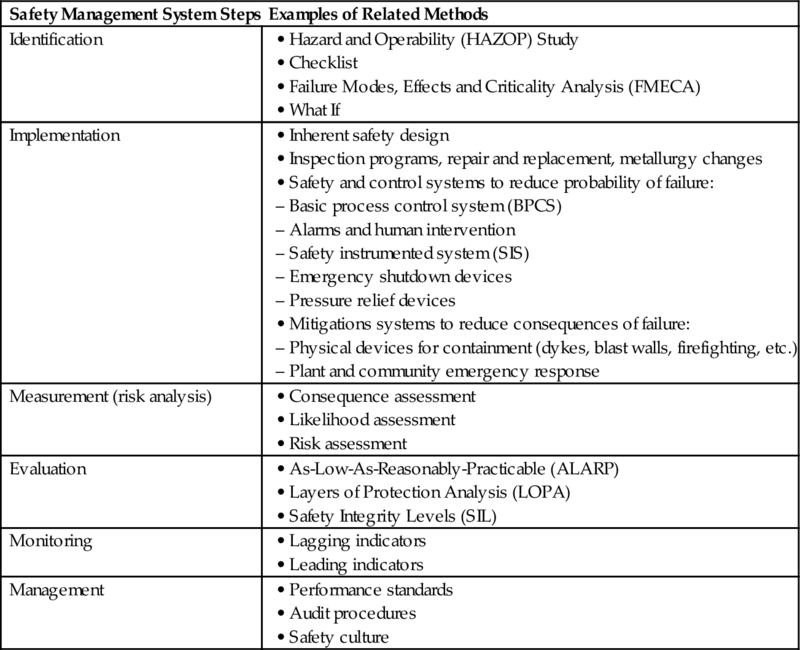
Methods in Chemical Process Safety (MCPS) are defined here as systematic procedures to identify process hazards and to implement, measure, evaluate, monitor, and manage the safety of hazardous processes. Table 2 shows different categories of process safety methods and provides examples for each category. As shown in Table 2, process safety engineering requires a broad understanding of interactions among process design, integrity management methods, process monitoring and control, safety barriers, operating procedures, and PSM systems (Khan et al., 2015; Mannan et al., 2009). The following sections describe different steps and methods identified in Table 2.
Table 2
Steps and Methods in Chemical Process Safety
3.1 Methods to Identify Process Hazards
A hazard is defined as a situation with a potential for causing harm. Hazards are diverse in nature, but they are all potential sources of harm. In the context of the process industry, the potential harm may relate to human injury, damage to the environment, damage to property, or a combination of these. Minimally, a hazard identification (HAZID) process provides the following outcomes (NOPSEMA, 2012b; WorkSafe, 2011):
• identifies all major incidents that could occur at the facility (irrespective of existing control measures);
• shows clear links between hazards, causes, and the potential events;
• provides a systematic record of all identified hazards and major incidents along with related assumptions; and
• provides a basis for identifying, evaluating, defining, and justifying the selection (and rejection) of control measures for eliminating or reducing risk.
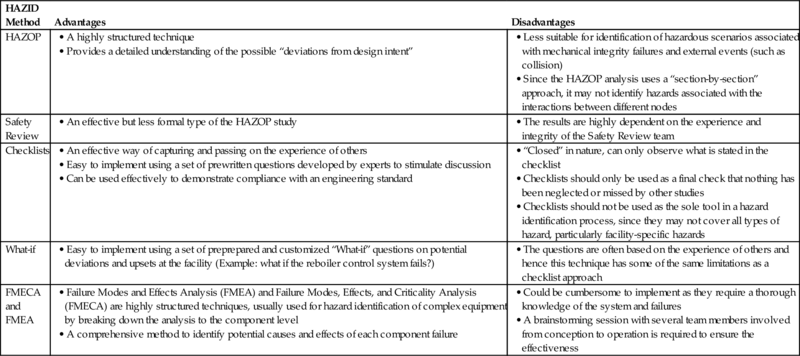
The HAZID step is inherent in all risk assessment approaches. There are several methods for performing HAZID, not all of which serve necessarily as the best technique for a particular application. Most companies use their experience to choose or adapt a HAZID technique for their operations (Crowl & Louvar, 2011). In selecting the appropriate HAZID technique, the nature and scale of the installation, the stage in the process life cycle, and experience of similar installations should all be considered. The level of effort devoted to HAZID should be based on the anticipated level of risk and any limitations in knowledge (ISO, 2002). In broad terms, the HAZID technique selection can be quite separate from the subsequent risk assessment approach. Thus, an initial HAZID may support both qualitative and semiquantitative risk assessments, whereas a more detailed HAZID can support any level of risk assessment. Table 3 provides a list of frequently used HAZID methods along with their benefits and disadvantages.
Table 3
Hazard Identification Popular Methods (CCPS, 2008a; Crowl & Louvar, 2011; ISO, 2002; NOPSEMA, 2012b)
3.2 Methods to Implement Process Safety
3.2.1 Diversity Is a Key to Implement Process Safety
Different strategies can be applied to implement process safety. Crowl and Louvar classified process safety into four different strategies (Crowl & Louvar, 2011), as shown in Table 4. Inherent safety design (ISD) is the most preferred strategy, focusing on the elimination of hazards. If the elimination of a hazard is not possible, ISD focuses on minimizing the hazard. Passivity is the next preferred strategy in process safety implementation since the operation of passive safety components (PSCs) is connected only with the triggering event. The passivity concept, which is a highly recognized approach in nuclear engineering (IAEA, 2009), eliminates the dependency of safety components on the operation of power sources and other active components such as a control system.
Table 4
Process Safety Strategies (Crowl & Louvar, 2011; IAEA, 2009)

Inherently safer designs and PSCs are the most reliable and robust process safety strategies. However, achieving process safety solely through ISD and PSCs is difficult in practice and elements of active and procedural safety strategies are also required to minimize process safety issues. This diversification is key to ensure the reduction of failure probabilities while mitigating the consequences of potential failures. While active safety barriers such as control systems reduce the probability of failures, passive and procedural strategies primarily help to mitigate the severity of losses (Crowl & Louvar, 2011). ISD, which is the most preferred approach to implement process safety, helps to reduce both the probability and consequences of failures (Amyotte, Goraya, Hendershot, & Khan, 2007). These different strategies supplement each other and, generally, none of them can be substituted for other methods.
3.2.2 Layers of Protection
To implement process safety strategies, an array of protective layers are required to reduce the risk of an operation due to identified hazards. Fig. 2 demonstrates the concept of layers of protection using the “onion model.” Layers of protection include the physical features of a facility and elements of human intervention which eliminate, prevent, reduce, or mitigate the risk of hazardous events. They can take many forms, including physical equipment, process control systems, and safety devices as well as operating and management processes (NOPSEMA, 2012a).
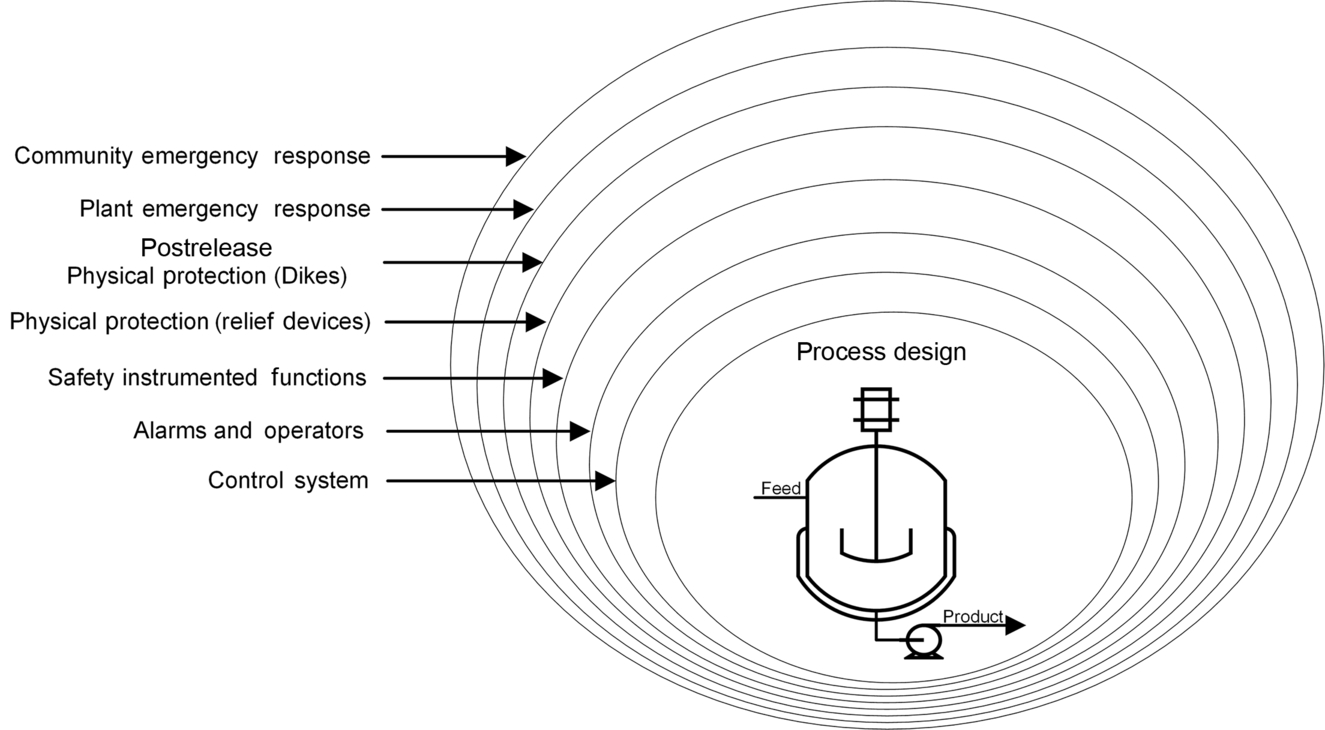
The principles of inherent safety should be taken into consideration when designing layers of protection to ensure their reliability and robustness. These protection layers should be independent to avoid potential failure of multiple layers due to a common cause. For example, malfunction of a pressure sensor can cause failure of both control and safety instrumented systems if they share the same sensor. Moreover, a proper maintenance management program is required to avoid the degradation of protection layers’ effectiveness.
A review of incident investigation reports indicates that usually a coincidence of several events and failure of multiple safety barriers causes process safety incidents. Fig. 3 shows the “Swiss Cheese Model,” originally proposed by Reason (1990), which is frequently used to demonstrate the relationship between hazards and sequential failures of multiple safety barriers that eventually cause an accident. Hart (2003) represented Reason's model as a set of spinning disks with variably sized holes, recognizing the dynamic relationship between process hazards and safety barriers. Based on the “Spinning Disk Model,” the type and size of holes (weaknesses) in each protection layer (safety barrier) change over time, and the alignment of the holes constantly shifts. Fig. 3 illustrates both models. In both models, protection layers can be active, passive, or procedural. Holes in each protective layer can be latent, incipient, or actively open (API, 2010).
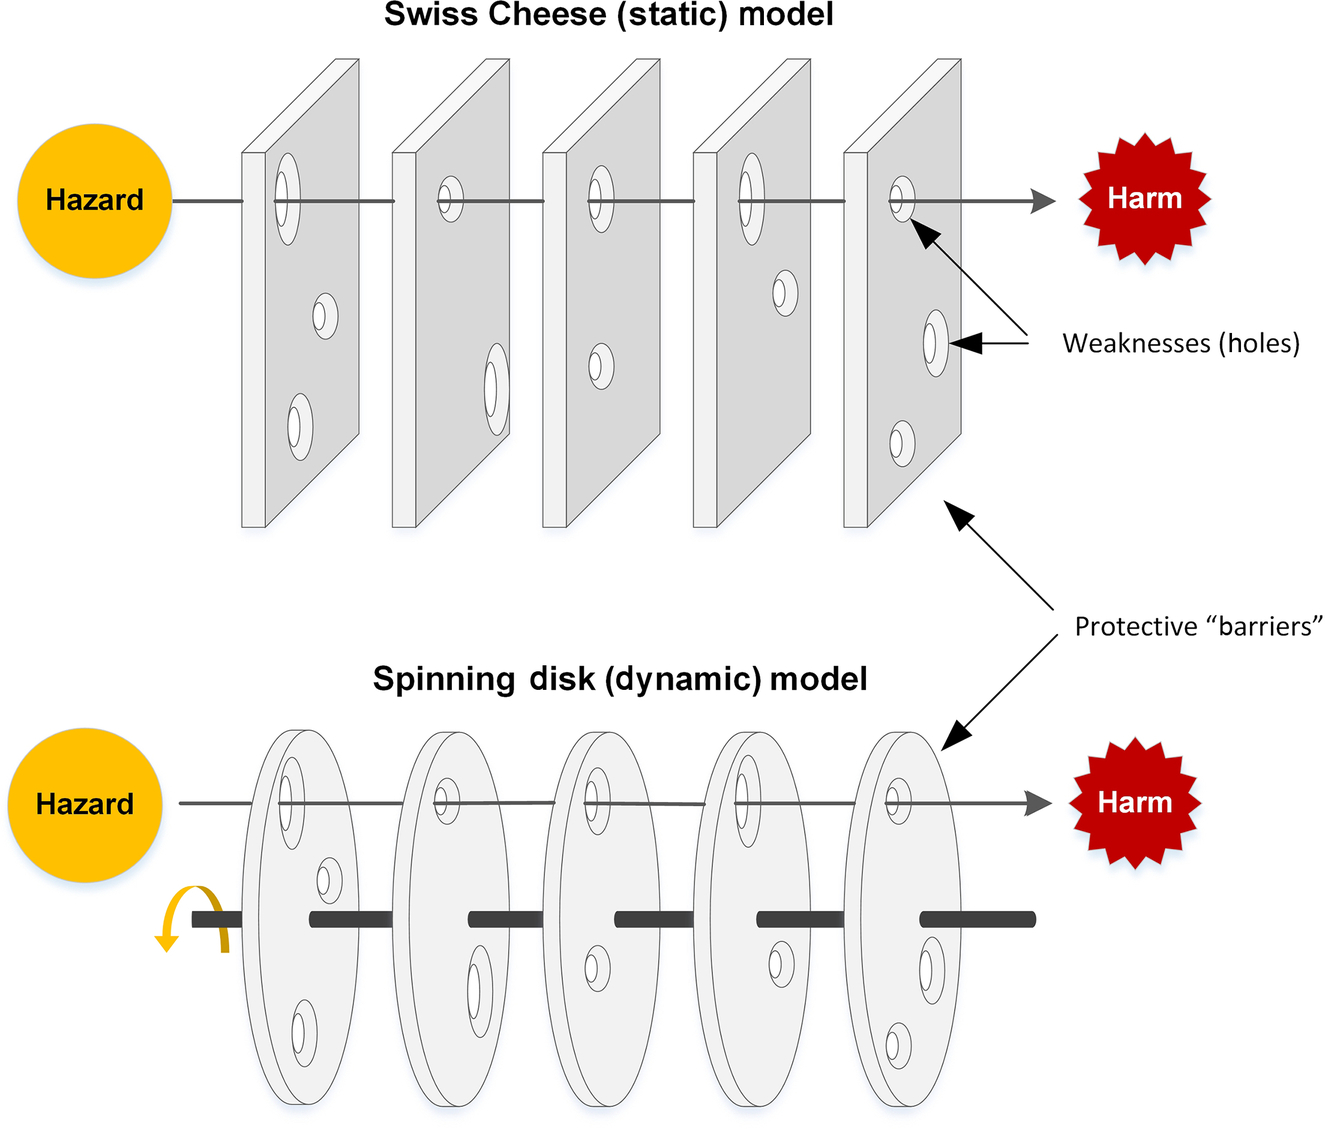
As discussed earlier, protective layers have their own life cycle and, therefore, their effectiveness degrades over time due to natural and assignable causes. Consequently, putting too much reliance on a single, or a few, protective layer(s) should be avoided. Moreover, the type of required protective layer for a given system could vary during the system's life cycle. Although process design is an important process safety factor for a new system, inspection and maintenance may need to receive more consideration at later stages of the system's life. Finally, methods such as Layers of Protection Analysis (LOPA) should be used to investigate the amount of risk reduction of each protective layer to ensure an adequate level of protection for each hazard (NOPSEMA, 2012a).
3.2.3 Inherent Safety Design
Explicit incorporation of the principles of inherent safety in safety management can help to enhance the effectiveness of the safety management process and minimize the inherent risk (Amyotte et al., 2007). There is a fundamental difference between the inherent safety approach to loss prevention and engineered and procedural safety. While the latter two approaches accept the hazard, and use physical barriers and administrative controls to mitigate the effects, the inherent safety approach seeks to eliminate the hazard at the source. Considering the criticality of operations, therefore, the “explicit incorporation” of inherent safety principles in marine and offshore engineering is of paramount importance (Amyotte et al., 2007).
Minimization (intensification), substitution, moderation (attenuation), and simplification are four fundamentals of inherently safer design of offshore facilities (Khan et al., 2013), also referred to as ISD guidewords. Table 5 provides the description of these guidewords, along with example checklist questions to implement them.
Table 5
Inherent Safety Guidewords and Example Checklist
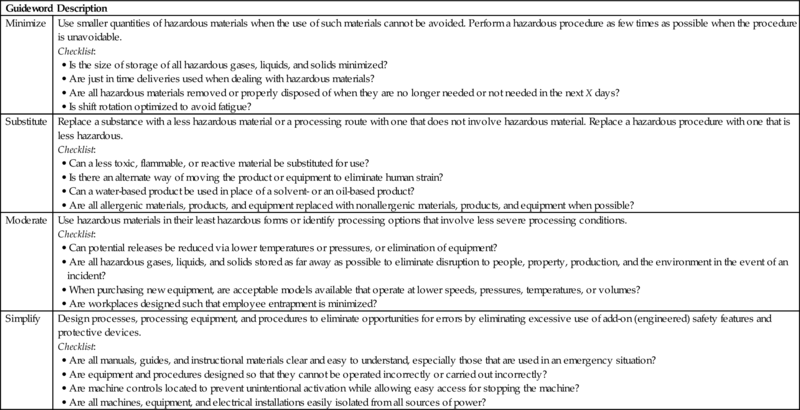
Adapted from Amyotte, P. R., Goraya, A. U., Hendershot, D. C., & Khan, F. I. (2007). Incorporation of inherent safety principles in process safety management. Process Safety Progress, 26(4), 333–346. https://doi.org/10.1002/prs.10217; Khan, F., & Amyotte, P. R. (2005). I2SI: A comprehensive quantitative tool for inherent safety and cost evaluation. Journal of Loss Prevention in the Process Industries, 18(4–6), 310–326. https://doi.org/10.1016/j.jlp.2005.06.022; Khan, F. I., & Amyotte, P. R. (2002). Inherent safety in offshore oil and gas activities: A review of the present status and future directions. Journal of Loss Prevention in the Process Industries, 15(4), 279–289. https://doi.org/10.1016/S0950-4230(02)00009-8.
3.2.4 Automation and Redundancy to Ensure Safety
Process safety system automation is required to ensure timely action when equipment and operators fail. Automated safety systems consist of different components, failure of which can result in failure of the associated safety system that can eventually result in unsafe process conditions. To tackle this problem, redundancy is used in process safety engineering to ensure that safety devices continue to perform their defined function when a single instrument or control function fails. An example is the inclusion of an additional flow meter in an abrasive process to increase the reliability of a flow control system and protect the system from a potential flow meter failure. The level of redundancy required for a particular safety system depends on the criticality of the operation. Standards such as ANSI/ISA-S84 (ISA, 1996) and methods such as Safety Integrity Level (SIL) analysis (ISA, 2002) can be used to determine the required level of redundancy.
3.3 Methods to Measure Process Safety
3.3.1 Overview
“Risk” is used as a measure of safety and is defined as the combination of three attributes: what can go wrong, how bad could it be, and how often might it happen. The purpose of risk assessment is to help all stakeholders understand the risks to health and safety and address potential major-accident events in a structured manner. Moreover, risk assessment is now a regulatory requirement in different parts of the world. For example, the Safety Case regulations in the United Kingdom, EU, and Australia require the operators of offshore facilities to conduct a detailed and systematic formal safety assessment, which includes the assessment of risk in relation to all potential major-accident events before an operating permit is issued (HSE, 2015b; Macza, 2008; NOPSEMA, 2012c; Sreenevasan, 2015). In the United States, the RMP Rule requires facilities that use extremely hazardous substances to develop a Risk Management Plan and submit revised plans to the EPA every 5 years.
Different industries and regulatory agencies have developed several risk assessment techniques, including qualitative, semiqualitative, and quantitative approaches. Qualitative approaches provide the least degree of insight, but are easiest to apply because they require the fewest resources and fewer skill sets. Quantitative Risk Assessment (QRA) approaches deliver the most detailed understanding and provide the best analysis if supported by adequate resources. Semiquantitative approaches lie in between these extremes.
The aim of all three approaches is to help operators understand the risk levels. Risk assessment also provides a basis for identifying, evaluating, defining, and justifying the selection or rejection of protective layers for eliminating or reducing risk. No matter which risk assessment approach is used, subjective and expert judgments are an essential part of risk assessment. Therefore, it should be noted that the estimated risk using any approach provides a relative criterion, not an absolute measure, to rank assets and prioritize plans.
3.3.2 Selection of Approach
Selecting the best approach to risk assessment could be challenging due to the existence of different options. While there is no single correct approach for a specific activity, there are approaches that are more suitable than others, and a decision framework is helpful in the selection process (DNV, 2001). The operators should therefore choose the right level of risk assessment to help them link the identified hazards, the adopted protective layers, and the demonstration of As-Low-As-Reasonably-Practicable (ALARP) risk within their operations.
The HSE's Guide to the Offshore Installations (Safety Case) Regulations (HSE, 1998) gives a brief indication of the type of risk assessment expected: “The evaluation of risk should involve both a qualitative and quantitative approach. Where relevant good or best practice is clear, the balance should be in favor of qualitative arguments to show that the risks have been properly controlled. Where relevant good or best practice is less clear, appropriate support from quantitative arguments will be necessary” (HSE, 1998).
The type, complexity, and criticality of operations are important decision factors to select an appropriate risk assessment approach. The selected approach should assist the users in understanding and selecting control and risk reduction measures. Furthermore, it should be capable of assessing the potential effects of risk reduction measures (NOPSEMA, 2012c). Overall, the selection of the risk assessment technique should be done based on the level of detail required as well as on the available resources.
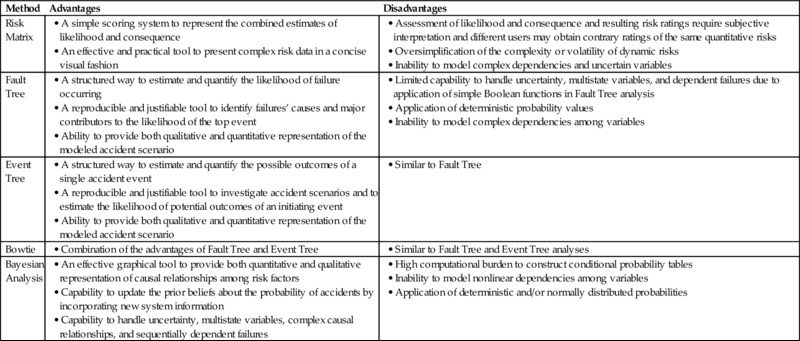
Table 6 depicts the most popular risk assessment techniques. The methods identified in Table 6 are selected examples among many to illustrate different approaches. The purpose of Table 6 is to provide a high-level comparison of different techniques. A detailed or comprehensive description of risk assessment techniques is not within the scope of this work and an interested reader may refer to several published works on this topic (API, 2016; Modarres, 2006; Rathnayaka, Khan, & Amyotte, 2011; Rüschendorf, 2013).
Table 6
Popular Risk Assessment Methods
3.4 Methods to Evaluate Process Safety
While risk assessment techniques such as Risk Matrix and Bowtie help to measure the safety of a particular process, safety evaluation methods use risk assessment techniques to assess the adequacy of the layers of protection provided for an activity. Table 7 provides a list of frequently used process safety evaluation methods, which are ALARP and LOPA. These are very established techniques in process industries with a well-defined and specific purpose. The main objective of these methods is to ensure an adequate reduction in risk by taking into account the effectiveness of existing control measures. The outcomes of these methods can help decision makers evaluate the necessity of adding alternative control measures to ensure compliance with defined risk thresholds.
Table 7
Popular Methods to Evaluate the Adequacy of Control Measures (Dowell, 1998; NOPSEMA, 2015)

Many process safety regulations, such as the Safety Case regulations in the United Kingdom, EU, and Australia, require the operators to demonstrate that they have reduced the risks to a level that is ALARP (HSE, 2015b; Macza, 2008; NOPSEMA, 2015; Sreenevasan, 2015). This means that the operator has to show, through reasoned and supported arguments, that there are no other practical measures that could reasonably be taken to additionally reduce risks (NOPSEMA, 2015). In practice, a combination of approaches is likely to be employed to provide the required evidence for ALARP in a process plant. A systematic and detailed HAZID and risk assessment are fundamental requirements to demonstrate that the risks are reduced to a level that is ALARP, as they provide the foundation on which to base the control measure selection. The guidance notes provided by the United Kingdom's Health and Safety Executive (HSE) (HSE, 2001) and Australia's National Offshore Petroleum Safety and Environmental Management Authority (NOPSEMA, 2015) are good ALARP guidelines for operators.
The SIL is a target level of risk reduction provided by a safety function and is defined in terms of Probability of Failure on Demand (PFD) (ISA, 1996). In plain words, SIL is a measurement of performance required for a Safety Instrumented Function (SIF). SILs are usually determined using the LOPA method. LOPA is usually performed after the HAZID step (such as a HAZOP study). The first step in LOPA involves the application of risk assessment techniques, such as Fault Tree and Event Tree analyses, to identify causes of potential consequences and estimate their likelihood. Then, a PFD will be assigned to each Independent Protection Layer (IPL), including the control system, alarms, and emergency shutdown devices. These PFDs will be multiplied by the probability of an initiating event to estimate the probability of potential outcome events. The mitigated event probabilities will be compared with the corporation's threshold risk values to make a decision about the adequacy of IPLs (Dowell, 1998; ISA, 1996).
3.5 Methods to Monitor Process Safety Performance
3.5.1 Overview
Although development of Safety Performance Indicators (SPIs) is a relatively new concept in the field of process engineering, the process industry appears to be a role model in terms of standard harmonization. Following several major process safety-related incidents, organizations such as the United Kingdom's Health & Safety Executive (HSE, 2006) and the United States’ Center for Chemical Process Safety (CCPS, 2008b) recognized the emerging need for improved SPIs through publication of recommended guidelines to develop and implement SPIs. This resulted in a significant effort by the American Petroleum Industry (API) to develop and publish the ANSI/API Recommended Practice (RP) 754 on Process SPIs in 2010 (API, 2010). CCPS elected to update the original document (CCPS, 2008b) using the CCPS metric recommendations with minor revisions with the intent to align the CCPS and API RP 754 documents. Later, in 2011, the International Association of Oil & Gas Producers (OGP) adopted the ANSI/API RP 754 standard to build a similar framework for the upstream industry (OGP, 2011). Academia has also responded to the need for improving SPIs. An example is the risk-based process performance indicators developed by Khan, Abunada, John, and Benmosbah (2010).
3.5.2 Lagging vs Leading Indicators
One of the most important and challenging issues for process safety is detecting early signs of deterioration of process safety performance caused by operation, maintenance, management, organization, and safety culture factors before accidents happen. A review of safety management procedures and corporate annual reports shows that the process industry tends to rely on “lagging” indicators such as lost time injuries, OSHA incidence and fatality rates, and lost workdays to assess safety performance. Although these indictors serve a purpose, they monitor events after their occurrence (Khan et al., 2010). As mentioned by the US CCPS, “facilities should monitor the real-time performance of management system activities rather than wait for accidents to happen. Such performance monitoring allows problems to be identified and corrective actions to be taken before a serious incident occurs” (CCPS, 2007). Early warning of dangerous deterioration within critical systems provides an opportunity to avoid major incidents (HSE, 2006).
Recognizing the importance of both reactive and active monitoring of safety management systems, the United Kingdom's HSE introduced the concept of “dual insurance” in 2006. HSE recommended that leading and lagging indicators be set in a structured and systematic way for each critical risk control system within the whole PSM system (HSE, 2006). Later, API, CCPS, and OGP adopted the same concept. Lagging indicators are a form of reactive monitoring (HSE, 2006) and describe events that have already occurred which may indicate potential recurring problems and may include fires, releases, and explosions (API, 2010). Leading indicators are a form of active monitoring (HSE, 2006) and indicate the performance of the key work processes, operating discipline, and protective barriers that prevent incidents.
Lagging indicators tend to be outcome oriented and retrospective, while leading indicators tend to be forward looking (API, 2010). As discussed by API RP 754, the differentiation or classification of indicators as lagging or leading is not important. Instead, the focus should be on capturing and analyzing the information to correct a situation, identify lessons learned, and communicate this knowledge (API, 2010).
3.5.3 Selection of Indicators
API RP 754 presented a process safety pyramid (API RP 754, 1st ed.) with four classifications or tiers (API, 2010). The tiers of the pyramid represent a continuum of leading and lagging process safety indicators. The four tiers are expressed as a triangle to emphasize that statistically larger data sets are available from the indicators at the lower tiers (OGP, 2011). Tiers 1 and 2, at the top of the pyramid, are more lagging and cover less severe incidents. Some examples of Tiers 1 and 2 lagging indicators include metrics to measure injury, fire and explosions, Loss of Primary Containment (LOPC), releases, and pressure relief devices’ activation. Tiers 3 and 4 provide more leading measures. Metrics to measure mechanical integrity, follow-up action items, management of change, process safety training and competency, safety culture, operating and maintenance procedures, and fatigue risk management are primary examples of leading indicators.
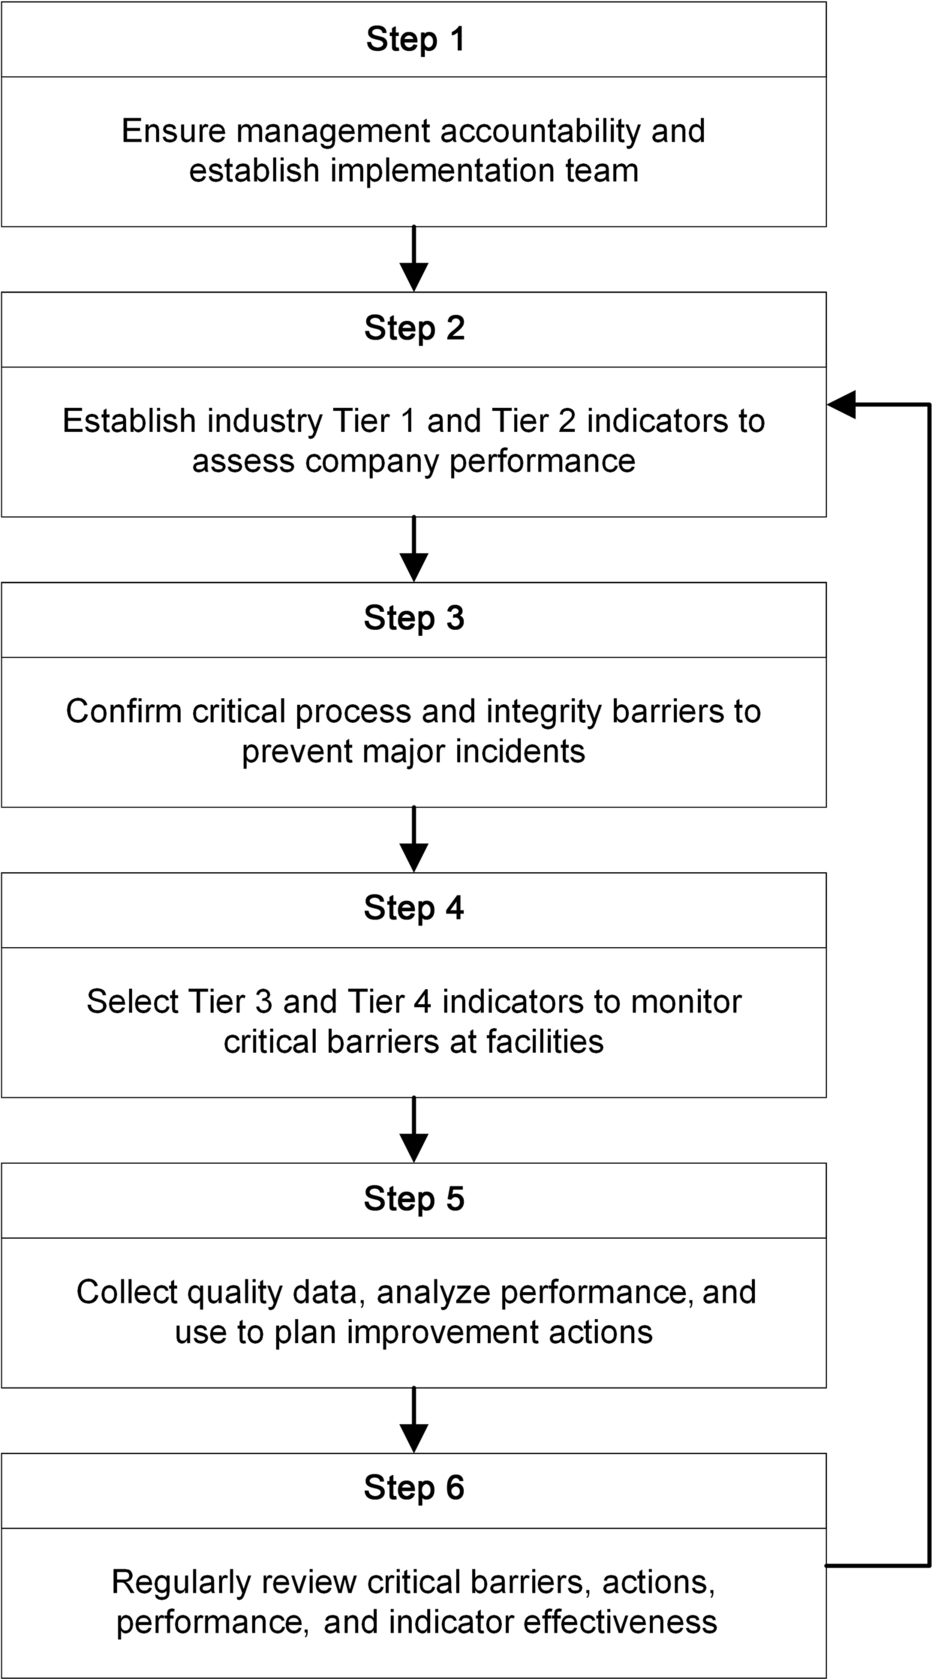
Selection of indicators is important since some indicators may not provide the needed insights to ensure desired performance. The United Kingdom's HSE provided a six-step approach to identify appropriate barriers and select indicators (HSE, 2006), which was later further developed in a CCPS book on process safety metrics (CCPS, 2011). Fig. 4 depicts a procedure for selection and review of process safety indicators. Companies should choose the actual indicators based on their understanding of the most critical risk control barriers, whether the barriers are facility specific or apply to groups of similar facilities or even apply across the whole company. API RP 754 for the refining and petrochemical industries and the OGP recommendations for drilling and production operations are great resources to help companies select and use their process safety indicators.
3.6 Methods to Manage Process Safety
3.6.1 How Are Different Process Safety Methods Related?
Review of the investigation reports of several major process-related accidents reveals the fact that the main root causes of these accidents were primarily cultural issues, not just technical problems. It has been shown in numerous studies that these accidents might have been prevented if a risk-focused approach was integrated into the management framework (CSB, 2014a; Khan et al., 2016; Paltrinieri, Khan, & Cozzani, 2014). Hendershot states: “We know how to improve process safety performance. Our biggest challenge is not technical, it is cultural. We need to actually do what we already know how to do, we need to do it well, and we need to do it everywhere and all of the time” (Hendershot, 2012). Thus, the development of a strong safety culture is required to continuously monitor process safety performance and record incidents (Paltrinieri et al., 2014). Then, the new evidence from the system should be incorporated in the risk assessment process to revise and update the risk assessment results. Moreover, the integration of the HAZID and risk assessment processes within a management framework is essential to ensure continuous improvement through the application of the revised risk profile in the decision-making process.
Each category of the process safety methods described in this section serves a specific purpose. Different methods complement each other to ensure the development of a robust and effective PSM system. However, the selection and application of proper process safety methods and their integration with a management framework may seem demanding and complicated. To address this potential challenge, the integration of the Plan-Do-Check-Adjust (PDCA) management method (ISO, 2015) with different process safety methods is proposed in Fig. 5.
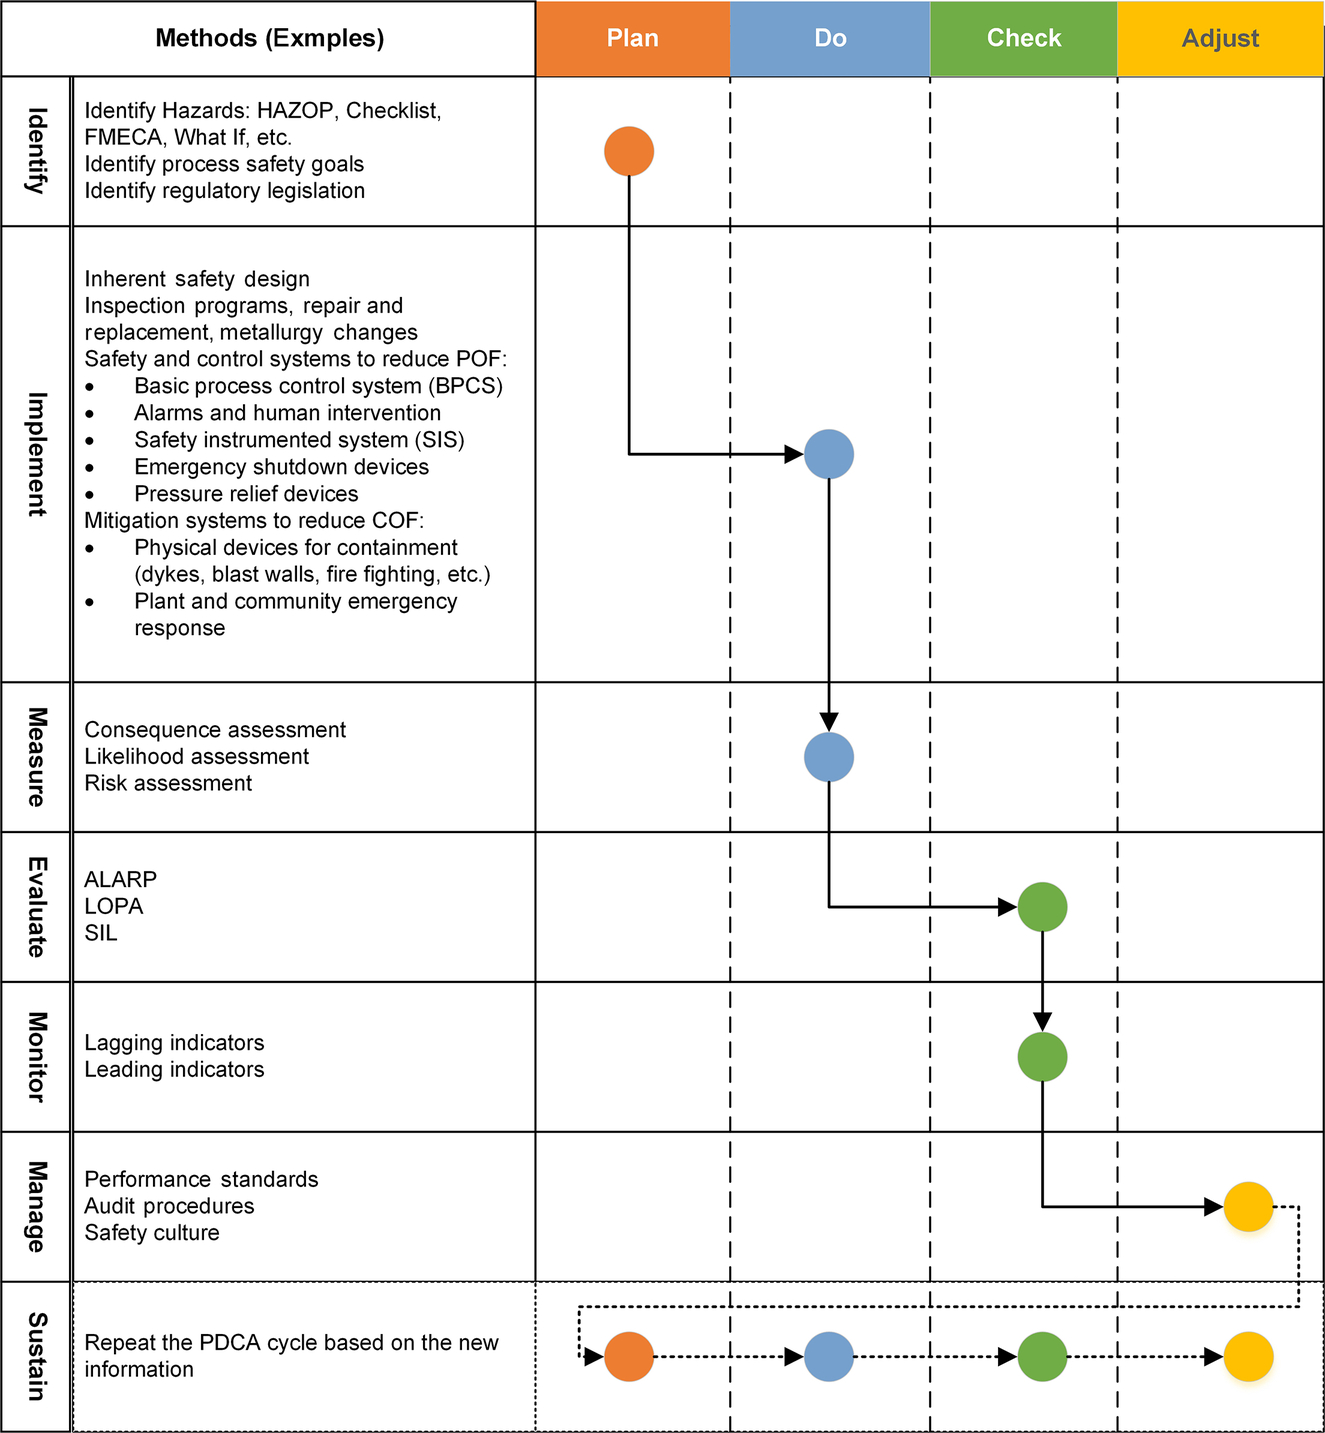
Fig. 5 also shows the relationship between different categories of process safety methods with an overall safety management system. As highlighted in Fig. 5, a fundamental principle of a successful PSM system is iteration—once triggered, the presented PDCA cycle ensures control and continuous improvement of process safety and provides support to avoid the lack of a reporting and learning culture (Khan et al., 2016). The integration of the PDCA cycle with process safety methods ensures the consistent implementation of these methods on a sustainable basis to achieve a “zero harm” culture for process operations.
3.6.2 PSM Elements
The United States’ CCPS published its guidelines for RBPS in 2007 and introduced 20 elements of a successful PSM system. These elements expand on the original CCPS PSM elements to reflect PSM implementation experience, best practices from a variety of industries, and worldwide regulatory requirements. These PSM elements can be designed and implemented at varying levels of enforcement to optimize PSM performance, efficiency, and effectiveness. The new elements also help eliminate gaps and inconsistencies that have contributed to PSM failures (CCPS, 2014).
The RBPS elements are meant to apply to the entire process life cycle. Some elements may not be active in early life cycle stages; but for some elements, the early life cycle stages provide a unique opportunity to minimize risk, for example, by identifying and incorporating inherently safer process characteristics early in project development. In later stages, such as decommissioning, some work activities may not be as important or may no longer be needed, while others may be simplified (CCPS, 2014). The chapter “Elements of Process Safety” by Amyotte discusses PSM elements in more details.