
HOUR 20
Creating a Report from Several Different SPF 2010 Lists
What You’ll Learn in This Hour
![]() Introduction to creating a report from two or more SharePoint Lists
Introduction to creating a report from two or more SharePoint Lists
![]() Creating a two-lists/tables report with the assistance of the Report Wizard
Creating a two-lists/tables report with the assistance of the Report Wizard
![]() Creating a two-lists/tables report manually using Design View
Creating a two-lists/tables report manually using Design View
![]() (Q&A) How to cope with an address change of the SharePoint site
(Q&A) How to cope with an address change of the SharePoint site
After looking at creating a report from a single list in the previous hour, we now move on to creating a report from two lists. There are three main options: You can try (and fail) to create a report with a wizard; you can create a report with a wizard but only use fields from one list (and then add fields from the second list manually); or you can create a report entirely manually. The second and third options are covered in detail here.
Introduction to Creating a Report from Two or More SharePoint Lists
In this section, we create a report from two or more SharePoint lists.
Adding a Second List and Making It Available as a Table
In this hour, we create a report from two SharePoint lists that share a common field. To do this—for reasons explained in Hour 19, “Producing a Report from a Single SPF 2010 List,”—we use Access 2010.
We already have the CompanyStaffNumbers List stored as a table in BookData-base19, so the initial task in this section is to first create a second SharePoint list and then use the same technique as for that first list to move it to BookDatabase19.
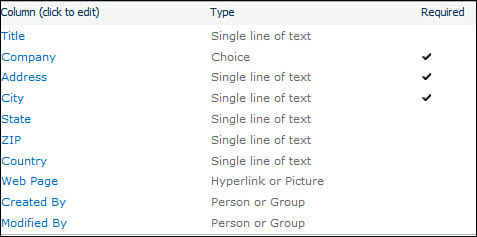
Again the technique is to create a new Custom List as we have done before. This time the Custom List will be called CompanyAddresses and will have columns, as shown in Figure 20.1. Again remove the title field from the All Items view.
FIGURE 20.1 Columns in Company-Addresses
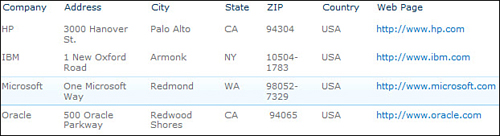
For this to make sense when used in connection with the existing list, you need to add a single item each for HP, IBM, and Oracle giving their company details. I’ll also add the same information for Microsoft because I expect to add information for Microsoft to the CompanyStaffNumbers list some time.
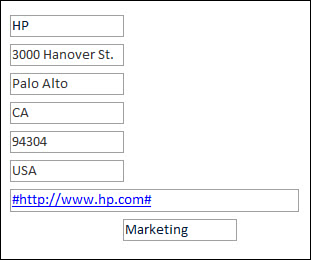
Figure 20.2 displays the added data.
FIGURE 20.2 Company addresses
The next steps are to create an Access 2010 table from an SPF 2010 List using the technique described in Hour 18 in the “Scenario 1: Creating a Linked Access 2010 Table from a SharePoint List” section. Start this time from step 3 there (Select External Data) after having opened BookDatabase19 in Access 2010.
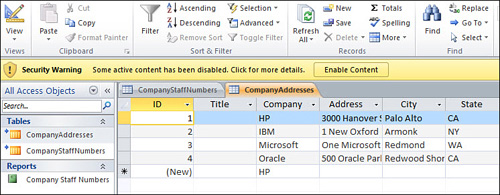
Now that both Lists are present in the Database as two tables (see Figure 20.3), we can use them to create a report.
FIGURE 20.3 The starting point for report creation from two lists/tables
A Description of the Report We Want to Create
The idea in this hour is to show how to add the official company address for each company to the report we created in the previous hour.
Creating a Connection Between the Two Tables
To create a report from two lists, we need to indicate how the two lists relate to each other. Because the SharePoint lists are stored in Access 2010 as tables, this means we need to create a connection between two tables. Here are the steps needed to do that:
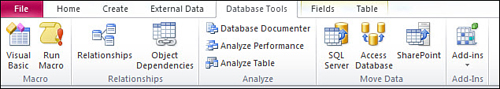
1. Select Database Tools, as shown in Figure 20.4.
FIGURE 20.4 The External Data ribbon
2. Select Relationships (see Figure 20.5).
3. The next step is to link the two tables via the Company address. There are two ways to do this:
Method A is to click Company in the Company Address box in the central section of the screen (which selects this field) and then to drag the cursor across to the Company line of the Company Staff Numbers box.
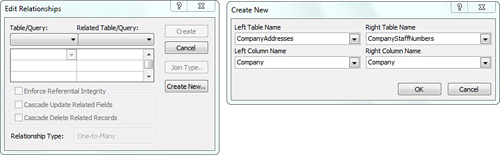
Method B is to click Edit Relationships, as shown in Figure 20.5, and then click Create New in the Edit Relationships window (left part of Figure 20.6). After moving the new Create New window across and after filling in the details needed in the new window, this displays in the right part of Figure 20.6 where you confirm your selection with OK followed by Create in the Edit Relationships window.
FIGURE 20.5 Listing of the only possible tables for a relationship
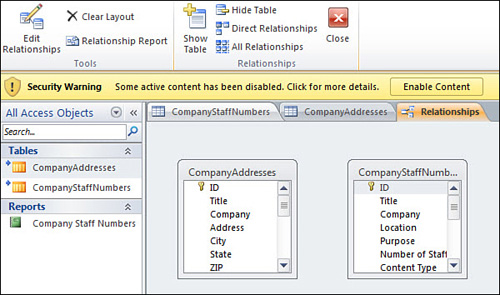
FIGURE 20.6 Specifying the relationship
In both cases, what you now see in Figure 20.7 is a link between the Company field in Company Addresses and the Company field in CompanyStaffNumbers.
FIGURE 20.7 Two Company fields connected
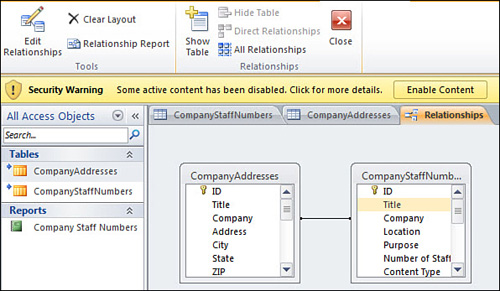
4. The final step is to close the Edit Relationships action with Close in the ribbon in Figure 20.7. This takes us back to our starting point (Figure 20.3) before we created the relationship between the two tables.
Deciding Whether to Use Report Viewer or Design View
Now we are faced with a decision:
![]() Do we use Report Wizard to create the report?
Do we use Report Wizard to create the report?
![]() Do we use Report Design to create the report?
Do we use Report Design to create the report?
Actually those are the wrong questions because the Report Wizard, even in the simpler case of a report from only one list/table, produced a report that we needed to edit using Design View.
So the questions should actually be
![]() Do we use Report Wizard to create a preliminary report and then use Report Design to refine it?
Do we use Report Wizard to create a preliminary report and then use Report Design to refine it?
![]() Do we use only Report Design?
Do we use only Report Design?
In my earlier book’s hour on using Access 2007 with WSS 3.0 lists, I recommended using the Report Wizard only with single lists and never using Report Wizard with multiple lists/tables. Also with the combination of Access 2010 and SPF 2010, my tests have shown that you cannot specify the fields from two lists/tables and expect the Report Wizard to work out where you want the fields from the second table to appear.
In the present case, we have what seems to be a simple situation. We have a report where the Company is the first level of heading and where we use data from one List (CompanyStaffNumbers) in subheadings and the detail lines. The second list/table (CompanyAddresses) contains a single record for each Company. Logically therefore this is data that will occur only once per company, and we want it added to the place in the record where the Company name is.
Even in this simple case, the Report Wizard doesn’t work as we want:
![]() It puts all the extra company information from CompanyAddresses in the details section.
It puts all the extra company information from CompanyAddresses in the details section.
![]() Even there, data is only visible for Country and Web Page.
Even there, data is only visible for Country and Web Page.
Because the simple Report Wizard method won’t work properly, the following sections cover the two main alternatives to that. The following section creates the report utilizing the Report Wizard followed by manual amendments in Design View, and the final section creates the report using the Design View from the start.
Creating a Two Lists/Tables Report with the Assistance of the Report Wizard
The first step in creating this report is almost identical with the report produced in Hour 19. There is one key difference between the situation now and the situation then; therefore, I repeat the steps required until we reach that point.
Here are the steps for creating a basic report on two lists/tables using Report Wizard:
1. As shown in Figure 20.3, click Create.
2. Click Report Wizard (on the ribbon).
3. Ignore the Potential Security Concern (see Figure 19.4 in the previous hour) by clicking Open. This displays Figure 20.8.
FIGURE 20.8 Starting to specify the report
4. As shown in Figure 20.8, change the table to be used to CompanyStaffNumbers. From now on, we follow the actions made in Hour 19, so the rest is without screenshots.
5. Move the Company, Purpose, Location, and Number of Staff fields across to the right column.
6. Click Next.
7. Group on Company and Purpose as we did in Hour 19 (see Figure 19.6).
8. Click Next.
9. Specify that Sort is to be on Location.
10. As in Hour 19, click Summary options and complete the box that follows as was done in Figure 19.8 (by specifying Sum for the Number of Staff field).
11. Select OK.
12. Select Next. Now we have the same reports on offer that we had in Figure 19.9.
13. Accept the default (Stepped) with Next.
14. Change the name of the report to Company Report 2.
15. Click Finish to preview the report.
This will give you almost (% is missing) the same report as shown in Figure 19.11.
The next steps show how to add fields from the CompanyAddresses list/table so that they occur once per company in a sensible place in the report.
Here are the steps we need to create the report we want:
1. Click View > Design View (see Figure 20.9).
FIGURE 20.9 Design View of the initial Company Address Report
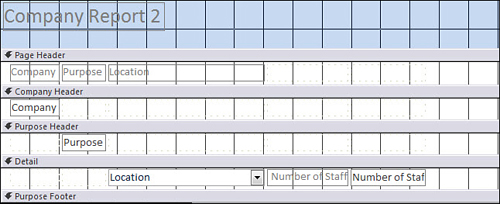
2. Expand the area available for the CompanyStaffNumbers_Company section by selecting the Purpose Header line and moving the cursor toward the top of it until you see an icon with a thick downward arrow; a thin upward arrow joined to it; and a horizontal line between the two arrows. When you have this, drag that section downward. This gives more space for the section above it.
3. Now go to the ribbon and click Add Existing Fields toward the right of the ribbon.
This opens a List of all fields in both tables that were used when creating this report (see Figure 20.10).
FIGURE 20.10 The field list directly after the report has been created
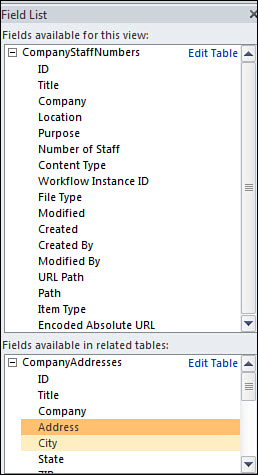
The upper section of the Field List contains the fields in the list/table that we used to create the report. The fields in the second list/table that we did not use in the report are for the moment contained in the lower section (Fields Available in Related Tables).
4. Open if necessary the lower (CompanyAddresses) section and double-click Address.
A dual set of Address (label) and Address (field) appear in that order somewhere in the design—probably offscreen in the Detail section that will have been increased in size, so you will have to scroll down. This is not where we want the address to be of course.
5. Click somewhere in empty space.
This removes the selection of both the label and the field.
6. Click the left Address (the label) to select it and click Delete.
7. Click the right Address (the field) to select it and then press Ctrl-X.
8. Click the Company field in the Company Header section.
9. Click Ctrl-V.
Now repeat the preceding steps 4 to 9 for (in turn) the City, State, Zip, Country, and Web Page fields with one important difference: At step 8, always select the field you previously added.
10. Move the Purpose Footer upward so the Detail Section is of normal height (see Figure 20.11).
FIGURE 20.11 The (almost) final Company Header section in Design view

11. Before we have a look at this in Report View, it’s clear that we don’t want to have column headers at the top of each page saying Company, Purpose, and Location, so delete those three items in the Page Header section.
12. Although you are amending the Page Header section, try to find the Page Number function in the ribbon and specify that the page number should appear at the top of the page on the left and be centered in its field.
13. Click View > Report View (see Figure 20.12).
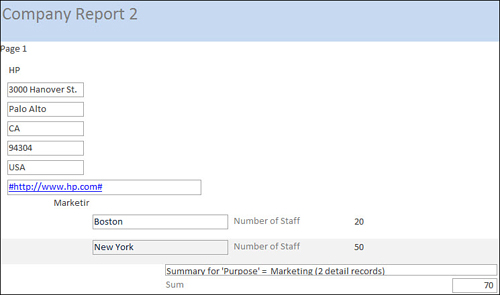
This almost final report is now at the stage the report in Hour 19 was before we did the final changes to it. By following the Tip after step 10 of the Report Wizard phase, we avoided the need to remove the percentage line, but we still need to widen the Purpose field, so we get Marketing and make the Company Name Bold and Underlined. To do that, though, you can follow Hour 19—making sure your report design is saved at the end. (If you can’t find how to do so, close Access. If the report design hasn’t been saved, you will be asked if you want to save it.)
Here we finish with a look at creating a report from two lists/tables without the aid of the Report Wizard.
FIGURE 20.12 An almost final report
Creating a Two Lists/Tables Report Manually Using Design View
The alternative to using first the Report Wizard and then making manual changes to what that generates is to start with an empty report design sheet and add fields from the two lists to it. In the present rather simple case, this is probably a more time-consuming method than the early “wizard + amendment” method, but you need to know how to use this method anyway for cases where the initial use of the Report Wizard is more hindrance than help, so here is how to do a total report design from scratch for that same simple case.
Most of the techniques used in this section were already covered in the previous section, so we can start right away with the steps needed to create a report called Company Report 3 from the Design view:
1. Create (menu line) and Report Design (ribbon).
This gives an empty Design View with a Page Header section, Detail section, and Page Footer section. First we need to create a Company Header section.
2. Click the Ribbon on Add Existing Fields that opens the Field List.
3. Click the + next to CompanyStaffNumbers in the Field List section.
4. Double-click Company. The Company label (left) and the Company field (right) appear in the Detail section.
5. Delete the Company label only.
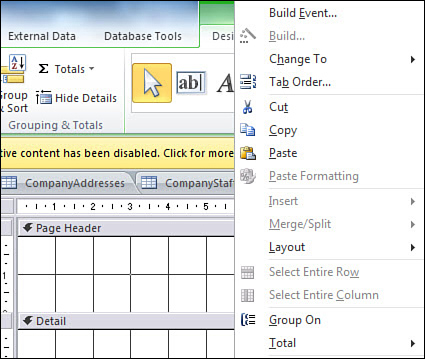
6. Select the Company field and right-click (see Figure 20.13).
7. Click Group On.
FIGURE 20.13 Specifying Grouping for a field
Seemingly nothing happens, but if you look again at the Design View (and upward), you’ll see that a new section has been created called Company Header.
8. Drag the Company field to a suitable location (top left) in the Company Header section.
Now that the Company Field is there, the next steps are to add the fields Address, City, State, Zip, Country, and Web Page from the CompanyAddresses part of Field List using the same method that was used previously. I start a new set of steps for this (condensed because we’ve seen them before):
1. Expand CompanyAddreses in Field List.
2. Double-click Address.
3. Delete the left Address (label) in the Details part of Design view.
4. Click the Address field to select it and then Ctrl-X.
5. Click the Company field in the Company Header section.
6. Click Ctrl-V.
Repeat for City, State, Zip, Country, and Web Page, not forgetting as before to always select in step 5 the field that was previously added to the Company Header section.
The following steps group on Purpose and create a couple of calculation fields in the Purpose section. Again, as the initial steps are repeats of what has been done before, they are compressed:
1. Double-click Purpose.
2. Delete the Purpose label.
3. Select the Purpose field and right-click it.
4. Click Group On.
Again, a Header section is created, this time for Purpose. This section as added later is below the Company Header section:
1. Move the Purpose field to within the Purpose section. This time align it to the right of the names in the section above it.
2. After moving it, widen the field by dragging on the right edge of the Purpose box to widen the box.
3. Drag up the Detail Header so that the Purpose section takes as little space as possible.
We’ve done quite a bit of work, yet we still have only a report that looks like Figure 20.14.
FIGURE 20.14 An interim hand-made report
This might be a good time to have a look at what the report we created in the previous section looked like. Having done that, we see that we are missing three rows in the Details section:
![]() Location + Number of Staff (normal fields)
Location + Number of Staff (normal fields)
![]() Location (count of)
Location (count of)
![]() Number of Staff (sum of)
Number of Staff (sum of)
Here we can ignore the count of location and just do the first and the last item in that list and then do another review:
1. Use the usual (by now) technique to get the Location field into the Details section and move it to the top of the section positioned to the right of the end of the Purpose field in the section above.
2. Use the usual (by now) technique to get to get the Number of Staff field into the details section, but do not delete the label; move both the label and the field to the top of the section positioned to the right of the end of the Location field that was just added.
3. Reduce the size of the Details section so that it has space for just this one line.
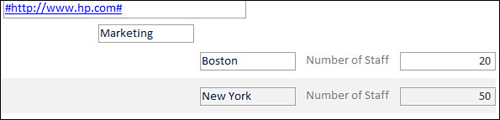
The report now looks like (in extract) Figure 20.15.
FIGURE 20.15 The Details line is now okay
The final part of the report we cover in the book is the addition of the line giving the totals for Marketing (and all the other Purpose sections) of the number of staff. These go in the Purpose Footer section and will normally consist not only of a total, but also some text including the name of the Purpose. So Total for Marketing = 70 for instance.
Here’s one way to do this:
1. Use the usual technique and add the Any field to Details.
2. Move the field to the Purpose Footer section and right-click (see Figure 20.13).
3. Click Build Events at the top of the pop-up menu.
4. Select Expression Builder from the new pop-up.
Now to build up Total for Marketing = 70, you need to specify four different parts of this expression:
a. A text string Total For
b. The contents of a field (Purpose)
c. A text string =
d. A sum
In the Expression Builder between each of these parts, you need an ampersand (&):
a. Uses Functions/Built-in Functions (and String)
b. Uses BookDatabase19/Tables/CompanyStaffNumbers (and Purpose)
c. Uses Functions/Built-in Functions (and String)
d. Uses Functions/Built-in Functions (and Sum)
Note that the & is obtained from “Operators” and scrolling down to select “&.”
This logically results in what’s seen in Figure 20.16, which however might be rejected by the Expression Builder format checker.
FIGURE 20.16 A seemingly good expression
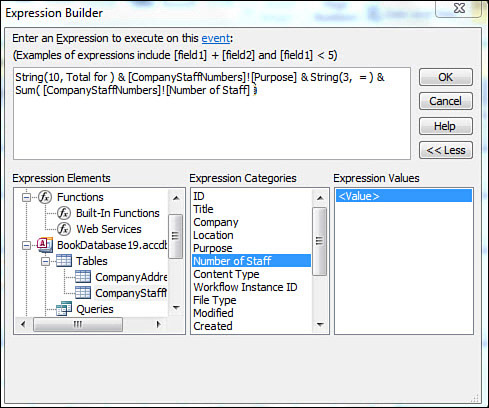
This is one of the problems of the manual approach. The Expression checker routine is strict. It rejects as incorrect just about everything. It even (!) rejects some of the expressions (that work!) generated by the Report Wizard. Rather than writing a new hour about creating expressions accepted by the Expression checker routine, let us solve our problem in the simplest possible way by following these steps:
1. Click Number of Staff (field) in the Details line.
2. Right-click and select Sum.
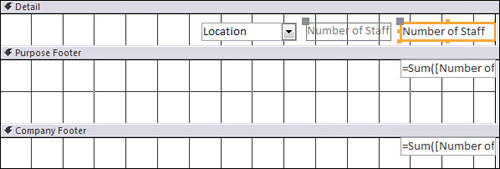
As if by magic, this creates Sum fields just where we want them in the Purpose Footer and in the Company Footer (see Figure 20.17).
I’ll leave you to tidy up the report by reducing the size of some of areas of the report. (And note that there isn’t such a nice report heading as there was for the generated report—there is no report heading yet.)
The final section gives a few thoughts as to which approach is the most suitable.
FIGURE 20.17 Sum of Number of Staff just where we want it
Short Comparison of the Two Methods for Report Creation from Two or More Lists/Tables
1. It is possible to create a report from scratch. You have full control, and provided you can learn to love the odd little ways of the Expression Builder checker (or how to use the alternative Macro Builder or Code Builder), you can do virtually what you want with fields from more than one list/table.
2. It is much faster in many circumstances to use the Report Wizard to create a basis report (using fields from only one list/table) and then to add fields from another (or from several) list/table to it.
3. It is also useful to quickly create a few sample reports using the Report Builder and then use them only as a model for the kind of report you want to build using only manual techniques.
Workshop
Q. What happens if I create a link between a SharePoint List and Access 2010 using a TCP/IP address and then the TCP/IP address changes?
A. The problem with such a change is that the TCP/IP address is built in to the Access table so that it knows where the SharePoint List is located that it needs to link to. In a situation where the TCP/IP address has changed, the link naturally doesn’t work, so you need to change the link.
You do this using the same method that you would use if you had for instance moved the list to a completely different SharePoint system. Here are the steps to solve this (this does not need to be repeated for each table in the same database connected to the old TCP/IP address or server), all of which occur in Access 2010:
2. Right-click.
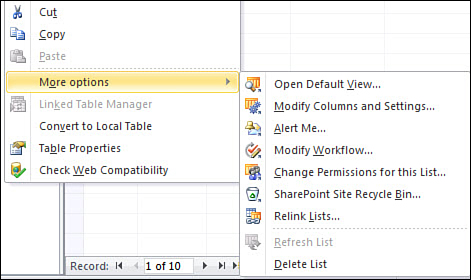
3. Select More Options (see Figure 20.18).
FIGURE 20.18 Preparing to relink a table to a List
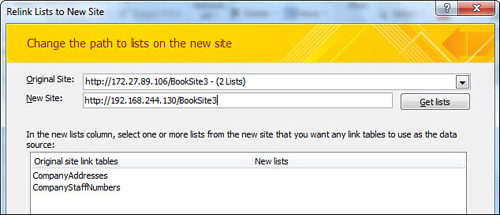
4. Click Relink lists (see Figure 20.19).
FIGURE 20.19 Relinking Lists to a new site
5. Click Get lists (see Figure 20.20).
FIGURE 20.20 New Lists are specified
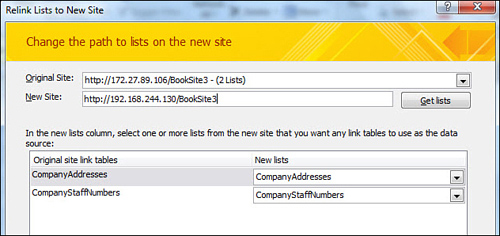
6. Click OK.
This takes us back to the standard Access Page for this database; only now the both the links are operational.
Quiz
1. Can you use the Report Wizard to produce a report that uses the fields of two or more lists?
2. When using the Report Wizard to produce an interim report that we will build on, does it matter which single list we use for the fields used in that interim report?
Answers
1. You can produce a report using Report Wizard that uses fields from two or more lists, but the chances are the report will not be of much use to you because fields from the second list will probably be used in the wrong way.
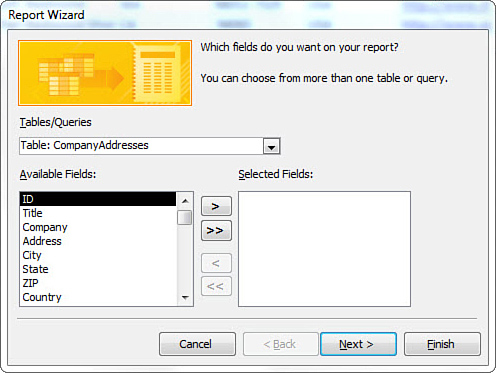
2. It depends on the lists. In this case the method we chose was the only correct one. For bonus points, you can see what would happen if a report were created using the Company Addresses list/table. It won’t be as helpful as a basis for a full report as the interim report we created using the CompanyStaffNumbers list/table.