
10.4.3 Evaluation of the Rate Law Parameters
In the original work on this reaction by Papp et al.,17 over 25 models were tested against experimental data, and it was concluded that the preceding mechanism and rate-limiting step (i.e., the surface reaction between adsorbed toluene and H2 gas) is the correct one. Assuming that the reaction is essentially irreversible, the rate law for the reaction on clinoptilolite is
![]()
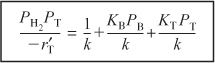
We now wish to determine how best to analyze the data to evaluate the rate law parameters, k, KT, and KB. This analysis is referred to as parameter estimation.18 We now rearrange our rate law to obtain a linear relationship between our measured variables. For the rate law given by Equation (10-80), we see that if both sides of Equation (10-80) are divided by PH2PT and the equation is then inverted,
The regression techniques described in Chapter 7 could be used to determine the rate law parameters by using the equation
Yj = a0 + a1X1j + a2X2j
A linear-least-squares analysis of the data shown in Table 10-6 is presented on the DVD-ROM.
One can use the linearized least-squares analysis (PRS 7.3) to obtain initial estimates of the parameters k, KT, KB, in order to obtain convergence in nonlinear regression. However, in many cases it is possible to use a nonlinear regression analysis directly, as described in Sections 7.5 and 7.6, and in Example 10-1.
Example 10-1. Non-linear Regression Analysis to Determine the Model Parameters k, KB, and KT
a. Use non-linear regression, as discussed in Chapter 7, along with the data in Table 10-6, to find the best estimates of the rate law parameters k, KB, and KT in Equation (10-80).
b. Write the rate law solely as a function of the partial pressures.
c. Find the ratio of the sites occupied by toluene, CT•S, to those occupied by benzene, CB•S, at 40% conversion of toluene.
The data from Table 10-6 were entered into the Polymath nonlinear-least-squares program with the following modification. The rates of reaction in column 1 were multiplied by 1010, so that each of the numbers in column 1 was entered directly (i.e., 71.0, 71.3, ...). The model equation was
![]()

Following the step-by-step regression procedure in Chapter 7 and on the DVD-ROM Summary Notes, we arrive at the following parameter values shown in Table E10-1.1.
Table E10-1.1. Parameter Values
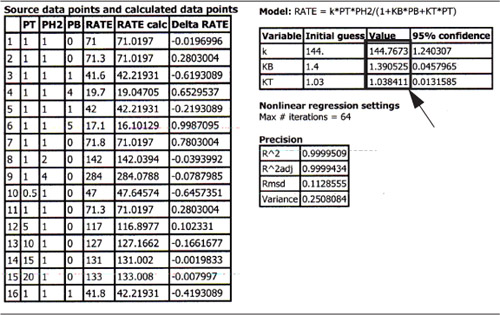
a. The best estimates are shown in the upper right hand box of Table E10-1.1.
b. Converting the rate law to kilograms of catalyst and minutes,
E10-1.2
![]()
we have
E10-1.3

c. After we have the adsorption constants, KT and KB, we can calculate the ratio of sites occupied by the various adsorbed species. For example, taking the ratio of Equation (10-75) to (10-76), the ratio of toluene-occupied sites to benzene-occupied sites at 40% conversion is

We see that at 40% conversion there are approximately 12% more sites occupied by toluene than by benzene.
Analysis: This example shows once again how to determine the values of rate law parameters from experimental data using Polymath regression. It also shows how to calculate the different fraction of sites, both vacant and occupied, as a function of conversion.