
13.4.1 Startup
In reactor startup, it is often very important how temperature and concentrations approach their steady-state values. For example, a significant overshoot in temperature may cause a reactant or product to degrade, or the overshoot may be unacceptable for safe operation such as a secondary reaction runaway. If either case were to occur, we would say that the system exceeded its practical stability limit. The practical limit is specific to the specific reaction and conditions under which the reaction is carried out and is usually determined by the reaction safety engineer. Although we can solve the unsteady temperature–time and concentration–time equations numerically to see if such a limit is exceeded, it is often more insightful to study the approach to steady state by using the temperature–concentration phase plane. To illustrate these concepts, we shall confine our analysis to a liquid-phase reaction carried out in a CSTR.
A qualitative discussion of how a CSTR approaches steady state is given in PRS R13.4. This analysis, summarized in Figure S-1 in the Summary for this chapter, is developed to show the four different regions into which the phase plane is divided and how they allow one to sketch the approach to the steady state.

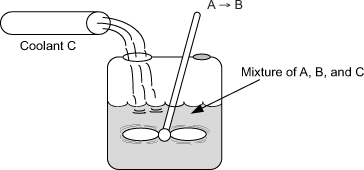
Example 13-4. Startup of a CSTR
Again we consider the production of propylene glycol (C) in a CSTR with a heat exchanger in Example 12-3. Initially there is only water, Cwi = 3.45 lb-mol/ft3, at Ti = 75°F and 0.1 wt % H2SO4 in the 500-gallon reactor. The feed stream consists of 80 lb-mol/h of propylene oxide (A), 1000 lb-mol/h of water (B) containing 0.1 wt % H2SO4, and 100 lb-mol/h of methanol (M).
Plot the temperature and concentration of propylene oxide as a function of time, and a concentration vs. temperature graph for different entering temperatures and initial concentrations of A in the reactor.
The water coolant flows through the heat exchanger at a rate of 5 lbm/s (1000 lb-mol/h). The molar densities of pure propylene oxide (A), water (B), and methanol (M) are ρA0 = 0.923 lb-mol/ft3, ρB0 = 3.45 lb-mol/ft3, and ρM0 = 1.54 lb-mol/ft3, respectively.
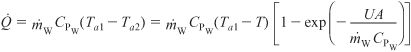
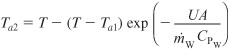
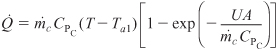
![]() with Ta1 = 60°F,
with Ta1 = 60°F, ![]() with CPW = 18 Btu/lb-mol · °F
with CPW = 18 Btu/lb-mol · °F
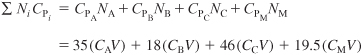
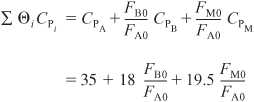
CPA = 35 Btu/lb-mol · °F, CPB = 18 Btu/lb-mol · °F,
CPC = 46 Btu/lb-mol · °F, CPM = 19.5 Btu/lb-mol · °F
Again, the temperature of the mixed reactant streams entering the CSTR is T0 = 75°F.

![]()
Mole Balances:
Initial Conditions
![]()
![]()
![]()
![]()

Rate Law:
![]()
Stoichiometry:
![]()
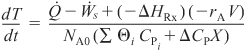
Energy Balance:
![]()
Recalling Equations (12-17) through (12-19), we have
and
Evaluation of parameters:

Neglecting ΔCP because it changes the heat of reaction insignificantly over the temperature range of the reaction, the heat of reaction is assumed constant at its reference temperature.
![]()
The Polymath program is shown in Table E13-4.1.
Table E13-4.1. Polymath Program for CSTR Startup


Figure E13-4.1. Propylene oxide concentration as a function of time.

Figure E13-4.2. Temperature–time trajectory for CSTR startup.

Figures (E13-4.1) and (E13-4.2) show the concentration of propylene oxide and reactor temperature as a function of time, respectively, for an initial temperature of Ti = 75°F and only water in the tank (i.e., CAi = 0). One observes that both the temperature and concentration oscillate around their steady-state values (T = 138°F, CA = 0.039 lb-mol/ft3) as steady state is approached.
Figure (E13-4.3) combines Figures (E13-4.1) and (E13-4.2) into a phase plot of CA versus T. The final operating concentration of A is 0.0379 lb-mol/ft3 at a temperature of 138°F. The arrows on the phase plane plots show the trajectories with increasing time. The maximum temperature reached during startup is 152°F, which is below the practical stability limit of 180°F.
Figure E13-4.3. Concentration–temperature phase-plane trajectory using Figures E13-4.1 and E13-4.2.
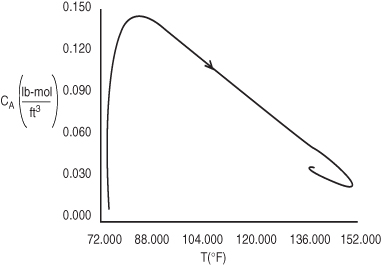
Figure E13-4.4. Concentration–temperature phase-plane for three different initial conditions.
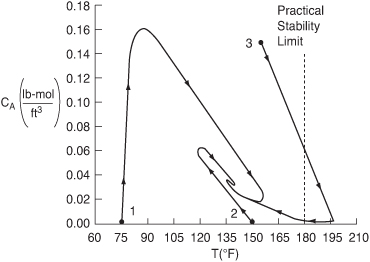
Next, consider Figure (E13-4.4), which shows three different trajectories for three different sets of initial conditions:

After three hours, the reaction is operating at steady state and all three trajectories converge on the final steady-state temperature of 138°F and the corresponding concentrations

For this reaction system, the plant safety office believes that an upper temperature limit of 180°F should not be exceeded in the tank. This temperature is the practical stability limit. The practical stability limit represents a temperature above which it is undesirable to operate because of unwanted side reactions, safety considerations, secondary runaway reactions, or damage to equipment. Consequently, we see that if we started at an initial temperature of Ti = 160°F and an initial concentration of 0.14 mol/dm3, the practical stability limit of 180°F would be exceeded as the reactor approached its steady-state temperature of 138°F. See the concentration–temperature trajectory in Figure E13-4.4.
Figures E13-4.1 through E13-4.4 show the concentration and temperature time trajectories for the start up of a CSTR for different initial conditions.
Analysis: One of the purposes of this example was to demonstrate the use of phase plots, e.g., T versus CA, in analyzing CSTR start-up. Phase plots allow us to see how the steady state is approached for different sets of initial conditions and if the practical stability limit is exceeded causing a secondary, more exothermic reaction to set in.
13.5 Nonisothermal Multiple Reactions
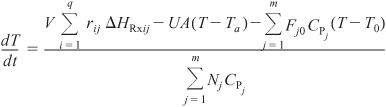
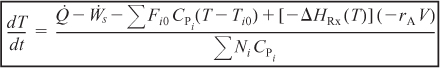
For q multiple reactions with m species occurring in either a semibatch or batch reactor, Equation (13-15) can be generalized in the same manner as the steady-state energy balance, to give

For large coolant flow rates, Equation (13-17) becomes
Rearranging Equation (13-18)
Letting

and
Qr = UA(T – Ta) + ΣFj0CPj(T – T0)
we can write Equation (13-18) in the form

Example 13-5. Multiple Reactions in a Semibatch Reactor
![]()
are catalyzed by H2SO4. All reactions are first order in the reactant concentration. However Reaction (1) is exothermic and Reaction (2) is endothermic. The reaction is to be carried out in a semibatch reactor that has a heat exchanger inside with UA = 35,000 cal/h · K and a constant exchanger temperature, Ta, of 298 K. Pure A enters at a concentration of 4 mol/dm3, a volumetric flow rate of 240 dm3/h, and a temperature of 305 K. Initially there is a total of 100 dm3 in the reactor, which contains 1.0 mol/dm3 of A and 1.0 mol/dm3 of the catalyst H2SO4. The reaction rate is independent of the catalyst concentration. The initial temperature inside the reactor is 290 K.
Plot and analyze the species concentrations and reactor temperature as a function of time.

Additional information:
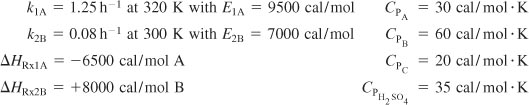
![]()
![]()
![]()
![]()
![]()
Rates:
Rate Laws:
![]()
![]()
Relative Rates:
![]()
![]()
Net Rates:
![]()
![]()
![]()
Stoichiometry (liquid phase): Use CA, CB, CC
![]()
![]()
Energy Balance:
Semibatch Reactor:
Expanding
Substituting the parameter values into equation (E13-5.14)
![]()
Equations (E13-5.1) through (E13-5.3) and (E13-5.8) through (E13-5.12) can be solved simultaneously with Equation (E13-5.14) using an ODE solver. The Polymath program is shown in Table E13-5.1. The concentration–time and temperature-time trajectories are shown in Figures E13-5.1 and E13-5.2.
Table E13-5.1. Polymath Program

Figure E13-5.1. Concentration–time.
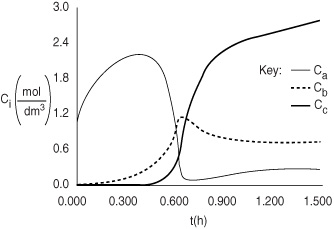
Figure E13-5.2. Temperature (K)–time (h).

Analysis: At the start of the reaction both CA and T in the reactor increase because CA0 and T0 are greater than CAi and Ti. This increase continues until the rate of consumption of the reacting species is greater than the feed rate to the reactor. We note that at about 0.2 h, the reactor temperature exceeds the feed temperature (i.e., 305°F) as a result of the heat generated by the exothermic reaction (1). The temperature continues to rise until about 0.6 h, at which point reactant A is virtually all consumed. After this point the temperature begins to drop for two reasons: (1) the reactor is cooled by the heat exchanger and (2) heat is drawn by the exothermic reaction rate.
Example 13-6. T2 Laboratories Explosion4
Figure E13-6.1. Aerial photograph of T2 taken December 20, 2007.
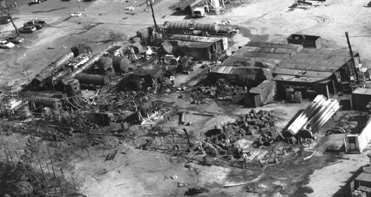
(Courtesy of Chemical Safety Board.)
T2 Laboratories manufactured a fuel additive, methylcyclopentadienyl manganese tricarbonyl (MCMT), in a 2,450-gallon, high-pressure batch reactor utilizing a three-step batch process.
Step 1a. The liquid-phase metalation reaction between methylcyclopentadiene (MCP) and sodium in a solvent of diethylene glycol dimethyl ether (diglyme) to produce sodium methylcyclopentadiene and hydrogen gas:
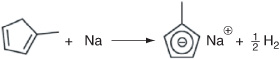
Hydrogen immediately comes out of the solution and is vented at the top in the gas head space.
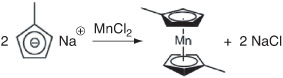
Step 1b. At the end of Step 1a, MnCl2 is added. The substitution reaction between sodium methylcyclopentadiene and manganese chloride produced manganese dimethylcyclopentadiene and sodium chloride:
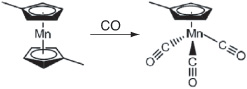
Step 1c. At the end of Step 1b, CO is added. The carbonylation reaction between manganese dimethylcyclopentadiene and carbon monoxide produced the final product, methylcyclopentadienyl manganese tricarbonyl (MCMT):
We will only consider Step 1a as this step is the one in which the explosion occurred.
Procedure
First, solid sodium is mixed in the batch reactor with methylcyclopentadiene dimer and a solvent diethylene glycol dimethyl ether (diglyme). The batch reactor is then heated to about 422 K (300°F) with only slight reaction occurring during this heating process. On reaching 422 K the heating is turned off, as the exothermic reaction is now proceeding, and the temperature continues to increase without further heating. When the temperature reaches 455.4 K (360°F), the operator initiates cooling using the evaporation of boiling water in the reactor jacket as the heat sink (Ta = 373.15 K) (212°F).
What Happened
On December 19, 2007, when the reactor reached a temperature of 455.4 K (360°F), the process operator could not initiate the flow of cooling water to the cooling jacket shown in Figure E13-6.2. Thus, the expected cooling of the reactor was not available and the temperature in the reactor continued to rise. The pressure also increased as hydrogen continued to be produced at an increased rate, to the point that the reactor pressure control valve system on the 1-inch diameter hydrogen venting stream could no longer maintain the operating pressure at 50 psig (4.4 atm). As the temperature continued to increase further, a previously unknown exothermic reaction of the diglyme solvent that was catalyzed by sodium accelerated rapidly.
![]()

This reaction produced even more hydrogen, causing the pressure to rise even faster, eventually causing the ruptured disk to break, which was set at 28.2 atm absolute (400 psig), in the 4-inch diameter relief line of H2. Even with the relief line open, the rate of production of H2 was now for greater than the rate of venting, causing the pressure to continue to increase to the point that it ruptured the reactor vessel initiating a horrific explosion. The T2 plant was completely leveled and four personnel lives were lost. Surrounding businesses were heavily damaged and additional injuries were sustained.
Before continuing with this example it might be helpful to view the 9 minute Chemical Safety Board (CSB) video, which you can access directly from the Chapter 13 Summary Notes on the Web site, or you can read the supporting reports [http://www.chemsafety.gov/videoroom/detail.aspx?VID=32]. You can also search the Web for “T2 explosion video.”
Simplified Model
Let A = methycylcopentadiene, B = sodium, S = Solvent (diglyme), and D = H2. This runaway reaction can be approximately modeled with two reactions. These reactions are
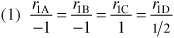
(1) A + B → C + 1/2 D (gas)
(2) S → 3 D (gas) + miscellaneous liquid and solid products
In reaction (1), A and B react to form products. Reaction (2) represents the decomposition of the liquid-phase solvent S catalyzed by the presence of B, but this reaction only begins to proceed once a temperature of approximately 470 K is reached.
The rate laws, along with the specific reaction rate constants at the initial temperature of 422 K, are:
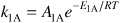
–r1A = k1ACACB
A1A = 5.73 × 10² dm3 mol–1 hr–1 with E1A = 128,000 J/mol K
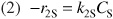
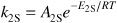
–r2S = k2S*CS
A2S = 9.41 × 10¹⁶ hr–1 with E2S = 800,000 J/mol K
The heats of reaction are constant.
ΔHRx1A = 45,400 J/mol
ΔHRx2S = 3.2 × 10⁵ J/mol
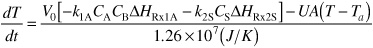
The sum of products of the moles of each species and their corresponding heat capacities (cf. Equation 13-18) is essentially constant at
ΣNjCPj = 1.26 × 10⁷ J/K
Assumptions
Assume that the liquid volume, V0, in the reactor remains constant at 4,000 dm3 and that the vapor space, VH, above the reactor occupies 5,000 dm3. Any gas, H2 (i.e., D), that is formed by reactions (1) and (2) immediately appears as an input stream FD to the head space volume. The dissolved H2 and the vapor pressures for the liquid components in the reactor can be neglected. The initial absolute pressure within the reactor is 4.4 atm (50 psig). During normal operation, H2 generated obeys the ideal gas law. The pressure control system on the H2 vent stream maintains the pressure, P, at 4.40 atm up to a flow of 11,400 mol/hr. The reactor vessel will fail when the pressure exceeds 45 atm or the temperature exceeds 600 K.
Additional Information
UA = 2.77 × 10⁶ J hr–1 K–1. The concentrations in the reactor at the end of the reactor heating at 422 K are CA0 = 4.3 mol/dm3, CB0 = 5.1 mol/dm3, CI0 = 0.088, and CS0 = 3 mol/dm3. The sensible heat of the two gas venting streams may be neglected.
Plot and analyze the reactor temperature and head space pressure as a function of time along with the reactant concentrations for the scenario where the reactor cooling fails to work (UA = 0). In Problem P13-2(f) you will be asked to redo the problem when the cooling water comes as expected whenever the reactor temperature exceeds 455 K.
- Reactor Mole Balances
Reactor (Assume Constant Volume Batch)
Liquid


- Head Space Mole Balance
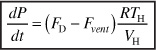
Let ND = moles of gas D in the reactor vapor space VV. A balance on species D (H2) in the head space volume VV yields

where Fvent is the molar flow rate of gas out of the head space through one or both outlet lines and FD is the molar rate of gas leaving the liquid and entering the head space

The assumptions of a perfect gas in the head space volume and modest changes in T allow Equation (E13-6.4) to be written in terms of total gas pressure in the reactor head space.

Substituting for ND in Equation (E13-6.3) and rearranging
Gas exits the reactor in both the pressure control valve line and in the rupture disk line. At low gas production, the pressure control valve maintains set point pressure at the initial pressure by venting all produced gas until the rate of gas production reaches 11,400 mol/hr.

As the pressure increases but is still below the rupture disk setting, the pressure control line then vents to the atmosphere (1 atm) according to the equation

where P is the absolute pressure in the reactor (atm), 1 atm is the downstream pressure as and Cv is 3,360 mol/hr·atm. If the pressure P within the reactor exceeds 28.2 atm (400 psig), the relief line activated by the rupture disk breaks and vents gas in the reactor at the rate given (P-1) Cv2 where Cv2 = 53,600 mol/atm·hr.
After the rupture disk blowout at P = 28.2 atm, both the pressure control line and the rupture disk lines vent the reactor according to the equation

Equations (E13-6.7) through (E13-6.10) can then be used to describe the Fvent flow rate with time for the appropriate logic for the values of FD and P.
- Rates
Laws:

Relative Rates:

Net Rates:


- Stoichiometry:
Neglect reactor-liquid volume change form loss of product gases.


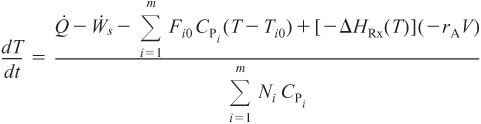
- Energy Balance:
Applying Equation (E13-18) to a batch system (Fi0 = 0)
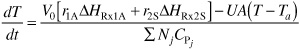
Substituting for the rate laws and ΣNjCPj
- Numerical Solutions—“Tricks of the Trade”
A rapid change of temperature and pressure is expected as reaction (2) starts to run away. This typically results in a stiff system of ordinary differential equations, which can become numerically unstable and generates incorrect results. This instability can be prevented by using a software switch that will set all derivates to zero when the reactor reaches the explosion temperature or pressure. This switch can have the form of Equation (E13-6.26) in Polymath and can be multiplied by the right-hand side of all the differential equations in this problem. This will halt (or freeze) the dynamics when the T become higher than 600 K or the pressure exceeds 45 atm.

We now will solve the essential equations from (E13-6.1) through (E13-6.26) for the scenario where there is no cooling and thus UA = 0. Also the switch SW1 must be implemented in all the differential equations as discussed above.
Table E13-6.1. Polymath Program
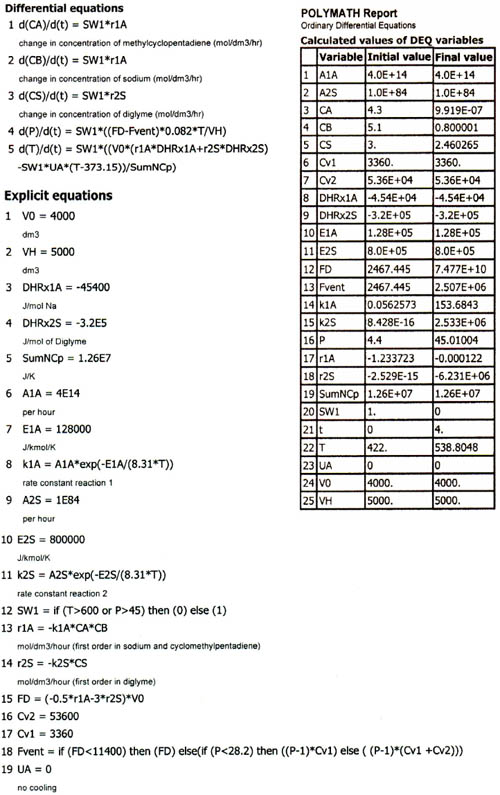
Figure E13-6.3(a). Temperature (K) versus time (h) trajectory.
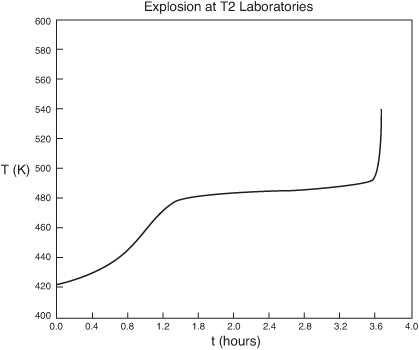
Figure E13-6.3(b). Pressure (atm) versus time (h) trajectory.

Figure E13-6.3(c). Concentration (mol/dm3) versus time (h) trajectory.
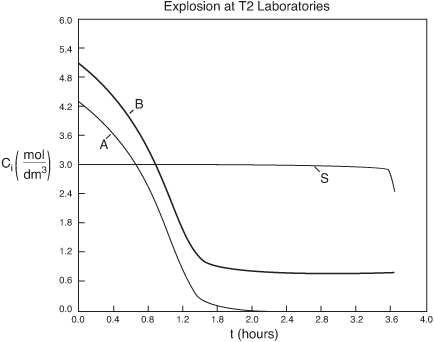
We note from Figures E13-6.3 that the explosion occurred at approximately 3.6 h after startup and the concentration of diglyme begins to drop sharply before that point. We also note that numerical instabilities at about the point of the arrows in these figures because of the rapid increase in temperature.
Analysis: Runaway would not have occurred if (1) the cooling system had not failed, causing the reactor temperature to rise and initiate a second a reaction, and (2) the solvent dygline had not decomposed at the higher to produce hydrogen gas (D). The rate of production of H2 gas was greater than the removal of H2 from the head space causing the pressure to build up to the point it ruptured the reactor vessel.
for batch
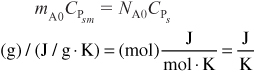
and for flow

However, we note that the units of the product of mass flow rate and mass heat capacities would still be the same as the product of molar flow and molar heat capacities, (e.g., cal/s · K), respectively.
Summary
- Unsteady operation of CSTRs and semibatch reactors
For large heat-exchanger coolant flow rates (Ta1 = Ta2)

For moderate to low coolant flow rates
- Batch reactors
a. Nonadiabatic
S13-4
Where
 is given by either Equation (S13-2) or (S13-3).
b. Adiabatic
S13-5
S13-6

- Semibatch reactors and startup of CSTR
- Multiple reactions (q reactions and m species)
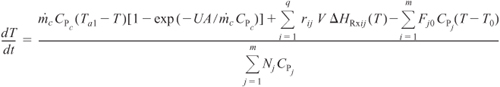
where i = reaction number and j = species.
Dvd-Rom Material
- Summary Notes

- Web links: SAChE Safety Web site www.sache.org. You will need to get the user name and password from your department chair. The kinetics (i.e., CRE) text, examples, and problems are marked K in the product sections: Safety, Health, and the Environment (S,H, & E).

- Solved Problems
Example CD13-1 Use of the ARSST
Example CD13-2 Startup of a CSTR
Example CD13-3 Falling Off the Steady State
Example CD13-4 Proportional-Integral (PI) Control

• Living Example Problems
- Example 13-1 Adiabatic Batch Reactor
- Example 13-2 Safety in Chemical Plants with Exothermic Runaway Reactions
- Example 13-3 Heat Effects in a Semibatch Reactor
- Example 13-4 Startup of a CSTR
- Example 13-5 Multiple Reactions in a Semibatch Reactor
- Example 13-6 Explosion at T2 Laboratories
- PRS Example CD13-1 Falling Off the Upper Steady State
- PRS Example CD13-2 Integral Control of a CSTR
- PRS Example CD13-3 Proportion-Integral Control of a CSTR
- Example R13-4 Linear Stability
- Example R13-1 Use of ARSST
• Professional Reference Shelf
R13.1. The Complete ARSST
In this section further details are given to size safety valves to prevent runaway reactions.
Figure R13.1. Temperature-time trajectory for hydrolysis of acetic anhydride.

R13.2. Falling Off the Upper Steady State
R13.3. Control of a CSTR
In this section we discuss the use of proportional (P) and integral (I) control of a CSTR. Examples include I and PI control of an exothermic reaction.

Reactor with coolant flow rate control system.
Proportional integral action
![]()
R13.4.
Linearized Stability Theory (PDF)
R13.5.
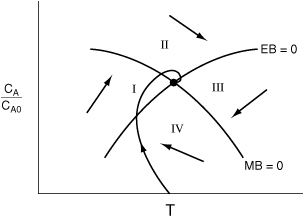
Approach to Steady-State Phase-Plane Plots and Trajectories of Concentration versus Temperature
Startup of a CSTR (Figure R13.5) and the approach to the steady state (DVD-ROM). By mapping out regions of the concentration–temperature phase plane, one can view the approach to steady state and learn if the practical stability limit is exceeded. The steady state trajectories are shown for the mole balance (MB = 0) and energy balance (EB = 0).
Figure R13.5. Startup of a CSTR.
R13.6.
Adiabatic Operation of a Batch Reactor
R13.7.
Unsteady Operation of Plug Flow Reactor
Questions and Problems
Prepare a list of safety considerations for designing and operating chemical reactors. See the August 1985 issue of Chemical Engineering Progress.
Review the example problems in this chapter and use a software package such as Polymath or MATLAB to carry out a parameter sensitivity analysis to answer the following “What if...” questions.

What if...
a. Example 13-1. (1) How would your answer change if the heat of the mixing had been neglected? (2) How much time would it take to achieve 90% conversion if the reaction were started on a very cold day where the initial temperature was 20°F? (Methanol won’t freeze at this temperature.) (3) Now, consider that a heat exchanger is added such that for propylene oxide CA0 = 1 lb-mol/ft3, V = 1.2 ft3 (then neglecting ΔCP, ΣNiCPi = 403 Btu/°R), UA = 0.22 Btu/°R/s, and Ta = 498 K. Plot and analyze the trajectories X, T, Qg, and Qr as a function of time.
b. Example 13-2. Explore the ONCB explosion described in Example 13-2.
- Explain what you would do to prevent an explosion of this type from ever occurring again while still operating at the triple production specified by management.
- Show that no explosion would have occurred if the cooling was not shut off for the 9.04-kmol charge of ONCB or if the cooling was shut off for 10 min after 45 min of operation for the 3.17-kmol ONCB charge.
- Show that if the cooling had been shut off for 10 min after 12 h of operation, no explosion would have occurred for the 9.04-kmol charge.

- Develop a set of guidelines as to when the reaction should be quenched should the cooling fail. Perhaps safe operation could be discussed using a plot of the time after the reaction began at which the cooling failed, t0, versus the length of the cooling failure period, tf, for the different charges of ONCB. Parameter values used in this example predict that the reactor will explode at midnight.
- What parameter values would predict the time the reactor would explode at the actual time of 18 min after midnight? Find a set of parameter values that would cause the explosion to occur at exactly 12:18 A.M. For example, include heat capacities of metal reactor and/or make a new estimate of UA.
- Finally, what if a 1/2-in. rupture disk rated at 800 psi had been installed and did indeed rupture at 800 psi (270°C)? Would the explosion still have occurred? (Note: The mass flow rate
 varies with the cross-sectional area of the disk. Consequently, for the conditions of the reaction, the maximum mass flow rate out of the 1/2-in. disk can be found by comparing it with the mass flow rate of 830 kg/min of the 2-in. disk.
c. Example 13-3. Load the Living Example Problem. (1) At what times will the number of moles of C (NC = CCV) and the concentration of species C reach a maximum? Are they different, if so, why? What would the X versus t and T versus t trajectories look like if the coolant rate is increased by a factor of 10. Why is the reaction time (252s) so short? Should a semibatch reactor be used for this reaction?
d. Example 13-4. Load the Living Example Problem for Startup of a CSTR, for an entering temperature of 70°F, an initial reactor temperature of 160°F, and an initial concentration of propylene oxide of 0.1 M. Try other combinations of T0, Ti, and CAi, and report your results in terms of temperature–time trajectories and temperature–concentration phase planes. Find a set of conditions above which the practical stability limit will be reached or exceeded and those conditions below which it will not.
e. Example 13-5. Load the Living Example Problem. (1) Plot and analyze NA = CAV and NB = CBV for long times (e.g., t = 15h). What do you observe? (2) Can you show that for long times NA ≅ CA0V0/k1A and NB ≅ CA0V0/2/k2B? (3) What do you think is happening to this semibatch reactor if it has no lid and a maximum volume of 1,000 dm3 at long times? (4) If B is the deserved product, how would you maximize NB?
f. Example 13-6. T2 Laboratory Explosion.
- View the Chemical Safety Board (CSB) video online and read the supporting reports (http://www.chemsafety.gov/videoroom/detail.aspx?VID=32). Also search Web for “T2 explosion video.”
- (a) What did you learn from watching the video? (b) Suggest how this reactor system should be modified and/or operated in order to eliminate any possibility of an explosion. (c) Would you use backup cooling and, if so, how? (d) How could you learn if a second reaction could be set in at a higher temperature? [Hint: See PRS R13.1 The Complete ARSST.]
- Load the Living Example Polymath E13-6. Plot CA, CB, CC, P, and t as a function of time. Vary UA between 0.0 and 2.77×10⁶ J/h/K to find the lowest value of UA that you observe a runaway. Describe the trends as you approach runaway. Did it occur over a very narrow range of UA values? [Hint: The problem becomes very stiff near the explosion condition when T > 600 K or P > 45 atm. If the temperature or pressure reaches these values, set all derivatives (concentration changes, temperature change, and pressure change) and reaction rates equal to zero so that the numerical solution will complete the analysis and hold all variables at the explosion point of the reactor.]
- Now let’s consider the actual operation in more detail. The reactor contents are heated from 300 K to 422 K at a rate of = 4 K/minute. At 422 K, the reaction rate is sufficient such that heating is turned off. The reactor temperature continued to rise because the reaction is exothermic, and, when the temperature reached 455 K, the cooling water turned on and cooling was initiated. Model this situation for the case when UA = 2.77×10⁶ J/h/K and when UA = 0.
- What is the maximum time in minutes that the cooling can be lost (UA = 0) starting at the time when the reactor temperature reaches 455 K so that the reactor will not reach the explosion point? The conditions are those of part (1).
- Vary the parameters and operating conditions and describe what you find.
g. PRS R13.2 Example CD13-5. Load the Living Example Problem for Falling Off the Upper Steady State. Try varying the entering temperature, T0, between 80 and 68°F and plot the steady-state conversion as a function of T0. Vary the coolant rate between 10,000 and 400 mol/h. Plot conversion and reactor temperature as a function of coolant rate.
h. PRS R13.3 Example CD13-2. Load the Living Example Problem. Vary the gain, kC, between 0.1 and 500 for the integral controller of the CSTR. Is there a lower value of kC that will cause the reactor to fall to the lower steady state or an upper value to cause it to become unstable? What would happen if T0 were to fall to 65°F or 60°F?

i. PRS R13.3 Example CD13-3. Load the Living Example Problem. Learn the effects of the parameters kC and τI. Which combination of parameter values generates the least and greatest oscillations in temperature? Which values of kC and τI return the reaction to steady state the quickest?
j. SAChE. Go to the SAChE Web site www.sache.org. On the left-hand menu, select “SaChe Products”. Select “All” tab and go to the module entitled: “Safety, Health and the Environment (S, H & E).” The problems are for KINETICS (i.e., CRE). There are some example problems marked K and explanations in each of the above S, H & E selections. Solutions to the problems are in a different section of the site. Specifically look at: Loss of Cooling Water (K-1), Runaway Reactions (HT-1), Design of Relief Values (D-2), Temperature Control and Runaway (K-4) and (K-5), and Runaway and the Critical Temperature Region (K-7). Go through the K problems and write a paragraph on what you have learned. Your instructor or department chair should have the user name and password to enter the SAChE Web site in order to obtain the module with the problems.
The following is an excerpt from The Morning News, Wilmington, Delaware (August 3, 1977): “Investigators sift through the debris from blast in quest for the cause [that destroyed the new nitrous oxide plant]. A company spokesman said it appears more likely that the [fatal] blast was caused by another gas—ammonium nitrate—used to produce nitrous oxide.” An 83% (wt) ammonium nitrate and 17% water solution is fed at 200°F to the CSTR operated at a temperature of about 520°F. Molten ammonium nitrate decomposes directly to produce gaseous nitrous oxide and steam. It is believed that pressure fluctuations were observed in the system and, as a result, the molten ammonium nitrate feed to the reactor may have been shut off approximately 4 min prior to the explosion. Can you explain the cause of the blast? If the feed rate to the reactor just before shutoff was 310 lbm of solution per hour, what was the exact temperature in the reactor just prior to shutdown? Use the data to calculate the exact time it took to explode after the feed was shut off for the reactor. How would you start up or shut down and control such a reaction?
Assume that at the time the feed to the CSTR stopped, there was 500 lbm of ammonium nitrate in the reactor at a temperature of 520°F. The conversion in the reactor is virtually complete at about 99.99%. Additional data for this problem are given in Problem 12-4C. How would your answer change if 100 lbm of solution were in the reactor? 310 lbm? 800 lbm? What if T0 = 100°F? 500°F?
The liquid-phase reaction in Problem P11-3B is to be carried out in a semibatch reactor. There are 500 mol of A initially in the reactor at 25°C. Species B is fed to the reactor at 50°C and a rate of 10 mol/min. The feed to the reactor is stopped after 500 mol of B has been fed.
a. Plot and analyze the temperature Qr, Qg and conversion as a function of time when the reaction is carried out adiabatically. Calculate to t = 2 h.
b. Plot and analyze the conversion as a function of time when a heat exchanger (UA = 100 cal/min · K) is placed in the reactor and the ambient temperature is constant at 50°C. Calculate to t = 3 h.
c. Repeat part (b) for the case where the reverse reaction cannot be neglected.
New parameter values:
k = 0.01 (dm3/mol · min) at 300 K with E = 10 kcal/mol
V0 = 50 dm3, υ0 = 1 dm3/min, CA0 = CB0 = 10 mol/dm3
For the reverse reaction: kr = 0.1 min–1 at 300 K with Er = 16 kcal/mol
You are operating a batch reactor and the reaction is first-order, liquid-phase, and exothermic. An inert coolant is added to the reaction mixture to control the temperature. The temperature is kept constant by varying the flow rate of the coolant (see Figure P13-5B).
Figure . Figure P13-5B Semi-batch reactor with inert coolant stream.
a. Calculate the flow rate of the coolant 2 h after the start of the reaction. [Ans.: FC = 3.157 lb/s.]
b. It is proposed that rather than feeding a coolant to the reactor, a solvent be added that can be easily boiled off, even at moderate temperatures. The solvent has a heat of vaporization of 1000 Btu/lb and initially there are 25 lb-mol of A placed in the tank. The initial volume of solvent and reactant is 300 ft3. Determine the solvent evaporation rate as a function of time. What is the rate at the end of 2 h?
Additional information:
Temperature of reaction: 100°F
Value of k at 100°F: 1.2 × 10⁻⁴ s–1
Temperature of coolant: 80°F
Heat capacity of all components: 0.5 Btu/lb· °F
Density of all components: 50 lb/ft3
![]() : –25,000 Btu/lb-mol
: –25,000 Btu/lb-mol
Initially:
Vessel contains only A (no B or C present)
CA0: 0.5 lb-mol/ft3
Initial volume: 50 ft3
The reaction
![]()
is carried out adiabatically in a constant-volume batch reactor. The rate law is
![]()
Plot and analyze the conversion, temperature, and concentrations of the reacting species as a function of time.
Additional information:
Initial Temperature = 100°C
![]()

The biomass reaction
![]()
is carried out in a 25 dm3 batch chemostat with a heat exchanger.
The initial concentration of cells and substrate are 0.1 and 300 g/dm3, respectively. The temperature dependence of the growth rate follows that given by Aiba et al., Equation (9-61).5
![]()
a. For adiabatic operation and an initial temperature of 278 K, plot T, I′, rg, –rS, CC, and CS as a function of time up to 300 hours. Discuss the trends.
b. Repeat (a) and increase the initial temperature in 10°C increments up to 330 K and describe what you find. Plot the concentration of cells at 24 hours as a function of inlet temperature.
c. What heat exchange area should be added to maximize the total number of cells at the end of 24 hours? For an initial temperature of 310 K and a constant coolant temperature of 290 K, what would be the cell concentration after 24 hours?
Additional information:
YC/S = 0.8 g cell/g substrate
KM = 5.0 g/dm3
μ1max = 0.5 h–1 (note μ = μmax at 310 K and CS → ∞)
CPS = Heat capacity of substrate solution including all cells
CPS = 5 J/g/K
![]() = 100 kg/h
= 100 kg/h
ρ = density of solution including cells = 1000 kg/m3
![]() = –20,000 J/g cells
= –20,000 J/g cells
CPC = Heat capacity of cooling water = 4.2 J/g/K
U = 50,000 J/h/K/m2
The elementary irreversible liquid-phase reaction
![]()
is to be carried out in a semibatch reactor in which B is fed to A. The volume of A in the reactor is 10 dm3, the initial concentration of A in the reactor is 5 mol/dm3, and the initial temperature in the reactor is 27°C. Species B is fed at a temperature of 52°C and a concentration of 4 M. It is desired to obtain at least 80% conversion of A in as short a time as possible, but at the same time the temperature of the reactor must not rise above 130°C. You should try to make approximately 120 mol of C in a 24-hour day, allowing for 30 minutes to empty and fill the reactor between each batch. The coolant flow rate through the reactor is 2000 mol/min. There is a heat exchanger in the reactor.
a. What volumetric feed rate (dm3/min) do you recommend?
b. How would your answer or strategy change if the maximum coolant rate dropped to 200 mol/min? To 20 mol/min?
Additional information:
The reaction in Problem P11-3A is to be carried out in a 10-dm3 batch reactor. Plot and analyze the temperature and the concentrations of A, B, and C as a function of time for the following cases:
a. Adiabatic operation.
b. Values of UA of 10,000, 40,000, and 100,000 J/min · K.
c. Use UA = 40,000 J/min · K and different initial reactor temperatures.
The reactions on the DVD-ROM in Problem CD12GA2 are to be carried out in a semibatch reactor. How would you carry out this reaction (i.e., T0, υ0, Ti)? The molar concentrations of pure A and pure B are 5 and 4 mol/dm3 respectively. Plot and analyze the concentrations, temperatures, and the overall selectivity as a function of time for the conditions you chose.
• Additional Homework Problems
A number of homework problems that can be used for exams or supplementary problems or examples are found on the DVD-ROM and on the CRE Web site, http://www.engin.umich.edu/~cre.
Supplementary Reading
- A number of solved problems for batch and semibatch reactors can be found in
WALAS, S. M., Chemical Reaction Engineering Handbook. Amsterdam: Gordon and Breach, 1995, pp. 386–392, 402, 460–462, and 469.
- Basic control textbook
SEBORG, D. E., T. F. EDGAR, and D. A. MELLICHAMP, Process Dynamics and Control, 2nd ed. New York: Wiley, 2004.
- A nice historical perspective of process control is given in
BUTT, JOHN B., Reaction Kinetics and Reactor Design, Second Edition, Revised and Expanded. New York: Marcel Dekker, Inc., 1999.
CENTER FOR CHEMICAL PROCESS SAFETY (CCPS), Guidelines for Chemical Reactivity Evaluation and Application to Process Design. New York: American Institute of Chemical Engineers (AIChE), 1995.
CROWL, DANIEL A. and JOSEPH F. LOUVAR, Chemical Process Safety: Fundamentals with Applications, 2nd ed. Upper Saddle River, NJ: Prentice Hall, 2001.
EDGAR, T. F., “From the Classical to the Postmodern Era,” Chem. Eng. Educ., 31, 12 (1997).
KLETZ, TREVOR A., “Bhopal Leaves a Lasting Legacy: The disaster taught some hard lessons that the chemical industry still sometimes forgets,” Chemical Processing, p. 15 (Dec. 2009).
MELHEM, G. A. and H. G. FISHER, International Symposium on Runaway Reactions and Pressure Relief Design, New York: Center for Chemical Process Safety (CCPS) of the American Institute of Chemical Engineers (AIChE) and The Institution of Chemical Engineers, 1995.
NAUMAN, E. BRUCE, Chemical Reactor Design, Optimization, and Scaleup. New York: McGraw-Hill, 2002.
Links
- The SAChE Web site has a great discussion on reactor safety with examples (www.sache.org). You will need a user name and password; both can be obtained from your department chair. Hit 2003 Tab. Go to K Problems.
- The reactor lab developed by Professor Herz and discussed in Chapters 4 and 5 could also be used here: www.SimzLab.com and also on the DVD-ROM.
- See the Center for Chemical Process Safety (CCPS) Web site, www.aiche.org/ccps/.
On CRE
This is not the end.
It is not even the beginning of the end.
But it is, perhaps, the end of the beginning.
—Winston Churchill November 10, 1942