
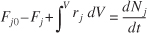
1.4.3 Packed-Bed Reactor (PBR)
The principal difference between reactor design calculations involving homogeneous reactions and those involving fluid-solid heterogeneous reactions is that for the latter, the reaction takes place on the surface of the catalyst (see Chapter 10). Consequently, the reaction rate is based on mass of solid catalyst, W, rather than on reactor volume, V. For a fluid–solid heterogeneous system, the rate of reaction of a species A is defined as
![]() = mol A reacted/(time × mass of catalyst)
= mol A reacted/(time × mass of catalyst)
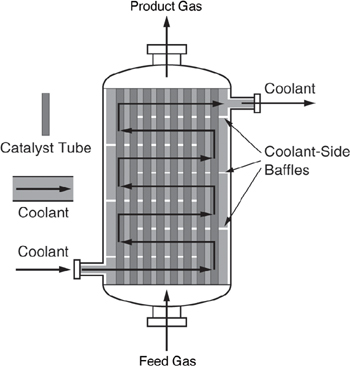
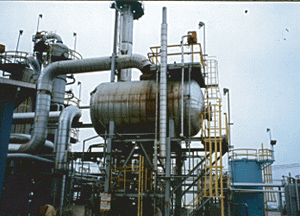
The mass of solid catalyst is used because the amount of catalyst is what is important to the rate of product formation. The reactor volume that contains the catalyst is of secondary significance. Figure 1-13 shows a schematic of an industrial catalytic reactor with vertical tubes packed with solid catalyst.
Figure 1-13. Longitudinal catalytic packed-bed reactor.
In the three idealized types of reactors just discussed (the perfectly mixed batch reactor, the plug-flow tubular reactor [PFR]), and the perfectly mixed continuous-stirred tank reactor [CSTR]), the design equations (i.e., mole balances) were developed based on reactor volume. The derivation of the design equation for a packed-bed catalytic reactor (PBR) will be carried out in a manner analogous to the development of the tubular design equation. To accomplish this derivation, we simply replace the volume coordinate in Equation (1-10) with the catalyst mass (i.e., weight) coordinate W (Figure 1-14).
Figure 1-14. Packed-bed reactor schematic.
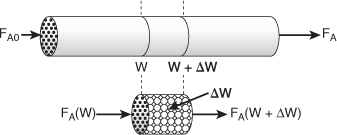
As with the PFR, the PBR is assumed to have no radial gradients in concentration, temperature, or reaction rate. The generalized mole balance on species A over catalyst weight ΔW results in the equation

The dimensions of the generation term in Equation (1-14) are
![]()
which are, as expected, the same dimensions of the molar flow rate FA. After dividing by ΔW and taking the limit as ΔW → 0, we arrive at the differential form of the mole balance for a packed-bed reactor:
![]()
When pressure drop through the reactor (see Section 5.5) and catalyst decay (see Section 10.7 in DVD-ROM Chapter 10) are neglected, the integral form of the packed-catalyst-bed design equation can be used to calculate the catalyst weight.
![]()
![]()
W is the catalyst weight necessary to reduce the entering molar flow rate of species A, FA0, down to a flow rate FA.
For some insight into things to come, consider the following example of how one can use the tubular reactor design in Equation (1-11).
Consider the liquid phase cis – trans isomerization of 2–butene
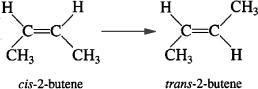
which we will write symbolically as
![]()
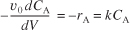
The reaction is first order in A (–rA = kCA) and is carried out in a tubular reactor in which the volumetric flow rate, υ, is constant, i.e., υ = υ0.
- Sketch the concentration profile.
- Derive an equation relating the reactor volume to the entering and exiting concentrations of A, the rate constant k, and the volumetric flow rate υ0.
- Determine the reactor volume necessary to reduce the exiting concentration to 10% of the entering concentration when the volumetric flow rate is 10 dm3/min (i.e., liters/min) and the specific reaction rate, k, is 0.23 min–1.
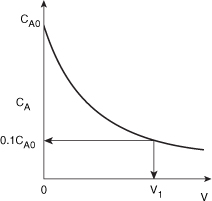
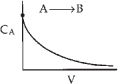
- Sketch CA as a function of V.
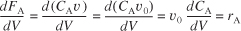
Species A is consumed as we move down the reactor, and as a result, both the molar flow rate of A and the concentration of A will decrease as we move. Because the volumetric flow rate is constant, υ = υ0, one can use Equation (1-8) to obtain the concentration of A, CA = FA/υ0, and then by comparison with Figure 1-12 plot, the concentration of A as a function of reactor volume, as shown in Figure E1-2.1.
Figure E1-2.1. Concentration profile.
- Derive an equation relating V, υ0, k, CA0, and CA.
For a tubular reactor, the mole balance on species A (j = A) was shown to be given by Equation (1-11). Then for species A (j = A)

For a first-order reaction, the rate law (discussed in Chapter 3) is

Because the volumetric flow rate, υ, is constant (υ = υ0), as it is for most all liquid-phase reactions,
Multiplying both sides of Equation (E1-2.2) by minus one and then substituting Equation (E1-2.1) yields
Separating the variables and rearranging gives

Using the conditions at the entrance of the reactor that when V = 0, then CA = CA0,
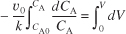
Carrying out the integration of Equation (E1-2.4) gives

We can also rearrange Equation (E1-2.5) to solve for the concentration of A as a function of reactor volume to obtain
CA = CA0exp(–kV/υ0)
- Calculate V. We want to find the volume, V1, at which
 for k = 0.23 min–1 and υ0 = 10 dm3/min.
Substituting CA0, CA, υ0, and k in Equation (E1-2.5), we have

Let’s calculate the volume to reduce the entering concentration to CA = 0.01 CA0. Again using equation (E1-2.5)

Note: We see that a larger reactor (200 dm3) is needed to reduce the exit concentration to a smaller fraction of the entering concentration (e.g., CA = 0.01 CA0).
We see that a reactor volume of 0.1 m3 is necessary to convert 90% of species A entering into product B for the parameters given.
Analysis: For this irreversible liquid-phase first order reaction (i.e., –rA = kCA) being carried out in a PFR, the concentration of the reactant decreases exponentially down the length (i.e., volume V) of the reactor. The more species A consumed and converted to product B, the larger must be the reactor volume V. The purpose of the example was to give a vision of the types of calculations we will be carrying out as we study chemical reaction engineering (CRE).
1.5 Industrial Reactors2
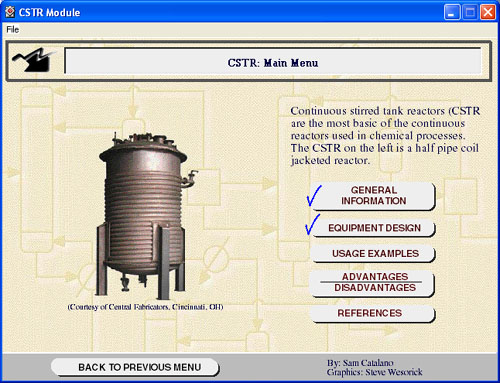
Be sure to view the actual photographs of industrial reactors on the DVD-ROM and on the Web site. There are also links to view reactors on different Web sites. The DVD-ROM also includes a portion of the Visual Encyclopedia of Equipment—“Chemical Reactors” developed by Dr. Susan Montgomery and her students at the University of Michigan. Also see Professional Reference Shelf on the DVD-ROM for “Reactors for Liquid Phase and Gas Phase Reactions.”
In this chapter, and on the DVD-ROM, we’ve introduced each of the major types of industrial reactors: batch, stirred tank, tubular, and fixed bed (packed bed). Many variations and modifications of these commercial reactors (e.g., semibatch, fluidized bed) are in current use; for further elaboration, refer to the detailed discussion of industrial reactors given by Walas.3

The DVD-ROM describes industrial reactors, along with typical feed and operating conditions. In addition, two solved example problems for Chapter 1 can be found on the DVD-ROM.

Closure. The goal of this text is to weave the fundamentals of chemical reaction engineering into a structure or algorithm that is easy to use and apply to a variety of problems. We have just finished the first building block of this algorithm: mole balances
![]()
This algorithm and its corresponding building blocks will be developed and discussed in the following chapters:
• Mole Balance, Chapter 1
• Rate Law, Chapter 3
• Stoichiometry, Chapter 4
• Combine, Chapter 5
• Evaluate, Chapter 5
• Energy Balance, Chapters 11 through 13
With this algorithm, one can approach and solve chemical reaction engineering problems through logic rather than memorization.
Summary
Each chapter summary gives the key points of the chapter that need to be remembered and carried into succeeding chapters.

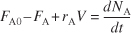
- A mole balance on species j, which enters, leaves, reacts, and accumulates in a system volume V, is
If, and only if, the contents of the reactor are well mixed, then the mole balance (Equation S1-1) on species A gives
- The kinetic rate law for rj is:
• The rate of formation of species j per unit volume (e.g., mol/s·dm3)
• Solely a function of the properties of reacting materials and reaction conditions (e.g., concentration [activities], temperature, pressure, catalyst, or solvent [if any]) and does not depend on reactor type.
• An intensive quantity (i.e., it does not depend on the total amount)
• An algebraic equation, not a differential equation (e.g., –rA = kCA,
 )
)For homogeneous catalytic systems, typical units of –rj may be gram moles per second per liter; for heterogeneous systems, typical units of
 may be gram moles per second per gram of catalyst. By convention, –rA is the rate of disappearance of species A and rA is the rate of formation of species A.
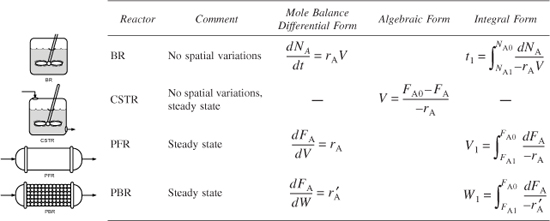
 - Mole balances on species A in four common reactors are as follows.
Table S.1. Summary of Reactor Mole Balances

DVD-ROM Material
• Learning Resources
- Summary Notes
- Web Material
A. Problem-Solving Algorithm
B. Getting Unstuck on a Problem
This site on the Web and DVD-ROM gives tips on how to overcome mental barriers in problem solving. BhanuThis site on the Web and DVD-ROM gives tips on how to overcome mental barriers in problem solving.
C. Smog in L.A. Web module includes a Living Example Problem.

B. Getting Unstuck
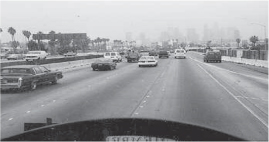
Fotografiert von ©2002 Hank Good.
- Interactive Computer Games
A. Quiz Show I


- Solved Problems
CDP1-AB Batch Reactor Calculations: A Hint of Things to Come
• FAQ [Frequently Asked Questions]—In Updates/FAQ icon section
• Professional Reference Shelf
R1.1 Photos of Real Reactors
R1.2 Reactor Section of the Visual Encyclopedia of Equipment
This section of the DVD-ROM shows industrial equipment and discusses its operation. The reactor portion of this encyclopedia is included on the DVD-ROM accompanying this book.
R1.3 Industrial Reactors
A. Liquid Phase
• Reactor sizes and costs
• Battery of stirred tanks
• Semibatch
B. Gas Phase
• Costs
• Fluidized bed schematic
R1.4 Top Ten List of Chemical Products and Chemical Companies
Questions and Problems
I wish I had an answer for that, because I’m getting tired of answering that question.
—Yogi Berra, New York Yankees Sports Illustrated, June 11, 1984
The subscript to each of the problem numbers indicates the level of difficulty: A, least difficult; D, most difficult.
![]()

In each of the questions and problems below, rather than just drawing a box around your answer, write a sentence or two describing how you solved the problem, the assumptions you made, the reasonableness of your answer, what you learned, and any other facts that you want to include. You may wish to refer to W. Strunk and E. B. White, The Elements of Style, 4th Ed. (New York: Macmillan, 2000) to enhance the quality of your sentences.
a. Read through the Preface. Write a paragraph describing both the content goals and the intellectual goals of the course and text. Also describe what’s on the DVD-ROM and how the DVD-ROM can be used with the text and course.
b. List the areas in Figure 1-2 you are most looking forward to studying.
c. Take a quick look at the Web Modules and list the ones that you feel are the most novel applications of CRE.
Revisit Example 1-1.
a. Rework this example using Equation 3-1 on page 75.
b. What does a negative number for the rate of formation of species (e.g., Species A) signify? What does a positive number signify? Explain.
c. Revisit Example 1-2. Calculate the volume of a CSTR for the conditions used to figure the plug-flow reactor volume in Example 1-2. Which volume is larger, the PFR or the CSTR? Explain why. Suggest two ways to work this problem incorrectly.
d. Revisit Example 1-2. Calculate the time to reduce the number of moles of A to 1% of its initial value in a constant-volume batch reactor for the same reaction and data in Example 1-2. Suggest two ways to work this problem incorrectly.

Visit the Web site on Critical and Creative Thinking, www.engin.umich.edu/~cre/probsolv/strategy/crit-n-creat.htm.
a. Write a paragraph describing what “critical thinking” is and how you can develop your critical thinking skills.
b. Write a paragraph describing what “creative thinking” is and then list four things you will do during the next month that will increase your creative thinking skills.
Surf the DVD-ROM and the Web (www.engin.umich.edu/~cre). Go on a scavenger hunt using the summary notes for Chapter 1 on the DVD-ROM.
a. Review the objectives for Chapter 1 in the Summary Notes on the DVD-ROM. Write a paragraph in which you describe how well you feel you met these objectives. Discuss any difficulties you encountered and three ways (e.g., meet with professor, classmates) you plan to address removing these difficulties.
b. Look at the Chemical Reactor section of the Visual Encyclopedia of Equipment on the DVD-ROM. Write a paragraph describing what you learned.
c. View the photos and schematics on the DVD-ROM under Essentials of Chemical Reaction Engineering—Chapter 1. Look at the QuickTime videos. Write a paragraph describing two or more of the reactors. What similarities and differences do you observe between the reactors on the Web (e.g., www.loebequipment.com), on the DVD-ROM, and in the text? How do the used reactor prices compare with those in Table 1-1?
a. Load the Interactive Computer Games (ICG) from the DVD-ROM or Web. Play this game and then record your performance number, which indicates your mastery of the material.
ICG Kinetics Challenge 1 Performance # ___________________________
b. View the YouTube video (www.youtube.com) made by the chemical reaction engineering students at the University of Alabama, entitled Fogler Zone (you’ve got a friend in Fogler). Type in “chemicalreactor” to narrow your search. You can also access it directly from a link in Chapter 1 Summary Notes on the Web site at www.umich.edu/~essen.
What assumptions were made in the derivation of the design equation for:
a. The batch reactor (BR)?
b. The CSTR?
c. The plug-flow reactor (PFR)?
d. The packed-bed reactor (PBR)?
e. State in words the meanings of –rA and ![]() . Is the reaction rate –rA an extensive quantity? Explain.
. Is the reaction rate –rA an extensive quantity? Explain.
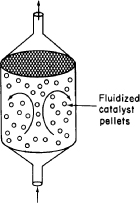
Use the mole balance to derive an equation analogous to Equation (1-7) for a fluidized CSTR containing catalyst particles in terms of the catalyst weight, W, and other appropriate terms. [Hint: See margin figure.]
We are going to consider the cell as a reactor. The nutrient corn steep liquor enters the cell of the microorganism Penicillium chrysogenum and is decomposed to form such products as amino acids, RNA, and DNA. Write an unsteady mass balance on (a) the corn steep liquor, (b) RNA, and (c) penicillin. Assume the cell is well mixed and that RNA remains inside the cell.

Schematic diagrams of the Los Angeles basin are shown in Figure P1-12B. The basin floor covers approximately 700 square miles (2 × 1010 ft2) and is almost completely surrounded by mountain ranges. If one assumes an inversion height in the basin of 2000 ft, the corresponding volume of air in the basin is 4 × 1013 ft3. We shall use this system volume to model the accumulation and depletion of air pollutants. As a very rough first approximation, we shall treat the Los Angeles basin as a well-mixed container (analogous to a CSTR) in which there are no spatial variations in pollutant concentrations.
Figure . Figure P1-12B Schematic diagrams of the Los Angeles basin.


We shall perform an unsteady-state mole balance on CO as it is depleted from the basin area by a Santa Ana wind. Santa Ana winds are high-velocity winds that originate in the Mojave Desert just to the northeast of Los Angeles. Load the Smog in Los Angeles Basin Web Module. Use the data in the module to work parts 1–12 (a) through (h) given in the module. Load the Living Example Polymath code and explore the problem. For part (i), vary the parameters υ0, a, and b, and write a paragraph describing what you find.

There is heavier traffic in the L.A. basin in the mornings and in the evenings as workers go to and from work in downtown L.A. Consequently, the flow of CO into the L.A. basin might be better represented by the sine function over a 24-hour period.
The reaction
![]()
is to be carried out isothermally in a continuous-flow reactor. The entering volumetric flow rate υ0 is 10 dm3/h. (Note: FA = CA υ. For a constant volumetric flow rate υ = υ0, then FA = CA υ0. Also, CA0 = FA0/υ0 = ([5 mol/h]/[10 dm3/h]) 0.5 mol/dm3.)
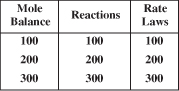
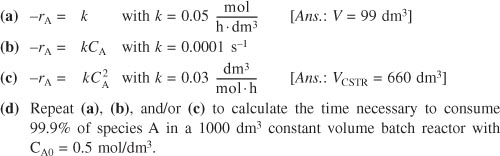
Calculate both the CSTR and PFR reactor volumes necessary to consume 99% of A (i.e., CA = 0.01CA0) when the entering molar flow rate is 5 mol/h, assuming the reaction rate –rA is:
This problem focuses on using Polymath, an ordinary differential equation (ODE) solver, and also a non-linear equation (NLE) solver. These equation solvers will be used extensively in later chapters. Information on how to obtain and load the Polymath Software is given in Appendix E and on the DVD-ROM.
a. There are initially 500 rabbits (x) and 200 foxes (y) on Farmer Oat’s property. Use Polymath or MATLAB to plot the concentration of foxes and rabbits as a function of time for a period of up to 500 days. The predator–prey relationships are given by the following set of coupled ordinary differential equations:


Constant for growth of rabbits k1 = 0.02 day–1
Constant for death of rabbits k2 = 0.00004/(day × no. of foxes)
Constant for growth of foxes after eating rabbits k3 = 0.0004/(day × no. of rabbits)
Constant for death of foxes k4 = 0.04 day–1
What do your results look like for the case of k3 = 0.00004/(day × no. of rabbits) and tfinal = 800 days? Also plot the number of foxes versus the number of rabbits. Explain why the curves look the way they do.
Vary the parameters k1, k2, k3, and k4. Discuss which parameters can or cannot be larger than others. Write a paragraph describing what you find.
b. Use Polymath or MATLAB to solve the following set of nonlinear algebraic equations:
x3y – 4y2 + 3x = 1
6y2 – 9xy = 5
with initial guesses of x = 2, y = 2. Try to become familiar with the edit keys in Polymath and MATLAB. See the DVD-ROM for instructions.
Screen shots on how to run Polymath are shown at the end of the Summary Notes for Chapter 1 on the DVD-ROM and on the Web
Enrico Fermi (1901–1954) Problems (EFP). Enrico Fermi was an Italian physicist who received the Nobel Prize for his work on nuclear processes. Fermi was famous for his “Back of the Envelope Order of Magnitude Calculation” to obtain an estimate of the answer through logic and making reasonable assumptions. He used a process to set bounds on the answer by saying it is probably larger than one number and smaller than another and arrived at an answer that was within a factor of 10.
See http://mathforum.org/workshops/sum96/interdisc/sheila2.html
Enrico Fermi Problem
a. EFP #1. How many piano tuners are there in the city of Chicago? Show the steps in your reasoning.
- Population of Chicago __________
- Number of people per household __________
- Etc. __________
An answer is given on the Web under Summary Notes for Chapter 1.
b. EFP #2. How many square meters of pizza were eaten by an undergraduate student body population of 20,000 during the Fall term 2010?
c. EFP #3. How many bath tubs of water will the average person drink in a lifetime?
d. EFP #4. Novel and Musical 24,601 = Jean

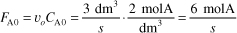
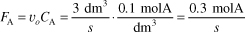
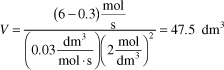
What is wrong with this solution?The irreversible liquid phase second order reaction ![]()
![]()
is carried out in a CSTR. The entering concentration of A, CA0, is 2 molar. and the exit concentration of A, CA is 0.1 molar. The volumetric flow rate, υo, is constant at 3 dm3/s. What is the corresponding reactor volume?
Solution
- Mole Balance

- Rate Law (2nd order)

- Combine

-
-
-
NOTE TO INSTRUCTORS: Additional problems (cf. those from the preceding editions) can be found in the solutions manual and on its DVD-ROM. These problems could be photocopied and used to help reinforce the fundamental principles discussed in this chapter.
Supplementary Reading
- For further elaboration of the development of the general balance equation, see not only the Web site www.umich.edu/~essen but also
FELDER, R. M., and R. W. ROUSSEAU, Elementary Principles of Chemical Processes, 3rd ed. New York: Wiley, 2000, Chapter 4.
MURPHY, REGINA M., Introduction to Chemical Processes: Principles, Analysis, Synthesis, New York, NY: McGraw-Hill Higher Education, 2007.
HIMMELBLAU, D. M., and J. D. Riggs, Basic Principles and Calculations in Chemical Engineering, 7th ed. Upper Saddle River, N.J.: Prentice Hall, 2004, Chapters 2 and 6.
SANDERS, R. J., The Anatomy of Skiing. Denver, CO: Golden Bell Press, 1976.
- A detailed explanation of a number of topics in this chapter can be found in the tutorials.
CRYNES, B. L., and H. S. FOGLER, eds., AIChE Modular Instruction Series E: Kinetics, Vols. 1 and 2. New York: AIChE, 1981.
- A discussion of some of the most important industrial processes is presented by
AUSTIN, G. T., Shreve’s Chemical Process Industries, 5th ed. New York: McGraw-Hill, 1984.