6.6.2 Semibatch Reactor Mole Balances
Of the two types of semibatch reactors, we focus attention primarily on the one with constant molar feed. A schematic diagram of this semibatch reactor is shown in Figure 6-5. We shall consider the elementary liquid-phase reaction
A + B → C
Figure 6-5. Semibatch reactor.
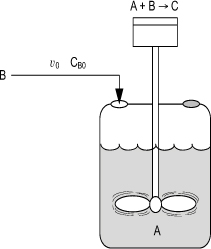
in which reactant B is slowly added to a well-mixed vat containing reactant A.
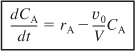
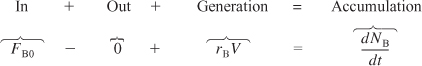
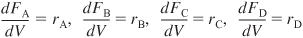
A mole balance on species A yields

Three variables can be used to formulate and solve semibatch reactor problems: the concentrations, Cj, the number of moles, Nj, and the conversion, X.
We shall use concentration as our variable, leaving the analysis of semi-batch reactors using the number of moles, Nj, and conversion X to the DVD-ROM and Web.
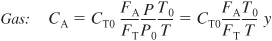
Recalling that the number of moles of A, NA, is just the product of concentration of A, CA, and the volume, V, [i.e., (NA = CAV)] we can rewrite Equation (6-9) as
![]()
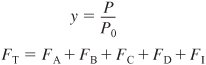
We note that since the reactor is being filled, the volume, V, varies with time. The reactor volume at any time t can be found from an overall mass balance of all species. The mass flow rate into the reactor, ![]() , is just the product of the liquid density, ρ0 and volumetric flow rate υ0. The mass of liquid inside the reactor, m, is just the product of the liquid density ρ and the volume of liquid V in the reactor. There is no mass flow out and no generation of mass.
, is just the product of the liquid density, ρ0 and volumetric flow rate υ0. The mass of liquid inside the reactor, m, is just the product of the liquid density ρ and the volume of liquid V in the reactor. There is no mass flow out and no generation of mass.
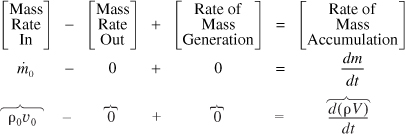
For a constant-density system, ρ0 = ρ, and
![]()
with the initial condition V = V0 at t = 0, integrating for the case of constant volumetric flow rate υ0 yields
![]()
Substituting Equation (6-12) into the right-hand side of Equation (6-10) and rearranging gives us
![]()
The balance on A [i.e., Equation (6-10)] can be rewritten as
A mole balance on B that is fed to the reactor at a rate FB0 is
Rearranging
![]()
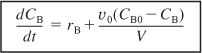
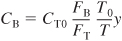
Differentiating NB (NB = CBV) and then using equation (6-12) to substitute for (dV/dt), the mole balance on B becomes
![]()
Rearranging
Similarly, for species C we have
![]()
![]()
Combining (6-17) and (6-18) and rearranging we obtain
![]()
Following the same procedure for species D
![]()
At time t = 0, the initial concentrations of B, C, and D in the vat are zero, CBi = 0. The concentration of B in the feed is CB0. If the reaction order is other than zero-or first-order, or if the reaction is nonisothermal, we must use numerical techniques to determine the conversion as a function of time. Equations (6-14), (6-16), (6-19), and (6-20) are easily solved with an ODE solver.
Example 6-3. Isothermal Semibatch Reactor with Second-Order Reaction
The production of methyl bromide is an irreversible liquid-phase reaction that follows an elementary rate law. The reaction
CNBr + CH3NH2 → CH3Br + NCNH2
is carried out isothermally in a semibatch reactor. An aqueous solution of methyl amine (B) at a concentration of 0.025 mol/dm3 is to be fed at a volumetric rate of 0.05 dm3/s to an aqueous solution of bromine cyanide (A) contained in a glass-lined reactor. The initial volume of liquid in the vat is to be 5 dm3 with a bromine cyanide concentration of 0.05 mol/dm3. The specific reaction rate constant is
k = 2.2 dm3/s·mol
Solve for the concentrations of bromine cyanide and methyl bromide and the rate of reaction as a function of time and then analyze your results.
Symbolically, we write the reaction as
A + B → C + D
Mole Balances:
![]()
![]()
![]()
![]()
Rates:
Rate Law (Elementary)
![]()
Relative Rates
![]()
Combining the mole balances [Equations (6-14), (6-16), (6-19), and (6-20)], the rate law Equation (E6-3.1), and the relative rates Equation (E6-3.2) we arrive at the following forms of the mole balances on A, B, C and D solely in terms of concentrations.
![]()
![]()
![]()
![]()
The volume of liquid in the reactor at any time t is
![]()
These coupled equations are easily solved with an ODE solver such as Polymath.
We could also calculate the conversion of A:
![]()
Substituting for NA0 and NA
![]()
The initial conditions are t = 0, CA0 = 0.05 mol/dm3, CB = CC, = CD = 0, and V0 = 5 dm3.
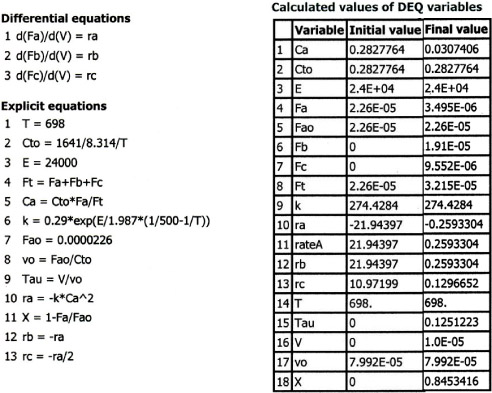
Equations (E6-3.2) through (E6-3.9) are easily solved with the aid of an ODE solver such as Polymath (Table E6-3.1).
Table E6-3.1. Polymath Program
ODE REPORT (RKF45)

The concentrations of bromine cyanide (A) and methyl amine are shown as a function of time in Figure E6-3.1, and the rate is shown in Figure E6-3.2.
Figure E6-3.1. Polymath output: concentration–time trajectories.

Figure E6-3.2. Reaction rate–time trajectory.

We note that the concentration of C goes through a maximum. The maximum occurs because once all of A has been consumed, then no more C will be formed and the continual flow of B into the reactor will thus dilute the moles of C produced and hence the concentration of C.
Analysis: Let’s look at the trends. The concentration of A falls close to zero at about 250 seconds, as does the reaction rate. Consequently, very little C is formed after this time, and what has been formed begins to be diluted as B continues to be added to the reactor and stops just before it overflows. Now what do you think of the time to carry out this reaction? It’s about 5 minutes, hardly enough time to turn the valves on and off. Take away lessons: While this example showed how to analyze a semibatch reactor, you would not use a semibatch reactor to carry out this reaction at this temperature because the times are too short. Instead you would use a tubular reactor with B fed through the sides or a number of CSTRs in series with A fed to the first reactor and small amounts of B fed to each of the following reactors. We will discuss this further in Chapter. 8.
Equilibrium Conversion
For reversible reactions carried out in a semibatch reactor, the maximum attainable conversion (i.e., the equilibrium conversion) will change as the reaction proceeds because more reactant is continuously added to the reactor. This addition shifts the equilibrium continually to the right toward more product. Further discussion on this point and calculation of the equilibrium conversion can be found on the Professional Reference Shelf R6.1D on the DVD-ROM and on the Web.
Closure. Chapters 5 and 6 present the heart of chemical reaction engineering for isothermal reactors. After completing these chapters, the reader should be able to apply the algorithm building blocks
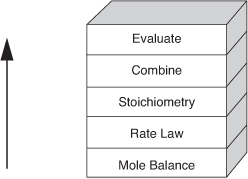
to any of the reactors discussed in this chapter: batch reactor, CSTR, PFR, PBR, membrane reactor, and semibatch reactor. The reader should be able to account for pressure drop and describe the effects of the system variables The reader should be able to use either conversions (Chapter 5) or concentration and molar flow rates (Chapter 6) to solve chemical reaction engineering problems.
Summary
- Solution algorithm—measures other than conversion
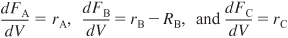
When using measures other than conversion for reactor design, the mole balances are written for each species in the reacting mixture:
The mole balances are then coupled through their relative rates of reaction. If

for aA + bB → cC + dD, then

Concentration can also be expressed in terms of the number of moles (batch) and in terms of molar flow rates).

- For membrane reactors the mole balances for the reaction

when reactant A and product C do not diffuse out the membrane
with

and kc is the overall mass transfer coefficient.
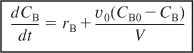
- For semibatch reactors, reactant B is fed continuously to a vat initially containing only A:

ODE Solver Algorithm
When using an ordinary differential equation (ODE) solver such as Polymath or MATLAB, it is usually easier to leave the mole balances, rate laws, and concentrations as separate equations, rather than combining them into a single equation as we did to obtain an analytical solution. Writing the equations separately leaves it to the computer to combine them and produce a solution. The formulations for a packed-bed reactor with pressure drop and a semibatch reactor are given below for two elementary reactions carried out isothermally.

The Polymath solutions to the above equations are given on the DVD-ROM in the Chapter 6 Summary Notes.
DVD-ROM Material
• Learning Resources


• Living Example Problems
Example 6-1 Gas-Phase Reaction in Microreactor—Molar Flow Rate
Example 6-2 Membrane Reactor
Example 6-3 Isothermal Semibatch Reactor
• Professional Reference Shelf
R6.1
Unsteady CSTRs and Semibatch Reactors
R6.1A
Start-up of a CSTR
R6.1B
Semibatch Reactor Balances in Terms of Number of Moles
R6.1C
Semibatch Reactor Balance in Terms of Conversion
R6.1D
Equilibrium Conversion
R6.2
The Practical Side
A number of practical guidelines for operating chemical reactors are given.
R6.3
Aerosol Reactors
Aerosol reactors are used to synthesize nano-size particles. Owing to their size, shape, and high specific surface area, nanoparticles can be used in a number of applications such as in pigments in cosmetics, membranes, photo-catalytic reactors, catalysts and ceramics, and catalytic reactors.
We use the production of aluminum particles as an example of an aerosol plug-flow reactor (APFR) operation. A stream of argon gas saturated with Al vapor is cooled.

As the gas is cooled, it becomes supersaturated, leading to the nucleation of particles. This nucleation is a result of molecules colliding and agglomerating until a critical nucleus size is reached and a particle is formed. As these particles move down the reactor, the supersaturated gas molecules condense on the particles causing them to grow in size and then to flocculate. In the development on the DVD-ROM, we will model the formation and growth of aluminum nanoparticles in an AFPR.
Questions and Problems
The subscript to each of the problem numbers indicates the level of difficulty: A, least difficult; D, most difficult.
![]()

In each of the following questions and problems, rather than just drawing a box around your answer, write a sentence or two describing how you solved the problem, the assumptions you made, the reasonableness of your answer, what you learned, and any other facts that you want to include. You may wish to refer to W. Strunk and E. B. White, The Elements of Style, 4th ed. (New York: Macmillan, 2000) and Joseph M. Williams, Style: Ten Lessons in Clarity & Grace, 6th ed. (Glenview, Ill.: Scott, Foresman, 1999) to enhance the quality of your sentences. See the Preface for additional generic parts (x), (y), (z) to the home problems.
Read through all the problems at the end of this chapter. Make up and solve an original problem based on the material in this chapter. (a) Use real data and reactions for further instructions. (b) Make up a reaction and data. (c) Use an example from everyday life (e.g., cooking spaghetti). [See P5-1A.]
What if... you were asked to explore the example problems in this chapter to learn the effects of varying the different parameters? This sensitivity analysis can be carried out by either downloading the examples from the Web or by loading the programs from the DVD-ROM supplied with the text. For each of the example problems you investigate, write a paragraph describing your findings.
a. Example 6-1. Load the Living Example Problem 6-1 from the DVD-ROM or Web. (1) What would be the conversion if the pressure were doubled and the temperature were decreased by 20°C? (2) Compare Figure E6-1.1 profiles with those for a reversible reaction with KC = 0.02 mol/dm3 and describe the differences in the profiles. (3) How would your profiles change for the case of an irreversible reaction with pressure drop when αp = 99 × 103 dm–3 for each tube?
b. Example 6-2. Load the Living Example Problem 6-2 from the DVD-ROM or Web. (1) What is the effect of adding inerts in the feed? (2) Vary parameters (e.g., kC), and ratios of parameters (k/kC), (kτCA0/Ke), etc., and write a paragraph describing what you find. What ratio of parameters has the greatest effect on the conversion X = (FA0 – FA)/FA0?
c. Example 6-3. Load the Living Example Problem 6-3 from the DVD-ROM or Web. The temperature is to be lowered by 35°C so that the reaction rate constant is now (1/10) its original value. (1) If the concentration of B is to be maintained at 0.01 mol/dm3 or below, what is the maximum feed rate of B? (2) How would your answer change if the concentration of A were tripled? (3) Redo this problem when the reaction is reversible with KC = 0.1 and compare with the irreversible case. (Only a couple of changes in the Polymath program are necessary.)
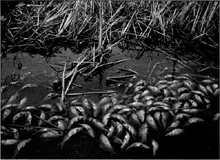
d. Web Module on Wetlands from the DVD-ROM or Web. Load the Polymath program and vary a number of parameters such as rainfall, evaporation rate, atrazine concentration, and liquid flow rate, and write a paragraph describing what you find. This topic is a hot Ch.E. research area.
e. Web Module on Aerosol Reactors from the DVD-ROM. Load the Polymath program and (1) vary the parameters, such as cooling rate and flow rate, and describe their effect on each of the regimes: nucleation, growth and flocculation. Write a paragraph describing what you find. (2) It is proposed to replace the carrier gas by helium
i. Compare your plots (He versus Ar) of the number of Al particles as a function of time. Explain the shape of the plots.
ii. How does the final value of dp compare with that when the carrier gas was argon? Explain.
iii. Compare the time at which the rate of nucleation reaches a peak in the two cases [carrier gas = Ar and He]. Discuss the comparison.
Data for a He molecule: mass = 6.64 × 10⁻²⁷ kg, volume = 1.33 × 10⁻²⁹ m3, surface area = 2.72 × 10⁻¹⁹ m2, bulk density = 0.164 kg/m3, at normal temperature (25°C) and pressure (1 atm).
f. The Work Self Tests on the Web. Write a question for this problem that involves critical thinking and explain why it involves critical thinking. See examples on the Web, Summary Notes for Chapter 6.

Load the Interactive Computer Games (ICG) from the DVD-ROM. Play the game and then record your performance number, which indicates your mastery of the material. Your instructor has the key to decode your performance number. Knowledge of all sections is necessary to pit your wit against the computer adversary in playing a game of Tic-Tac-Toe.
Performance number: __________________
Revisit problem P5-12B for the case when the reaction is reversible with KC = 0.025 dm6/mol2 and the reaction is carried out at 300 K in a membrane reactor where C2H6 is diffusing out. The membrane transport coefficient is kC = 0.08 s–1.
a. What is the equilibrium conventional conversion in a PFR? What is the exit conversion?
b. Plot and analyze the conversion and molar flow rates in the membrane reactor as a function of reactor volume up to the point where 80% conversion of di-tert-butyl peroxide is achieved. Note any maxima in the flow rates.
c. Apply one or more of the six ideas in Table P-3, page xiii to this problem.
Nutrition is an important part of ready-to-eat cereal. To make cereal healthier, many nutrients are added. Unfortunately, nutrients degrade over time, making it necessary to add more than the declared amount to assure enough for the life of the cereal. Vitamin V1 is declared at a level of 20% of the Recommended Daily Allowance per serving size (serving size = 30 g). The Recommended Daily Allowance is 6500 IU (1.7 × 10⁶ IU = 1 g). It has been found that the degradation of this nutrient is first-order in the amount of nutrients. Accelerated storage tests have been conducted on this cereal, with the following results:
![]()
![]()
a. Given this information and the fact that the cereal needs to have a vitamin level above the declared value of 6500 IU for 1 year at 25°C, what IU should be present in the cereal at the time it is manufactured? Your answer may also be reported in percent overuse. [Ans. 12%]
![]()
b. At what percent of declared value of 6500 IU must you apply the vitamin? If 10,000,000 lb/yr of the cereal is made and the nutrient cost is $100 per pound, how much will this overuse cost?
c. If this were your factory, what percent overuse would you actually apply and why?
d. How would your answers change if you stored the material in a Bangkok warehouse for 6 months, where the daily temperature is 40°C, before moving it to the supermarket? (Table of results of accelerated storage tests on cereal and problem of vitamin level of cereal after storage courtesy of General Mills, Minneapolis, MN.)
The production of ethylene glycol from ethylene chlorohydrin and sodium bicarbonate
CH2OHCH2Cl + NaHCO3 → (CH2OH)2 + NaCl + CO2
is carried out in a semibatch reactor. A 1.5 molar solution of ethylene chlorohydrin is fed at a rate 0.1 mole/minute to 1500 dm3 of a 0.75 molar solution of sodium bicarbonate. The reaction is elementary and carried out isothermally at 30°C where the specific reaction rate is 5.1 dm3/mol/h. Higher temperatures produce unwanted side reactions. The reactor can hold a maximum of 2500 dm3 of liquid. Assume constant density.
a. Plot and analyze the conversion, reaction rate, concentration of reactants and products, and number of moles of glycol formed as a function of time.
b. Suppose you could vary the flow rate between 0.01 and 200 mol/min. What flow rate and holding time would you choose to make the greatest number of moles of ethylene glycol in 24 hours, keeping in mind the downtimes for cleaning, filling, etc., shown in Table 5-3?
c. Suppose the ethylene chlorohydrin is fed at a rate of 0.15 mol/min until the reactor is full and then shut in. Plot the conversion as a function of time.
d. Discuss what you learned from this problem and what you believe to be the point of this problem.
The following elementary reaction is to be carried out in the liquid phase
![]()
The initial concentrations are 0.2 M in NaOH and 0.25 M in CH3COOC2H5 with k = 5.2 × 10⁻⁵ dm3/mol·s at 20°C with E = 42,810 J/mol. Design a set of operating conditions (e.g., υ0, T, . . .) to produce 200 mol/day of ethanol in a semibatch reactor and not operate above 37°C and below a concentration of NaOH of 0.02 molar.6 The semibatch reactor you have available is 1.5 m in diameter and 2.5 m tall. The reactor down time is (tc + te + tf) = 3h.
(Membrane reactor) The first-order, reversible reaction
![]()
is taking place in a membrane reactor. Pure A enters the reactor, and B diffuses through the membrane. Unfortunately, some of the reactant A also diffuses through the membrane.
a. Plot and analyze the flow rates of A, B, and C down the reactor, as well as the flow rates of A and B through the membrane.
b. Compare the conversion profiles of a conventional PFR with those of an IMRCF. What generalizations can you make?
c. Would the conversion of A be greater or smaller if C were diffusing out instead of B?
d. Discuss qualitatively how your curves would change if the temperature were increased significantly or decreased significantly for an exothermic reaction. Repeat the discussion for an endothermic reaction.
Additional information:
k = 10 min–1
KC = 0.01 mol2/dm6
kCA = 1 min–1
kCB = 40 min–1
FA0 = 100 mol/min
υ0 = 100 dm3/min
Vreactor = 20 dm3
Fuel Cells. Because of the focus on alternative clean energy sources, we are moving toward an increased use of fuel cells to operate appliances ranging from computers to automobiles. For example, the hydrogen/oxygen fuel cell produces clean energy as the products are water and electricity, which may lead to a hydrogen based economy instead of a petroleum-based economy. A large component in the processing train for fuel cells is the water gas shift membrane reactor. (M. Gummala, N. Gupla, B. Olsomer, and Z. Dardas, Paper 103c, 2003, AIChE National Meeting, New Orleans, LA.)
![]()

Here, CO and water are fed to the membrane reactor containing the catalyst. Hydrogen can diffuse out the sides of the membrane, while CO, H2O, and CO2 cannot. Based on the following information, plot the concentrations and molar flow rates of each of the reacting species down the length of the membrane reactor. Assume the following: The volumetric feed is 10 dm3/min at 10 atm, and the equimolar feed of CO and water vapor with CT0 = 0.4 mol/dm3. The equilibrium constant is Ke = 1.44. The k specific reaction rate constant is 1.37 dm6/mol kg cat· min, and the mass transfer coefficient for hydrogen, kH2 = 0.1 dm3/kg cat·min.
a. What is the reactor volume necessary to achieve 85% conversion of CO?
b. Compare with a PFR.
c. For that same reactor volume, what would be the conversion if the feed rate were doubled?
Go to Professor Herz’s Reactor Lab on the DVD-ROM or on the Web at www.SimzLab.com. Load Division 2, Lab 2 of The Reactor Lab concerning a packed-bed reactor (labeled PFR) in which a gas with the physical properties of air flows over spherical catalyst pellets. Perform experiments here to get a feeling for how pressure drop varies with input parameters such as reactor diameter, pellet diameter, gas flow rate, and temperature. In order to get significant pressure drop, you may need to change some of the input values substantially from those shown when you enter the lab. If you get a notice that you can’t get the desired flow, then you need to increase the inlet pressure.
Pure butanol is to be fed into a semibatch reactor containing pure ethyl acetate to produce butyl acetate and ethanol. The reaction
![]()
is elementary and reversible. The reaction is carried out isothermally at 300 K. At this temperature, the equilibrium constant is 1.08 and the specific reaction rate is 9 × 10⁻⁵ dm3/mol · s. Initially, there is 200 dm3 of ethyl acetate in the vat, and butanol is fed at a volumetric rate of 0.05 dm3/s. The feed and initial concentrations of butanol and ethyl acetate are 10.93 mol/dm3 and 7.72 mol/dm3, respectively.
a. Plot and analyze the equilibrium conversion of ethyl acetate as a function of time.
b. Plot and analyze the conversion of ethyl acetate, the rate of reaction, and the concentration of butanol as a function of time.
c. Rework part (b), assuming that ethanol evaporates (reactive distillation) as soon as it forms. [This is a graduate level question.]
d. Use Polymath or some other ODE solver to learn the sensitivity of conversion to various combinations of parameters [e.g., vary FB0, NA0, υ0].
e. Apply one or more of the six ideas in Table P-3, page xiii to this problem.
f. Write a question that requires critical thinking and then explain why your question requires critical thinking. [Hint: See Preface pages xvi and xvii.]
An isothermal reversible reaction ![]() is carried out in an aqueous solution. The reaction is first-order in both directions. The forward rate constant is 0.4 h–1 and the equilibrium constant is 4.0. The feed to the plant contains 100 kg/m3 of A and enters at the rate of 12 m3/h. Reactor effluents pass to a separator, where B is completely recovered. The reactor is a stirred tank of volume 60 m3. A fraction, f1, of the unreacted effluent is recycled as a solution containing 100 kg/m3 of A and the remainder is discarded. Product B is worth $2 per kilogram and operating costs are $50 per cubic meter of solution entering the separator. What value of f maximizes the operational profit of the plant? What fraction A fed to the plant is converted at the optimum? [H. S. Shankar, IIT Mumbai.]
is carried out in an aqueous solution. The reaction is first-order in both directions. The forward rate constant is 0.4 h–1 and the equilibrium constant is 4.0. The feed to the plant contains 100 kg/m3 of A and enters at the rate of 12 m3/h. Reactor effluents pass to a separator, where B is completely recovered. The reactor is a stirred tank of volume 60 m3. A fraction, f1, of the unreacted effluent is recycled as a solution containing 100 kg/m3 of A and the remainder is discarded. Product B is worth $2 per kilogram and operating costs are $50 per cubic meter of solution entering the separator. What value of f maximizes the operational profit of the plant? What fraction A fed to the plant is converted at the optimum? [H. S. Shankar, IIT Mumbai.]
The second-order liquid phase reaction
![]()
is carried out in a batch reactor at 35°C. The specific reaction rate constant is 0.0445 dm3/mol/min. The reactor 1 is changed with 1,000 dm3, where the concentration of each reactant after mixing is 2M.
a. What is the conversion after 10, 50, and 100 minutes?
Now, consider the case when after filling reactor 1, the drain at the bottom of reactor 1 is left open and it drains into reactor 2, mounted below it, at volumetric rate of 10 dm3/min.
![]()
b. What will be the conversion and concentration of each species in the reactor 1 after 10, 50, and 80 minutes in the reactor that is being drained?
c. What is the conversion and concentration of each species in the reactor 2 that is filling up with the liquid from reactor 1 after 10, and after 50 minutes?
d. At the end of 50 minutes the contents of the two reactors are added together. What is the overall conversion after mixing?
e. Apply one or more of the six ideas in Table P-3, page xiii to this problem.
What four things are wrong with this solution?
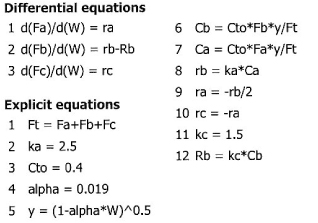
The gas phase elementary reaction
2A → B + 2C
is carried out in a membrane reactor in which there is pressure drop with α = 0.019 kg–1. An equal molar feed of A and inerts, I, enter the reactor with CA0 = 0.4 mol/dm5 and a total volumetric flow rate of 25 dm3/s. Only species B can exit through the membrane. The specific reaction rate is kA = 2.5 dm6/mol/kg/s, and the mass transfer coefficient kC = 1.5 dm3/kg·s. Plot the conversion of A down the membrane reactor containing 50 kg of catalyst.
Solution