
9.3.3 Noncompetitive Inhibition (Mixed Inhibition)12
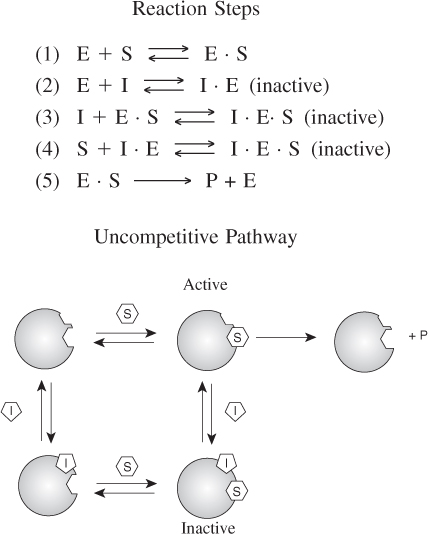
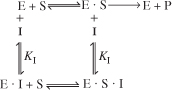
In noncompetitive inhibition, also sometimes called mixed inhibition, the substrate and inhibitor molecules react with different types of sites on the enzyme molecule. Whenever the inhibitor is attached to the enzyme it is inactive and cannot form products. Consequently, the deactivating complex (I · E · S) can be formed by two reversible reaction paths.
- After a substrate molecule attaches to the enzyme molecule at the substrate site, then the inhibitor molecule attaches to the enzyme at the inhibitor site.
- After an inhibitor molecule attaches to the enzyme molecule at the inhibitor site, then the substrate molecule attaches to the enzyme at the substrate site.
These paths, along with the formation of the product, P, are shown in Figure 9-13. In noncompetitive inhibition, the enzyme can be tied up in its inactive form either before or after forming the enzyme substrate complex as shown in steps 2, 3, and 4.

Figure 9-13. Steps in noncompetitive enzyme inhibition.
Again starting with the rate law for the rate of formation of product and then applying the PSSH to the complexes (I · E) and (I · E · S), we arrive at the rate law for the noncompetitive inhibition
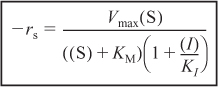
The derivation of the rate law is given in the Summary Notes on the Web and DVD-ROM. Equation (9-42) is in the form of the rate law that is given for an enzymatic reaction exhibiting noncompetitive inhibition. Heavy metal ions such as Pb2+, Ag+, and Hg2+, as well as inhibitors that react with the enzyme to form chemical derivatives, are typical examples of noncompetitive inhibitors.
Rearranging
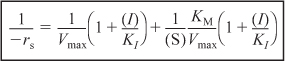
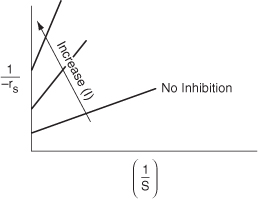
For noncompetitive inhibition, we see in Figure 9-14 that both the slope ![]() and intercept
and intercept ![]() increase with increasing inhibitor concentration. In practice, uncompetitive inhibition and mixed inhibition are generally observed only for enzymes with two or more substrates, S1 and S2.
increase with increasing inhibitor concentration. In practice, uncompetitive inhibition and mixed inhibition are generally observed only for enzymes with two or more substrates, S1 and S2.
Figure 9-14. Lineweaver–Burk plot for noncompetitive enzyme inhibition.
The three types of inhibition are compared with a reaction without inhibitors and are summarized on the Lineweaver–Burk plot shown in Figure 9-15.
Figure 9-15. Summary: Lineweaver–Burk plots for three types of enzyme inhibition.

In summary, we observe the following trends and relationships:
- In competitive inhibition the slope increases with increasing inhibitor concentration, while the intercept remains fixed.
- In uncompetitive inhibition, the y-intercept increases with increasing inhibitor concentration, while the slope remains fixed.
- In noncompetitive inhibition (mixed inhibition), both the y–intercept and slope will increase with increasing inhibitor concentration.
Problem P9-12B asks you to find the type of inhibition for the enzyme catalyzed reaction of starch.