
9.4.3 Stoichiometry
The stoichiometry for cell growth is very complex and varies with microorganism/nutrient system and environmental conditions such as pH, temperature, and redox potential. This complexity is especially true when more than one nutrient contributes to cell growth, as is usually the case. We shall focus our discussion on a simplified version for cell growth, one that is limited by only one nutrient in the medium. In general, we have
![]()
In order to relate the substrate consumed, new cells formed, and product generated, we introduce the yield coefficients. The yield coefficient for cells and substrate is

A representative value of Yc/s might be 0.4 (g/g).
The reciprocal of Yc/s, i.e., Ys/c,
![]()
gives the ratio of –ΔCs (the substrate that must be consumed to increase the cell concentration of ΔCc) to the increase in cell concentration ΔCc.
Product formation can take place during different phases of the cell growth cycle. When product formation only occurs during the exponential growth phase, the rate of product formation is
![]()
where

The product of Yp/c and μ—that is, (qP = Yp/c μ)—is often called the specific rate of product formation, qP, (mass product/volume/time). When the product is formed during the stationary phase where no cell growth occurs, we can relate the rate of product formation to substrate consumption by
![]()
The substrate in this case is usually a secondary nutrient, which we discuss in more detail later when the stationary phase is discussed.
The stoichiometric yield coefficient that relates the amount of product formed per mass of substrate consumed is
![]()
In addition to consuming substrate to produce new cells, part of the substrate must be used just to maintain a cell’s daily activities. The corresponding maintenance utilization term is
![]()
A typical value is
![]()
The rate of substrate consumption for maintenance, rsm, whether or not the cells are growing is
![]()
When maintenance can be neglected, we can relate the concentration of new cells formed to the amount of substrate consumed by the equation
![]()
This equation can be used for both batch and continuous flow reactors.
If it is possible to sort out the substrate (S) that is consumed in the presence of cells to form new cells (C) from the substrate that is consumed to form product (P), that is,
![]()
the yield coefficients can be written as
![]()
![]()
These yield coefficients will be discussed further in the substrate utilization section.
Substrate Utilization
We now come to the task of relating the rate of nutrient (i..e., substrate) consumption, –rs, to the rates of cell growth, product generation, and cell maintenance. In general, we can write
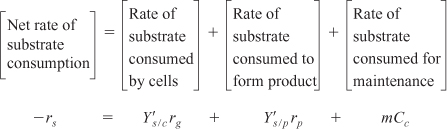
In a number of cases extra attention must be paid to the substrate balance. If product is produced during the growth phase, it may not be possible to separate out the amount of substrate consumed for cell growth (i.e., produce more cells) from that consumed to produce the product. Under these circumstances, all the substrate consumed for growth and for product formation is lumped into a single stoichiometric yield coefficient, Ys/c, and the rate of substrate disappearance is
![]()
The corresponding rate of product formation is
![]()
The Stationary Phase
Because there is no growth during the stationary phase, it is clear that Equation (9-70) cannot be used to account for substrate consumption, nor can the rate of product formation be related to the growth rate [e.g., Equation (9-63)]. Many antibiotics, such as penicillin, are produced in the stationary phase. In this phase, the nutrient required for growth becomes virtually exhausted, and a different nutrient, called the secondary nutrient, is used for cell maintenance and to produce the desired product. Usually, the rate law for product formation during the stationary phase is similar in form to the Monod equation, that is,

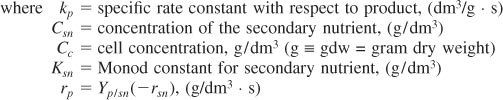
The net rate of secondary nutrient consumption, rsn, during the stationary phase is

Because the desired product can be produced when there is no cell growth, it is always best to relate the product concentration to the change in secondary nutrient concentration. For a batch system the concentration of product, Cp, formed after a time t in the stationary phase can be related to the secondary nutrient concentration, Csn, at that time.
![]()
We have considered two limiting situations for relating substrate consumption to cell growth and product formation; product formation only during the growth phase and product formation only during the stationary phase. An example where neither of these situations applies is fermentation using lactobacillus, where lactic acid is produced during both the logarithmic growth and stationary phase.
The specific rate of product formation is often given in terms of the Luedeking–Piret equation, which has two parameters α (growth) and β (nongrowth)
![]()
with
rp = qpCc
The assumption here in using the β-parameter is that the secondary nutrient is in excess.
Example 9-4. Estimate the Yield Coefficients
The following data was obtained from batch reactor experiments for the yeast Saccharomyces cerevisiae
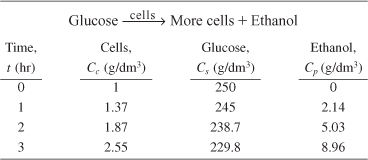
a. Determine the yield coefficients Ys/c, Yc/s, Ys/p, Yp/s, and Yp/c. Assume no lag and neglect maintenance at the start of the growth phase when there are just a few cells.
b. Describe how to find the rate law parameters μmax and Ks.
a. Yield coefficients
Calculate the substrate and cell yield coefficients, Ys/c and Yc/s.
Between t = 0 and t = 1 h
E9-4.1
![]()
Between t = 2 and t = 3 h
E9-4.2
![]()
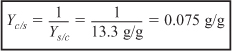
Taking an average
E9-4.3
![]()
We could also have used Polymath regression to obtain
E9-4.4
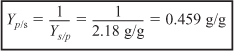
Similarly, using the data at 1 and 2 hours, the substrate/product yield coefficient is
E9-4.5
![]()
E9-4.6
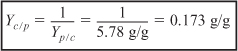
and the product/cell yield coefficient is
E9-4.7
![]()
E9-4.8
b. Rate law parameters
We now need to determine the rate law parameters μmax and Ks in the Monod equation
9-53
![]()
For a batch system
E9-4.9
![]()
To find the rate law parameters μmax and Ks, we first apply the differential formulas in Chapter 7 to columns 1 and 2 of Table E9-4.1 to find rg and then use the results to add another column to Table E9-4.1. Because Cs >> Ks initially, it is best to regress the data using the Hanes–Woolf form of the Monod equation
E9-4.10
![]()
We now use the newly calculated rg along with Cc and Cs in Table E9-4.1 to prepare a table of (Cc/rg) as a function of (1/Cs). Next, we use Polymath’s nonlinear regression of Equation (E9-5.10), along with more data points, to find μmax = 0.33 h–1 and Ks = 1.7g/dm3.
Analysis: We first used the data in Table E9-4.1 to calculate the yield coefficient Ys/c, Yc/s, Ys/p, Yp/s, and Yp/c. Next, we used nonlinear regression to find the Monod rate law parameters μmax and Ks.