
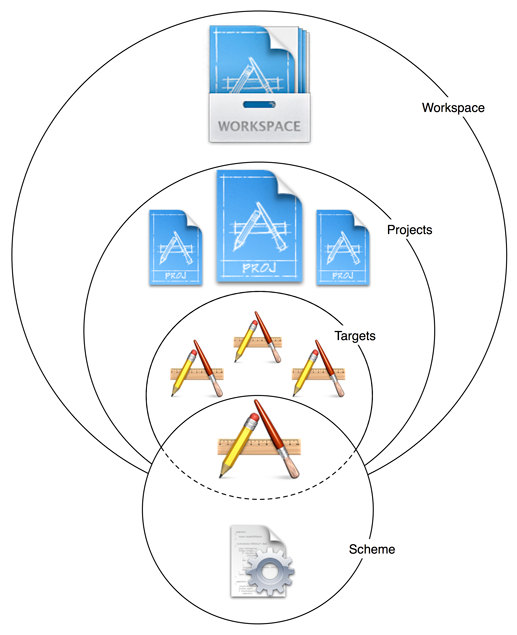
In Chapter 4, we talked about how a workspace is a collection of projects, and a project is a collection targets and files. A target has a number of build settings and phases that reference files from its project. (We’ll talk more about those shortly.) When built, a target creates a product, which is usually an application. A scheme contains one or more targets and specifies what to do with the product or products (Figure 21.18).
When you create a new project, a scheme with the same name as the project is created for you. This project has a TouchTracker scheme, and this scheme contains the TouchTracker target, which is responsible for building the TouchTracker iOS application.
To view the details of a scheme, click the Scheme pop-up menu at the top left of the Xcode window and select Edit Scheme.... The scheme editor will drop down into the workspace (Figure 21.19).
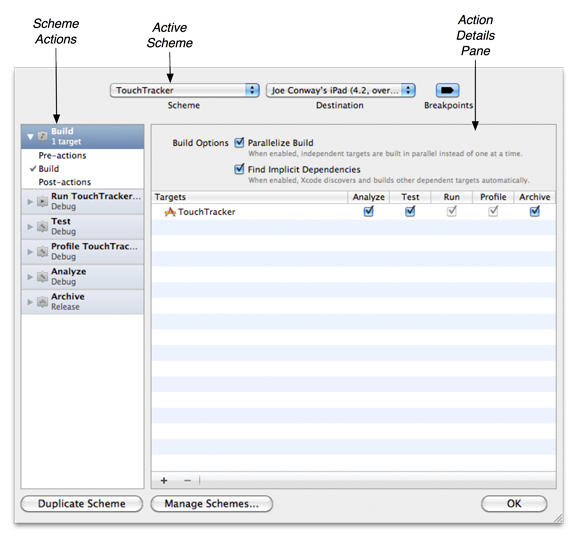
On the left side of the scheme editor is the list of actions that every scheme can do. (Notice that these scheme actions are also the choices you see when you click and hold the Run button in the Xcode workspace – with the exception of Archive.) Selecting a scheme action here shows its options in the details pane. Take a moment to look over the actions and the available options. Notice that some actions have multiple tabs that categorize their options.
As projects become larger and more complicated, they require more specific testing and debugging. This can result in more time fiddling with the options for scheme actions. To avoid constant fiddling, we typically create new schemes for common situations. For example, if we have an application that consumes a lot of memory, we might want to routinely run the Allocations instrument on it. Instead of having Instruments ask which instrument to use when we profile the application, we can set up a new scheme that always runs Allocations.
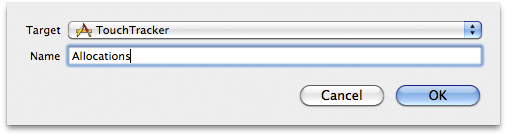
Let’s set up this scheme for the TouchTracker target. From the Scheme pop-up menu, select New Scheme.... When the sheet drops down, enter Allocations into the name and make sure TouchTracker is selected as the target (Figure 21.20). Click OK.
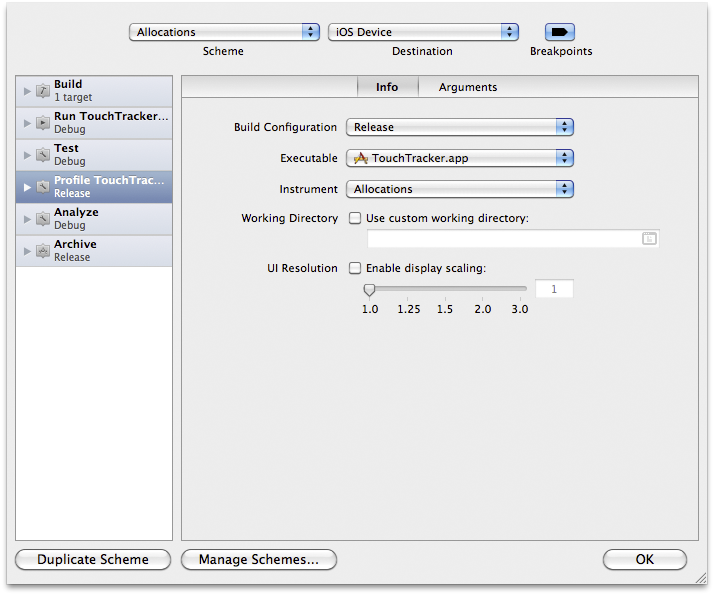
Reopen the scheme editor sheet either by selecting from the Scheme pop-up menu or using the keyboard shortcut Command-Shift-<. Then click the Scheme pop-up menu in the scheme editor and select Allocations. Select the Profile action from the left table. On the detail pane, change the Instrument pop-up to Allocations and click OK (Figure 21.21).
To use your new scheme, click the Scheme pop-up menu back on the workspace window. Here you can choose which scheme to use and a destination device for that scheme. Choose one of the destination options under the Allocations heading (Figure 21.22). Then, profile your application. Instruments will launch your application and automatically start the Allocations instrument.

Switch back to the default TouchTracker scheme and profile again. This time, Instruments will again ask you to choose an instrument.
Here’s a handy scheme tip: hold down the option key when selecting a scheme action from the Run button. This automatically opens the scheme editor and allows you to quickly review and change the settings of the selected scheme before performing the action. In fact, holding the option key down will open the scheme editor whether you select the action from the Run pop-up button, from the Product menu, or use a keyboard shortcut.