9. Operating Considerations for Bioreactors for Suspension and Immobilized Cultures
So far, we have discussed what cells are, how they work, and how to describe their growth in simple reactors. We now begin our discussion of how to use these cells in industrial processes. This chapter explores some complicated reactor strategies and why they might be considered for use in real processes. Chapter 10, “Selection, Scale-Up, Operation, and Control of Bioreactors,” gives more details on reactor design, and Chapter 11, “Recovery and Purification of Products,” details how to recover products from these reactors. These chapters provide an understanding of how real bioprocesses can be assembled.
An important decision for constructing any process concerns the configuration the reactor system should take. The choice of reactor and operating strategy determines product concentration, number and types of impurities, degree of substrate conversion, yields, and whether sustainable, reliable performance can be achieved. Unlike many traditional chemical processes, the reactor section represents a major component (usually >50%) of the total capital expenditures. Choices at the reactor level and of the biocatalyst determine the difficulty of the separation. Thus, our choice of reactor must be made in the context of the total process: biocatalyst, reactor, and separation and purification train.
9.1. Choosing the Cultivation Method
One of the first decisions is whether to use a batch or continuous cultivation scheme. Although a simple batch and continuous-flow stirred-tank reactor (CFSTR) represent extremes (we will soon learn about other reactors with intermediate characteristics), consideration of these two extreme alternatives will clarify some important issues in reactor selection.
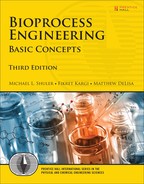
First, we can consider productivity. The simplest case is for the production of cell mass or a primary product. For a batch reactor, four distinct phases are present: lag phase, exponential growth phase, harvesting, and preparation for a new batch (e.g., cleaning, sterilizing, and filling). Let us define tl as the sum of the times required for the lag phase, harvesting, and preparation. The value for tl will vary with size of the equipment and the nature of the fermentation but is normally in the range of several hours (3 to 10 h). Thus, the total time to complete a batch cycle (tc) is
where Xm is the maximal attainable cell concentration and X0 is the cell concentration at inoculation.
The total amount of cell mass produced comes from knowing the total amount of growth-extent-limiting nutrient present and its yield coefficient:
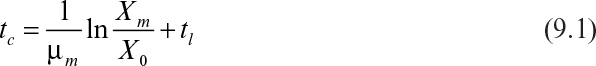
The rate of cell mass production in one batch cycle (rb) is
As discussed in Chapter 6, “How Cells Grow,” the maximum productivity of a chemostat is found by differentiating DX with respect to D and setting dDX/dD to zero. The value for D optimal when simple Monod kinetics apply is given by equation 6.90, and the corresponding X can be determined to be
Thus, the best productivity that could be expected from a chemostat where Monod kinetics apply is Dopt · Xopt:

Under normal circumstances, S0 >> Ks, so the rate of chemostat biomass production, rc, is approximately
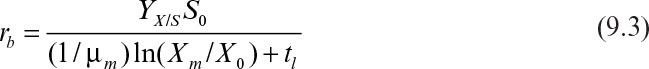
The ratio for rates of biomass formation is
Most commercial fermentations operate with Xm/X0 ≈ 10 to 20. Thus, we would expect continuous systems to always have a significant productivity advantage for primary products. For example, an E. coli fermentation with Xm/X0 = 20, tl = 5 h, and μm = 1.0 h–1 would yield rc,opt/rb = 8.
Based on this productivity advantage, we might be surprised to learn that most commercial bioprocesses are batch systems. Why? There are several answers.
The first is that equation 9.7 applies only to growth-associated products. Many secondary products are not made by growing cells; growth represses product formation. Under such circumstances, product is made only at very low dilution rates, far below those values optimal for biomass formation. For secondary products, the productivity in a batch reactor may significantly exceed that in a simple chemostat.
Another primary reason for the choice of batch systems over chemostats is genetic instability. The biocatalyst in most bioprocesses has undergone extensive selection. These highly “bred” organisms often grow less well than the parental strain. A chemostat imposes strong selection pressure for the most rapidly growing cell. Back-mutation from the productive specialized strain to one similar to the less productive parental strain (i.e., a genetic revertant) is always present. In a chemostat, the less productive variant will become dominant, decreasing productivity. In a batch culture, the number of generations available (<25 from slant cultures to a commercial-scale fermenter) for the revertant cell to outgrow the more productive strain is more limited. Cells at the end of the batch are not reused. These considerations of genetic stability are very important for cells with recombinant DNA and are discussed in detail in Chapter 14, “Utilizing Genetically Engineered Organisms.”
Another consideration is operability and reliability. Batch cultures can experience great variability from one run to another. Variations in product quality and concentration create problems in downstream processing and are undesirable. However, long-term continuous culture can be problematic; pumps may break, controllers may fail, and so on. Maintenance of sterility (absence of detectable foreign organisms) can be difficult to achieve for periods of months, and the consequences of a loss of sterility are more severe than with batch culture.
One other factor determining reactor choice is market economics. A continuous system forms the basis of a dedicated processing system—dedicated to a single product. Many fermentation products are required in small amounts, and demand is difficult to project. Batch systems provide much greater flexibility. For example, the same reactor can be used for two months to make product A and then for the next three for product B and the rest of the year for product C.
Most bioprocesses, particularly biopharmaceuticals, are based on batch reactors. Continuous systems are used to make single-cell protein, and modified forms of continuous culture are used in waste treatment; in ethanol production; and for some other large-volume, growth-associated products such as lactic acid. Because of the interest in the use of renewable resources for large-scale chemical and energy production using biological processes, it may be anticipated that large-scale continuous systems are poised for increased development. With indications of a more flexible attitude on potential approval of continuous processes by the FDA and increasing competition from generics, pharmaceutical companies are actively considering continuous production. Several pharmaceutical companies have continuous manufacturing facilities scheduled to go on line before 2018.
Let us consider some modifications to these reactor modes.
9.2. Modifying Batch and Continuous Reactors
Practical considerations require the use of reactor schemes that differ from the standard batch reactor or chemostat. These considerations typically seek to minimize total reactor volume and/or maximize product titer (or concentration) so as to reduce reactor cost per unit of product. These considerations are particularly important when the product is not growth associated.
9.2.1. Chemostat with Recycle
Microbial conversions are autocatalytic, and the rate of conversion increases with cell concentration. To keep the cell concentration higher than the normal steady-state level in a chemostat, cells in the effluent can be recycled back to the reactor. Cell recycle increases the rate of conversion (or volumetric productivity) and also increases the stability of some systems (e.g., wastewater treatment) by minimizing the effects of process perturbation. Cells in the effluent stream are either centrifuged, filtered, or settled in a conical tank for recycling. Since part of the cells are recycled back to the reactor, the cells (or solids) retention time (SRT) is much larger than the hydraulic residence time (HRT) of the nutrient medium. The life span of a typical bacterial cell is around 3 to 4 days. That is, when the cells remain in a system used for waste treatment for a longer period than their life span, the system may contain a significant fraction of dead cells.
For this reason, part of the cells should be removed from the system to keep the SRT at a desired level that favors an active and young microbial population in the system. Cells can be removed from the system either from the reactor or from the cell recycle stream.
Consider the chemostat system with cell recycle and solids (cells) removal from the reactor as depicted in Figure 9.1. A material balance on biomass (cell) concentration around the reactor yields
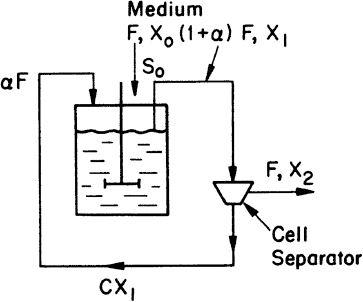
Figure 9.1. Chemostat with cell recycle. The cell separator could be a sedimentation tank, a centrifuge, or a microfiltration device.

where α is the recycle ratio based on volumetric flow rates, C is the concentration factor or ratio of cell concentration in the cell recycle stream to the cell concentration in the reactor effluent, F is nutrient flow rate, V is culture volume, X0 and X1 are cell concentrations in feed and recycle streams, and X2 is cell concentration in effluent from the cell separator.
At steady state, and if dX1/dt = 0 and X0 = 0 (i.e., sterile feed), then equation 9.8 becomes
Since C > 1 and α(1 – C) < 0, then μnet < D. That is, a chemostat can be operated at dilution rates higher than the specific growth rate when cell recycle is used. This allows a higher cell density to be achieved, which reduces required reactor size and is beneficial for products that are not strictly growth associated. In the case of wastewater treatment, cell recycle encourages endogenous metabolism, reducing the residual mass of cells that must be removed.
A material balance for growth-limiting substrate around the fermenter yields

At steady state, dS/dt = 0 and
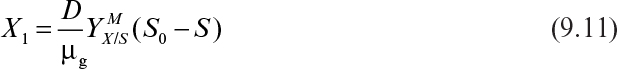
Substitution of equation 9.9, when kd = 0, into equation 9.11 yields
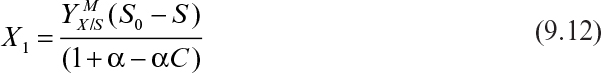
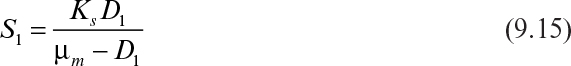
Therefore, the steady-state cell concentration in a chemostat is increased by a factor of 1/(1 + α – αC) by cell recycle. The substrate concentration in the effluent is determined from equation 9.9 and the Monod equation 6.32 (see Chapter 6), where endogenous metabolism is neglected:
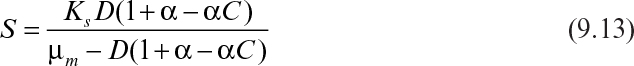
Then equation 9.12 becomes

Effluent cell concentrations and productivities in a chemostat with and without cell recycle are compared in Figure 9.2. Cell concentrations and volumetric productivities are higher with cell recycle, resulting in higher volumetric rates of substrate consumption. Systems with cell recycle are used extensively in waste treatment and are finding increasing use in ethanol production.
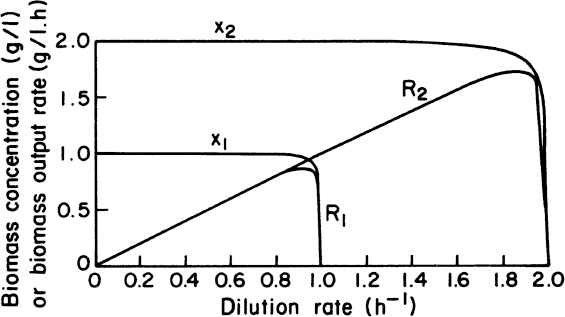
Figure 9.2. Comparison of biomass concentrations and volumetric production rates in steady states of chemostat cultures (kd = 0) with and without recycle. X1 = biomass concentration in chemostat without recycle; X2 = biomass concentration in chemostat culture with recycle; R1 = biomass output rate per unit volume without recycle; R2 = biomass output rate of chemostat with recycle; μm = 1.00 h–1; Sr = 2.0 g/l; KS = 0.010 g/l; YX/S = 0.5 g/g; concentration factor, C = 2.0; and recycle rate, α = 0.5.
The application of cell recycle reactors in waste treatment is detailed in Chapter 16, “Multiple Species in Culture,” and differs from this treatment in that the goal is minimization of cell mass and residual carbon source and not maximization of a secondary product. The equations in Chapter 16 differ from the previous case (equations 9.13 and 9.14) due to the inclusion of a nonzero term for endogenous metabolism (i.e., kd).
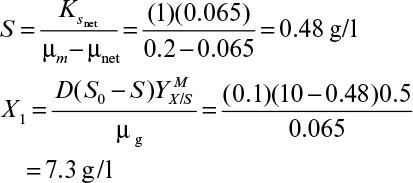
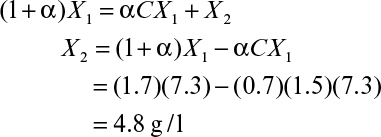
In a chemostat with cell recycle, as shown in Figure 9.1, the feed flow rate and culture volumes are F = 100 ml/h and V = 1000 ml, respectively. The system is operated under glucose limitation, and the yield coefficient, ![]() is 0.5 gdw cells/g substrate. Glucose concentration in the feed is S0 = 10 g glucose/l. The kinetic constants of the organisms are μm = 0.2 h–1, Ks = 1 g glucose/l. The value of C is 1.5, and the recycle ratio is α = 0.7. The system is at steady state.
is 0.5 gdw cells/g substrate. Glucose concentration in the feed is S0 = 10 g glucose/l. The kinetic constants of the organisms are μm = 0.2 h–1, Ks = 1 g glucose/l. The value of C is 1.5, and the recycle ratio is α = 0.7. The system is at steady state.
a. Find the substrate concentration in the recycle stream (S).
b. Find the specific growth rate (μnet) of the organisms.
c. Find the cell (biomass) concentration in the recycle stream.
d. Find the cell concentration in the centrifuge effluent (X2).

9.2.2. Multistage Chemostat Systems
In some fermentations, particularly for secondary metabolite production, the growth and product formation steps need to be separated, since optimal conditions for each step are different. Conditions such as temperature, pH, and limiting nutrients may be varied in each stage, resulting in different cell physiology and cellular products in multistage systems.
An example of a multistage system that may be beneficial is in the culture of genetically engineered cells. To improve genetic stability, a recombinant DNA plasmid usually uses an inducible promoter to control production of the target protein (see Chapter 8, “How Cellular Information Is Altered”). In the uninduced state, a plasmid-containing cell grows at nearly the same rate as a cell that loses the plasmid (a revertant), so the plasmid-free cell holds little growth advantage over the plasmid-containing cell. However, if the inducer is added, the plasmid-containing cells will make large quantities of the desired protein product but will have greatly reduced growth rates. Thus, a single-stage chemostat would not be suitable for the production of the target protein because of resulting problems in genetic stability. A multistage system can circumvent this problem. In the first stage, no inducer is added and the plasmid-containing cell can be maintained easily (usually an antibiotic is added to kill plasmid-free cells; see Chapter 14 for a more complete discussion). In the second stage, the inducer is added and large quantities of product are made. Cells defective in product synthesis should not overtake the culture (at least not completely), because fresh, genetically unaltered cells are being continuously fed to the reactor. Thus, the two-stage system permits stable continuous production of the target protein, which would otherwise be impossible in a simple chemostat.
Perhaps an easier situation to consider is the production of a secondary product (e.g., ethanol or an antibiotic). Here we worry not so much about a mixture of subpopulations but that conditions that promote growth completely repress product formation. Although commercial use of multistage continuous systems is limited, one very large-scale, five-stage system for ethanol production is currently in use. With renewed interest in production of biofuels, multistage continuous culture is poised for increased commercial utilization. A multistage system of CFSTR approaches plug flow reactor (PFR) behavior. A PFR mimics the batch system, where space time (the time it takes the culture fluid to reach a specific location in the PFR) replaces culture time. A multistage system is much like taking the batch growth curve and dividing it into sections, with each section being “frozen” in a corresponding stage of the multistage system. As in the batch reactor, the culture’s physiological state progresses from one stage to the next.
The mathematical analysis of the multistage system that we present here is imperfect. Growth in the second and subsequent stages is intrinsically unbalanced growth, even though it is steady-state growth. New cells entering the second or subsequent stage are continuously adapting to the new conditions in that stage. Consequently, unstructured models are not expected to give completely accurate predictions. However, we use unstructured models here because of their simplicity and to illustrate at least some aspects of multistage systems.
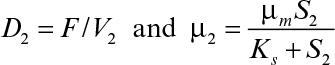
A two-stage chemostat system is depicted in Figure 9.3. Biomass and substrate balances on the first stage yield the following equations (ignoring endogenous metabolism):
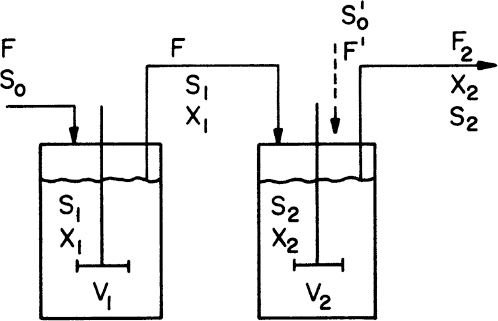
The biomass balance for the second stage is

At steady state, equation 9.17 becomes
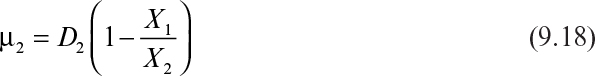
where X1/X2 < 1 and μ2 < D2.
Following is the substrate balance for the limiting substrate in the second stage:
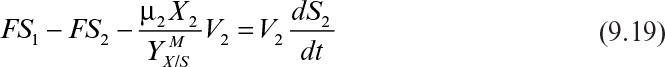
At steady state, equation 9.19 becomes
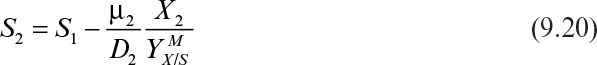
where
Equations 9.18 and 9.20 can be solved simultaneously for X2 and S2 by substituting μ2 = μmS2/(Ks + S2) in both equations or any other functional form that describes μ2.
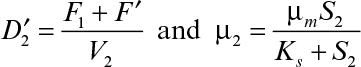
When a feed stream is added to the second stage, the design equations change. The second feed stream may contain additional nutrients, inducers, hormones, or inhibitors. Biomass balance for the second stage in this case is

At steady state, when X′ = 0, equation 9.21 becomes

where
Substrate balance for the second stage yields

Equations 9.22 and 9.23 need to be solved simultaneously for X2 and S2.
We can generalize these equations for a system with no additional streams added to second or subsequent units. If we do a balance around the nth stage on biomass, substrate, and product, we find
or


or

or
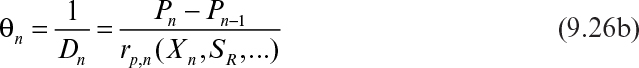
where Dn = F/Vn, θn is the mean residence time in the nth stage, and rx,n, rs,n, and rp,n all represent rates of reaction in the nth stage.
The preceding set of equations lends itself to machine calculations. However, graphical approaches to multistage design can also be used and have the advantage that the functional form of the growth or production rate need not be known. All that is required is a batch growth curve. However, the transfer of the information from batch growth curve to predictions of the multistage system still requires the assumption of balanced growth. Hence, the analysis must be used with caution. In at least one case (the production of spores by Bacillus), this approach has made experimentally verifiable predictions of the performance of a six-stage system.
The graphical approaches make use of equations 9.24 to 9.26. One approach is to use a plot of 1/(dX/dt) versus X or 1/(dP/dt) versus P derived from batch growth curves. This corresponds to using equations 9.24b and 9.26b. The size of the required reactor is determined by the area of the rectangle described with sides Xn – Xn–1 and 1/(dX/dt) or Pn – Pn–1 and 1/(dP/dt). The area of the rectangle is θ, and if F is known, V can be calculated. An alternative approach avoids some trial-and-error solutions that are necessary with the first approach. This second approach requires plots of dX/dt versus X and dP/dt versus P. The intersection of the reaction curve with a line from the mass balance equation (e.g., equation 9.24a) determines the exit concentration of X or P, while the slope of the line determines D, and if F is known, V can be found. We illustrate the use of these approaches in Example 9.2.
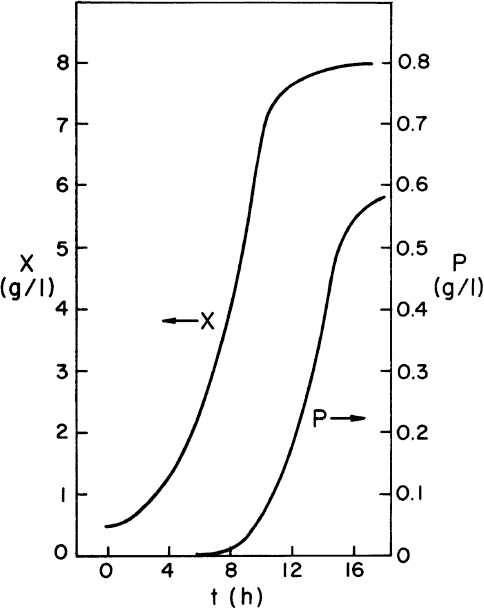
Figure 9.4. Data for Example 9.2. Data are for the production of a secondary product in batch culture.
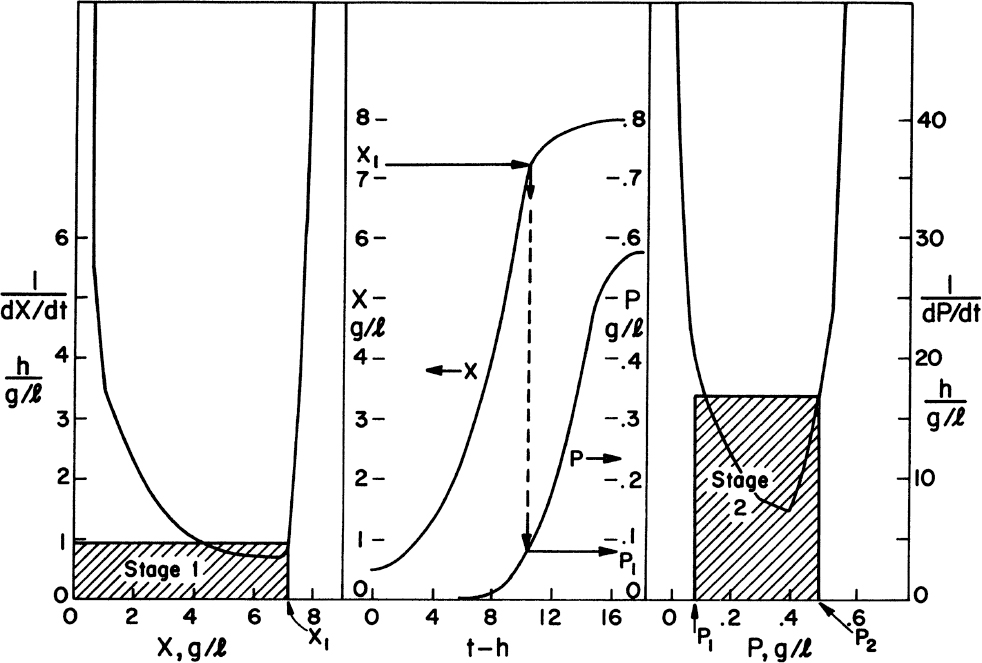
Figure 9.5. Solution of Example 9.2 for two-stage system, each with θ = 7 h.


Figure 9.6. Solution of Example 9.2 with a single stage, where θ = 14 h.
7.35 g/l·1.9 h/g/l = 13.97 h ≈ 14h
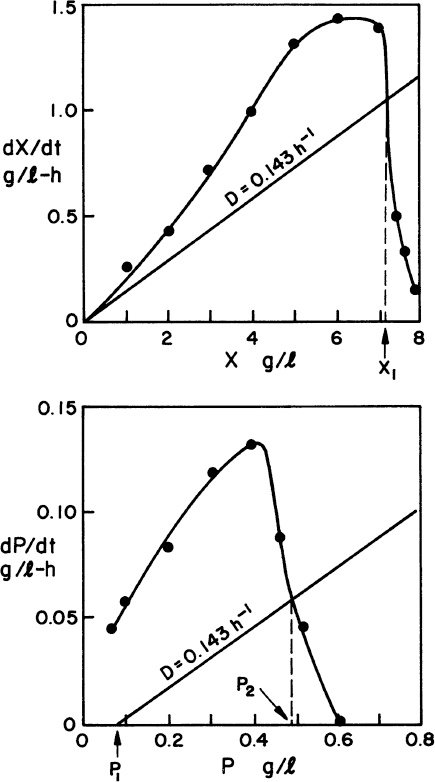
Figure 9.7. Solution to Example 9.2 using alternative graphical approach.
9.2.3. Fed-Batch Operation
Because of inefficient use of substrate, buildup of metabolic waste products, and catabolic repression, normal batch culture usually restricts the cell density and product concentration (or titer). A fed-batch reactor can circumvent these limitations and allow a high cell density to be realized along with high product concentration, which usually facilitates product recovery. Additionally, a fed-batch system works particularly well when high concentrations of the substrate become toxic or the substrate has low solubility. Further, the system is well adapted for products that are not growth associated. The obvious disadvantage is that the growth rate in a fed-batch system is somewhat lower than in batch. Generally, the advantages outweigh disadvantages and fed-batch systems are often chosen for commercial operation.
In fed-batch culture, nutrients are continuously or semicontinuously fed, while effluent is removed discontinuously (Figure 9.8). Operation is initially batchwise with a small volume. After most of the substrate is consumed, a concentrated feed stream is introduced at a rate that allows substrate availability to match the desired growth rate of the cells. Fed-batch culture is usually used to adjust metabolic rates and to overcome substrate inhibition or catabolite repression by controlled feeding of the substrate. If the substrate is inhibitory, controlled addition of the substrate improves the productivity of the fermentation by maintaining a low substrate concentration. Fed-batch operation is also called semicontinuous or variable-volume continuous culture.

Consider a batch culture where the concentration of biomass at a certain time is given by
where S0 is the initial substrate concentration, ![]() is the yield coefficient, and X0 is the initial biomass concentration. This equation assumes no endogenous metabolism (kd = 0). This assumption is satisfactory if the fed-batch system is operated at growth rates slightly reduced from the maximum values (say 80% of μm) and for production of pharmaceuticals such growth rates would typically be used.
is the yield coefficient, and X0 is the initial biomass concentration. This equation assumes no endogenous metabolism (kd = 0). This assumption is satisfactory if the fed-batch system is operated at growth rates slightly reduced from the maximum values (say 80% of μm) and for production of pharmaceuticals such growth rates would typically be used.
When biomass concentration reaches its maximum value (Xm), the substrate concentration is very low, S << S0, and also X0 << X. That is, ![]() . Suppose that at
. Suppose that at ![]() , a nutrient feed is started at a flow rate F with the substrate concentration S0. The total amount of biomass in the vessel is Xt = VX, where V is the culture volume at time t. The rate of increase in culture volume is
, a nutrient feed is started at a flow rate F with the substrate concentration S0. The total amount of biomass in the vessel is Xt = VX, where V is the culture volume at time t. The rate of increase in culture volume is

Integration of equation 9.28 yields
were V0 is the initial culture volume (l).
The biomass concentration in the vessel at any time t is
The rate of change in biomass concentration is

Since dXt/dt = μnetXt, dV/dt = F, and F/V = D, equation 9.31 becomes

When the substrate is totally consumed (or substrate concentration is negligible as compared to S0), S ≈ 0, and if kd = 0, then ![]() Furthermore, since nearly all the substrate in a unit volume is consumed, then dX/dt = 0. This is an example of a quasi-steady state. A fed-batch system operates at quasi-steady state when nutrient consumption rate is nearly equal to nutrient feed rate. Note that achieving such operation can be challenging in practice but is possible with feedback control of substrate concentration and intermittent addition of the feed. Since dX/dt = 0 at quasi-steady state, then
Furthermore, since nearly all the substrate in a unit volume is consumed, then dX/dt = 0. This is an example of a quasi-steady state. A fed-batch system operates at quasi-steady state when nutrient consumption rate is nearly equal to nutrient feed rate. Note that achieving such operation can be challenging in practice but is possible with feedback control of substrate concentration and intermittent addition of the feed. Since dX/dt = 0 at quasi-steady state, then
If maintenance energy can be neglected,
then

The balance on the rate-limiting substrate without maintenance energy (kd → 0) is
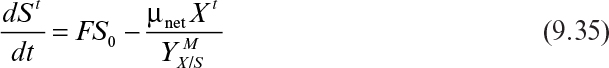
where St is the total amount of the rate-limiting substrate in the culture and S0 is the concentration of substrate in the feed stream. The assumption of kd → 0 may become problematic if the feed rate of substrate is too slow, resulting in a value of μg much less than μm.
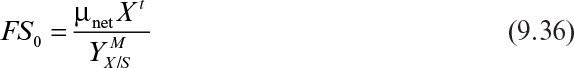
At quasi-steady state, Xt = VXm and the residual substrate is much less than S0, so no significant level of substrate can accumulate. Therefore, we get
Also, differentiating X′ = VXm at quasi-steady state with Xm being constant yields

Integration of equation 9.37 from t = 0 to t with the initial amount of biomass in the reactor being ![]() yields
yields
That is, the total amount of cells in the culture increases linearly with time (which is experimentally observed) in a fed-batch culture. Dilution rate, and therefore μnet, decrease with time in a fed-batch culture. Since μnet = D at quasi-steady state (if kd = 0), the growth rate is controlled by the dilution rate. The use of unstructured models is an approximation, since μnet is a function of time.
Product profiles in a fed-batch culture can be obtained by using the definitions of YP/S or qP. When the product yield coefficient YP/S is constant, at quasi-steady state with S << S0,
or the potential product output is
When the specific rate of product formation qP is constant,
where Pt is the total amount of product in culture.
Substituting Xt = (V0 + Ft)Xm into equation 9.41 gives

Integration of equation 9.42 results in

In terms of product concentration, equation 9.43 can be written as

Figure 9.9 depicts the variation of V, μ(= D), X, S, and P with time at quasi-steady state in a single cycle of a fed-batch culture.

Figure 9.9. (a) Variation of culture volume (V), specific growth rate (μ), cell (X), and substrate (S) concentration with time at quasi-steady state. (b) Variation of product (P) concentration with time at quasi-steady state in a single cycle of a fed-batch culture.
In some fed-batch operations, part of the culture volume is removed at certain intervals, since the reactor volume is limited. This operation is called the repeated fed-batch culture. The culture volume and dilution rate (= μnet) undergo cyclical variations in this operation.
If the cycle time tw is constant and the system is always at quasi-steady state, then the product concentration at the end of each cycle is given by

where Dw = F/Vw, Vw is the culture volume at the end of each cycle, V0 is the residual culture volume after removal, γ is the fraction of culture volume remaining at each cycle (= V0/Vw), and tw is the cycle time.
The cycle time is defined as

Substitution of equation 9.46 into equation 9.45 results in
For cases where product formation is not growth associated, it may have a more complicated response than the two limiting cases considered here. Further, it may not always be possible to match the consumption rate, and the resulting S may be sufficiently large to be measurable and possibly variable. An example of fed-batch culture is its use in some antibiotic fermentations, where a glucose solution is intermittently added to the fermentation broth to avoid the repression of pathways for the production of secondary metabolites caused by high initial glucose concentrations. The fed-batch method can be applied to other secondary metabolite fermentations such as lactic acid and other plant cell and mammalian cell fermentations, where the rate of product formation is maximal at low nutrient concentrations.
Fed-batch culture is important for Escherichia coli fermentations in which protein products are made from recombinant DNA technology. To make a high concentration of product, it is desirable to grow the culture to very high cell density before inducing production of the target protein. If E. coli has an unlimited supply of glucose, it will grow at a maximal rate but produce organic acids (e.g., acetic acid) as by-products. The accumulation of these by-products inhibits growth. If glucose is fed at a rate that maintains the growth rate at a level slightly less than maximal, E. coli will use the glucose more efficiently, making less inhibitory by-product. When these issues are accounted for, very high cell densities (50 to 100 g/l) can be achieved. Fed-batch culture may further benefit from active process control. For example, the feed rate of glucose can be controlled by measuring glucose concentration in the medium, the CO2 evolution rate using a feedback controller, or control of pH.
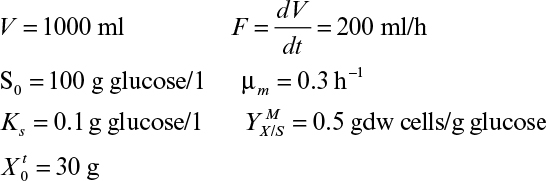
a. Find V0 (the initial volume of the culture).
b. Determine the concentration of growth-limiting substrate in the vessel at quasi-steady state.
c. Determine the concentration and total amount of biomass in the vessel at t = 2 h (at quasi-steady state).
d. If qP = 0.2 g product/g cells, P0 = 0, determine the concentration of product in the vessel at t = 2 h.
a. 
b. 
c. 
d. 
9.2.4. Perfusion Systems
An alternative to fed-batch culture is a perfusion system. Such systems are used most often with animal cell cultures (see Chapter 12, “Bioprocess Considerations in Using Animal Cell Cultures”) particularly for production of monoclonal antibodies. Sustained operation over several weeks to months is possible. The basic characteristic is constant medium flow, cell retention, and in some cases selective removal of dead cells. High cell density can be achieved. Cell retention is usually achieved by membranes, screens, or a centrifuge capable of selective cell removal. When a membrane is used, the system has characteristics of an immobilized cell system (see Section 9.3) except that the cells are usually maintained in suspension and mixed. With a selective removal/recycle, the system approaches the cell recycle reactor discussed earlier in this chapter. Figure 9.10 depicts one type of perfusion system. In some cases, due to differences in density or aggregation, the cell separator (e.g., centrifugation) can selectively recycle live cells and send cell debris to waste. When the cells aggregate, as is common in waste treatment, an internal or external gravity sedimentation unit is utilized.
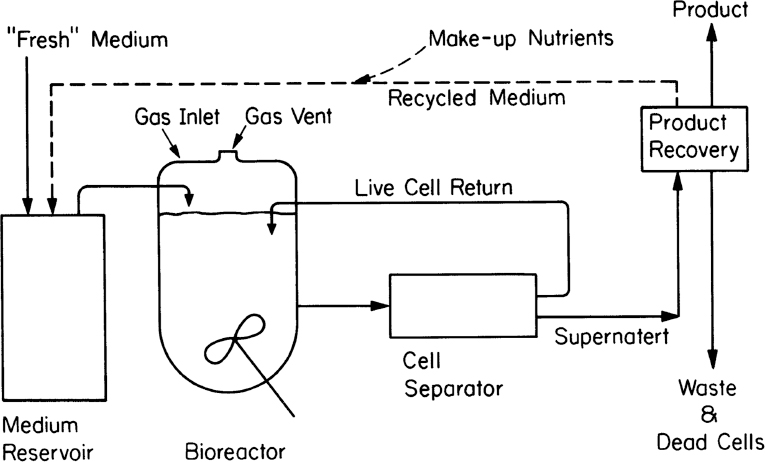
Figure 9.10. Schematic of a perfusion system with external centrifugation and return of cells. Internal retention of cells is also possible. Return of spent medium is optional.
The potential advantages of a perfusion system is removal of cell debris and inhibitory by-products, removal of enzymes released by dead cells that may destroy product, shorter exposure time of product to potentially harsh production conditions (compared to batch or fed-batch operation), high per-unit volumetric productivity (due to high cell density and metabolism), and a rather constant environment.
The primary disadvantage is that a large amount of medium is typically used and the nutrients in the medium are less completely utilized than in batch or fed-batch systems. High medium usage is expensive, owing not only to the high cost of raw materials but also to the costs to prepare and sterilize the medium. Additionally, costs for waste treatment increase due to larger liquid volumes. Typically, the bioprocess engineer must consider the trade-off of improved product quality and reactor productivity with the extra costs associated with a more complex reactor system (membranes, pumps, centrifugal separator, etc.) and increased medium usage. The best choice depends on the specific situation.
9.2.5. Membrane Bioreactors
Membrane bioreactors are usually used for simultaneous product or cell separations from the fermentation media and also for controlled substrate supply to the biotic phase:
• Membrane bioreactors for cell separations: This type of membrane reactor is usually used in wastewater treatment. The membrane cartridge is placed inside the aeration tank where biological wastewater treatment takes place. Wastewater diffuses inside the membrane cartridge and is removed as treated water with the aid of a pump. The biomass remains inside the aeration tank and is removed in desired amounts to adjust the mean residence time of cells in the bioreactor. The membrane system acts in place of a sedimentation tank, providing much more efficient solid–liquid separation. Like a sedimentation tank, a membrane unit may be placed after the aeration tank, where the separated solids are recycled back to the reactor and the clean wastewater is removed as the filtrate. Planar or spiral membrane configurations may be used. Membrane fouling is a major problem, reducing the performance of the membrane. Fouling can be partly eliminated by vigorous agitation and aeration in the aeration tank or by periodic back washing. Usually, microfilters or ultrafilters with pore sizes smaller than 1 μm are used for cell separation purposes.
• Membrane bioreactors for product removal: Product inhibition is a widely encountered phenomena in biological processing. Simultaneous removal of products during fermentation is widely used in eliminating product inhibition. Membrane separation is one of the methods used for simultaneous product removal to reduce product inhibition. Usually, ultrafiltration or dialysis membranes are used to remove products from fermentation media. Ethanol, acetone–butanol fermentations, and animal cell cultures (lactate and ammonium) produce some inhibitory products, which can be removed by using proper membranes. Some of those membranes are also used for cell separation along with product removal. Again, membranes can be placed inside or outside the reactors and should be cleaned periodically. Crossflow membrane operations may be used to partially overcome membrane fouling.
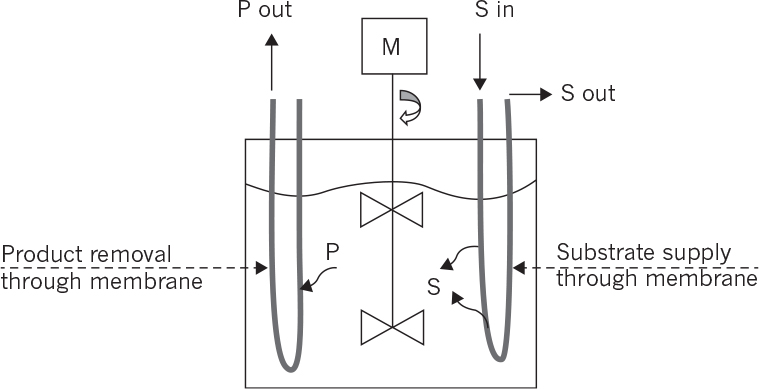
• Membrane bioreactors for controlled supply of substrate: Substrate supply rate to the fermentation media is one of the key factors affecting the metabolic rate. To avoid substrate inhibition due to high substrate concentrations, biotic and abiotic phases can be separated by a membrane whereby the substrate is slowly provided to the biotic phase and the products are removed simultaneously. Hollow-fiber tubular membrane cartridges can be used for this purpose where the nutrient solution passes through the tube side while the cells are immobilized on the shell side.
The following configurations are available for membrane bioreactors:
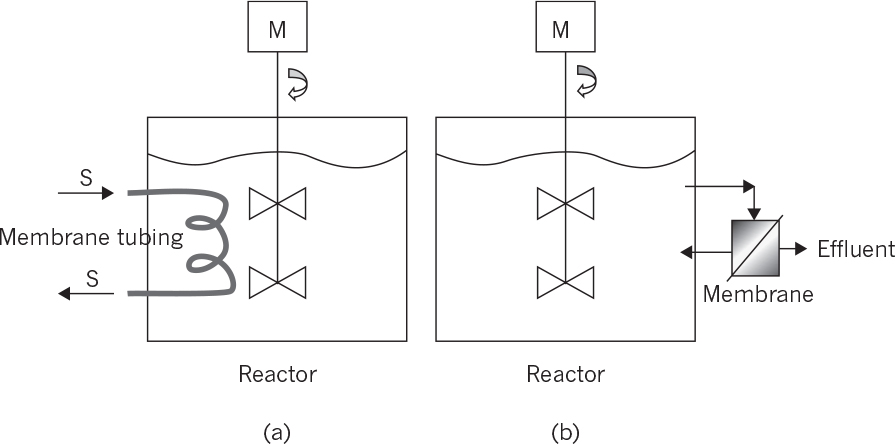
• Internal membrane bioreactors: Membranes are placed inside the reactor where cell or product separations take place. The filtrate is continuously removed from the other side of the membrane. Planar membrane cartridges or coiled tube membranes can be used for this purpose. Membrane surface area and hydrodynamical conditions are the most important parameters affecting the performance of the membranes.
• External membrane bioreactors: The membrane unit is placed outside the reactor where the reactor effluent is fed to the membrane unit for cell or product separation. A vacuum may be applied to the filtrate side of the membrane to facilitate the separation. The filtrate-containing product is sent to the recovery operations, and the liquid phase containing a high density of cells can be partially recycled back to the reactor.
Figure 9.11 depicts internal and external membrane reactor configurations.
In membrane bioreactors used for controlled substrate supply and simultaneous product removal, biological reaction rate in the bioreactor is limited by the rate of substrate transfer through the membrane. For the reactor configuration shown in Figure 9.12, cells convert substrate, S, into more cells, X, and product, P.
The rate of change in the rate-limiting substrate concentration for batch operation can be written as
Following is the rate of change in the product concentration in the reactor:
Finally, the rate of change in the biomass concentration is
In equations 9.48, 9.49, and 9.50, KM is the substrate mass transfer coefficient through the membrane; a is the membrane surface area per unit reaction volume (Am/V); So and S are the substrate concentrations in the feed reservoir and the reactor; μm is the maximum specific growth rate; Ks is the saturation constant; X is the biomass concentration in the reactor; ![]() is the maximum growth yield coefficient; k is the maximum substrate consumption rate constant (μm/
is the maximum growth yield coefficient; k is the maximum substrate consumption rate constant (μm/![]() ); Yp/x is the product yield constant; K′M is the product mass transfer coefficient through the membrane; qpm is the maximum specific product formation rate (Yp/x μm); P and Pe are the product concentrations in the reactor and in the effluent tank; and kd is the death rate constant for the biomass in the reactor. kd is often neglected for operations lasting less than 3 days.
); Yp/x is the product yield constant; K′M is the product mass transfer coefficient through the membrane; qpm is the maximum specific product formation rate (Yp/x μm); P and Pe are the product concentrations in the reactor and in the effluent tank; and kd is the death rate constant for the biomass in the reactor. kd is often neglected for operations lasting less than 3 days.
In batch operation of such a membrane bioreactor, equations 9.48, 9.49 and 9.50 need to be solved simultaneously to obtain variations of the biomass, substrate, and product concentrations with time. The system never reaches steady state during batch operation. However, when the bioconversion rate is limited by the rate of substrate transfer, the substrate concentration in the reactor becomes very low and measurable fluctuations become small. In this case, we can assume dS/dt = 0 and dP/dt = 0.
Then equations 9.48 and 9.49 take the following forms when substrate transfer through the membrane is the rate-limiting (i.e., the slowest) step:
Since we assume dS/dt = 0 and a constant yield coefficient, the biomass concentration must be constant in the reactor and equations 9.51 and 9.52 can be solved to determine the substrate and the product concentrations in the reactor.
In case of severe substrate transfer limitations where S << So (negligible S), the bioconversion rate can be approximated to first-order kinetics, and the rates of substrate transfer and consumption (RST) can be written as follows:
Following are the rate of product formation (RPF) and transfer:
Equations 9.53 and 9.54 are used to determine the substrate and product concentrations in the reactor in the case of severe membrane transfer limitations.
9.3. Immobilized cell Systems
Immobilization of cells as biocatalysts is a strategy much like enzyme immobilization. Immobilization is the restriction of cell mobility within a defined space. Immobilized cell cultures have the following potential advantages over suspension cultures:
• Immobilization provides high cell concentrations.
• Immobilization provides cell reuse and eliminates the costly processes of cell recovery and cell recycle.
• Immobilization eliminates cell washout problems at high dilution rates.
• The combination of high cell concentrations and high flow rates (no washout restrictions) allows high volumetric productivities.
• Immobilization may also provide favorable microenvironmental conditions (i.e., cell–cell contact, nutrient product gradients, pH gradients) for cells, resulting in better performance of the biocatalysts (e.g., higher product yields and rates).
• In some cases, immobilization improves genetic stability.
• For some cells, protection against shear damage is important.
The major limitation of immobilization is that the product of interest should be excreted by the cells. A further complication is that immobilization often leads to systems for which diffusional limitations are important. In such cases, the control of microenvironmental conditions is difficult, owing to the resulting heterogeneity in the system. With living cells, growth and gas evolution present significant problems in some systems and can lead to significant mechanical disruption of the immobilizing matrix.
In Chapter 3, “Enzymes,” we discussed enzyme immobilization. Figure 3.16 provides a useful summary of immobilization strategies. Many of the ideas in enzyme immobilization have a direct counterpart in whole cell immobilization. However, the maintenance of a living cell in such a system is more complex than maintaining enzymatic activity. The primary advantage of immobilized cells over immobilized enzymes is that immobilized cells can perform multistep, cofactor-requiring, biosynthetic reactions that are not practical using purified enzyme preparations.

9.3.1. Active Immobilization of Cells
Active immobilization is entrapment or binding of cells by physical or chemical forces. The two major methods of active immobilization are entrapment and binding.
Physical entrapment within porous matrices is the most widely used method of cell immobilization. Various matrices can be used for the immobilization of cells. Among these are porous polymers (e.g., agar, alginate, κ-carrageenan, polyacrylamide, chitosan, gelatin, collagen), porous metal screens, polyurethane, silica gel, polystyrene, and cellulose triacetate.
Polymer beads should be porous enough to allow the transport of substrates and products in and out of the bead. They are usually formed in the presence of cells and can be prepared by one of the following methods:
• Gelation of polymers: Gelatin and agar beads may be prepared by mixing the liquid form of these polymers with cell suspensions and using a template to form beads. Reduction of temperature in the templates causes solidification of the polymers with the cells entrapped. Gel beads are usually soft and mechanically fragile. However, we can use a hard core (i.e., glass, plastic) and a soft gelatin shell with entrapped cells to overcome some mechanical problems associated with polymer beads. Because of diffusional limitations, the inner core of such beads is often not active, so this approach does not necessarily decrease the amount of product made per bead.
• Precipitation of polymers: Cells are dispersed in a polymer solution. The polymer can be precipitated by changing the pH or the solvent entrapping cells. The starting solution of the polymer has to be prepared with an organic solvent or a water–solvent mixture. Ethanol and acetone are examples of water-miscible solvents. Polymers used for this purpose are polystyrene, cellulose triacetate, and collagen. The direct contact of cells with solvents may cause inactivation and even death of cells.
• Ion-exchange gelation: Ion-exchange gelation takes place when a water-soluble polyelectrolyte is mixed with a salt solution. Solidification occurs when the polyelectrolyte reacts with the salt solution to form a solid gel. The most popular example of this kind of gelation is the formation of Ca-alginate gel by mixing Na-alginate solution with a solution of CaCl2. Some other polymers obtained by ion-exchange gelation are Al-alginate, Ca/Al carboxymethyl cellulose, Mg pectinate, κ-carrageenan, and chitosan polyphosphate. Alginate and κ-carrageenan are the most widely used polymers for cell-immobilization purposes. Ionic gels can be further stabilized by covalent cross-linking.
• Polycondensation: Epoxy resins are prepared by polycondensation and can be used for cell immobilization. Polycondensation produces covalent networks with high chemical and mechanical stability. Usually, liquid precursors are cured with a multifunctional component. Functional groups usually are hydroxy, amino, epoxy, and isocyanate groups. Some examples of polymer networks obtained by polycondensation are epoxy, polyurethane, silica gel, gelatin–glutaraldehyde, albumin–glutaraldehyde, and collagen–glutaraldehyde. Severe reaction conditions (e.g., high temperature, low or high pH values) and toxic functional groups may adversely affect the activity of cells.
• Polymerization: Polymeric networks can be prepared by cross-linking copolymers of a vinyl group containing monomers. Polyacrylamide beads are the most widely used polymer beads, prepared by copolymerization of acrylamide and bisacrylamide. Several different monomers can be used for polymer formation; acrylamide, methacrylamide, and 2-hydroxyethyl methacrylate are the most widely used. Cross-linking is usually initiated by copolymerization with a divinyl compound, such as methylenebis–acrylamide.
• Three-dimensional printing: The use of three-dimensional (3D) printing of living cells is a rapidly developing technology. A 3D cell printer (effectively a type of industrial robot) utilizes the same basic approach used for ink jet printers. While common ink jet printers are two dimensional, it is possible to print in 3D through an additive process in which an object is built up, layer upon layer. In 3D bioprinting, the “ink” is a mixture of living cells in a biocompatible matrix material (usually a polymer that can be chemically or photo-cross-linked). The system is programmed to deposit a specific “ink” droplet in a predefined location. A 3D object is made by positioning of droplets, layer by layer, with great spatial control of placement. The droplets are small (on the order of 50 to 100 μm). Multiple “inks” can be used (as in a color printer) to build 3D structures with many cell types. An early example was the printing of a human ear as a replacement tissue. Techniques other than “ink jet” type printers, such as microextrusion and laser-assisted deposition, are also applied in 3D printing. While 3D printing has been applied primarily to mammalian cells and medical applications, it can serve to build useful models and systems for bioprocess and environmental engineering. For example, 3D printing can be used to build detailed, highly designable models to probe the interactions of microbial communities.
Immobilization by polymerization is a simple method. The polymerizing solution is mixed with the cell suspension, and polymerization takes place to form a polymeric block, which is pressed through a sieve plate to obtain regular-shaped particles. Suspension or emulsion polymerization can also be used to form polymeric beads for cell entrapment.
Encapsulation is another method of cell entrapment. Microcapsules are hollow, spherical particles bound by semipermeable membranes. Cells are entrapped within the hollow capsule volume. The transport of nutrients and products in and out of the capsule takes place through the capsule membrane. Microcapsules have certain advantages over gel beads. More cells can be packed per unit volume of support material into capsules, and intraparticle diffusion limitations are less severe in capsules due to the presence of liquid cell suspension in the intracapsule space. Various polymers can be used as capsule membranes. Among these are nylon, collodion, polystyrene, acrylate, polylysine–alginate hydrogel, cellulose acetate–ethyl cellulose, and polyester membranes. Different membranes (i.e., composition and molecular weight cutoff) may need to be used for different applications in order to retain some high-molecular-weight products inside capsules and provide passage to low-molecular-weight nutrients and products.
Another form of entrapment is the use of macroscopic membrane-based reactors, as detailed in Section 9.2.5. Several commercial reactors for animal cell cultivation use membrane entrapment.
In addition to entrapment or encapsulation, cells can be bound directly to a support. Immobilization of cells on the surface of a support material can be achieved by physical adsorption or covalent binding.
Adsorption of cells on inert support surfaces has been widely used for cell immobilization. The major advantage of immobilization by adsorption is direct contact between nutrient and support materials. High cell loadings can be obtained using microporous support materials. However, porous support materials may cause intraparticle pore diffusion limitations at high cell densities, as is also the case with polymer-entrapped cell systems. Also, the control of microenvironmental conditions is a problem with porous support materials. A ratio of pore to cell diameter of 4 to 5 is recommended for the immobilization of cells onto the inner surface of porous support particles. At small pore sizes, accessibility of the nutrient into inner surfaces of pores may be the limiting factor, whereas at large pore sizes, the specific surface area may be the limiting factor. Therefore, there may be an optimal pore size, resulting in the maximum rate of bioconversion.
Adsorption capacity and strength of binding are the two major factors that affect the selection of a suitable support material. Typical adsorption capacity can vary between 2 mg/g (porous silica) to 250 mg/g (wood chips). Porous glass carriers provide adsorption capacities (108 to 109 cells/g) that are less than or comparable to those of gel-entrapped cell concentrations (109 to 1011 cells/ml). The binding forces between the cell and support surfaces may vary, depending on the surface properties of the support material and the type of cells. Electrostatic forces are dominant when positively charged support surfaces (e.g., ion-exchange resins, gelatin) are used. Cells also adhere on negatively charged surfaces by covalent binding or H bonding. The adsorption of cells on neutral polymer support surfaces may be mediated by chemical bonding, such as covalent bonding, H bonds, or van der Waals forces. Some specific chelating agents may be used to develop stronger cell-surface interactions. Among the support materials used for cell adsorption are porous glass, porous silica, alumina, ceramics, gelatin, chitosan, activated carbon, wood chips, polypropylene ion-exchange resins (e.g., DEAE–Sephadex, carboxymethyl cellulose [CMC]), and Sepharose.
Adsorption is a simple, inexpensive method of cell immobilization. However, limited cell loadings and rather weak binding forces reduce the attractiveness of this method for microbial systems. Hydrodynamic shear around adsorbed cells should be very mild to avoid the removal of cells from support surfaces. With animal cells, well-defined porous materials, either ceramic or polymeric, have been used successfully both in bioprocess and medical applications. Animal cell attachment to surfaces with the correct chemistry can be quite strong. Entrapment in gels or within hollow microporous spheres can also be used with animal cells.
Covalent binding is the most widely used method for enzyme immobilization. However, it is not as widely used for cell immobilization. Functional groups on cell and support material surfaces are not usually suitable for covalent binding. Binding surfaces need to be specially treated with coupling agents (e.g., glutaraldehyde or carbodiimide) or reactive groups for covalent binding. These reactive groups may be toxic to cells. A number of inorganic carriers (e.g., metal oxides such as titanium and zirconium oxide) have been developed that provide satisfactory functional groups for covalent binding.
Covalent binding forces are stronger than adsorption forces, resulting in more stable binding. However, with growing cells, large numbers of cell progeny must be lost. Support materials with desired functional groups are rather limited. Among the support materials used for covalent binding are CMC plus carbodiimide; carriers with aldehyde, amine, epoxy, or halocarbonyl groups; Zr(IV) oxide; Ti(IV) oxide; and cellulose plus cyanuric chloride. Support materials with —OH groups are treated with CNBr, materials with —NH2 are treated with glutaraldehyde, and supports with COOH groups are treated with carbodiimide for covalent binding with protein groups on cell surfaces.
The direct cross-linking of cells by glutaraldehyde to form an insoluble aggregate is more like cell entrapment than binding. However, some cells may be cross-linked after adsorption onto support surfaces. Cross-linking by glutaraldehyde may adversely affect the cell’s metabolic activity and may also cause severe diffusion limitations. Physical cross-linking may also be provided by using polyelectrolytes, polymers such as chitosan, and salts [e.g., CaCl2,Al(OH)3,FeCl3]. Direct cross-linking is not widely used because of the aforementioned disadvantages.
A good support material should be rigid and chemically inert, should bind cells firmly, and should have high loading capacity. In the case of gel entrapment, gels should be porous enough and particle size should be small enough to avoid intraparticle diffusion limitations.
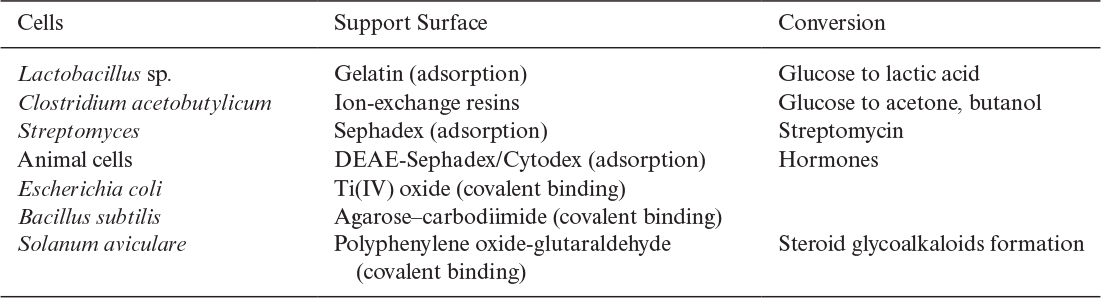
Some examples of cell immobilization by entrapment and by binding are summarized in Tables 9.1 and 9.2, respectively.

9.3.2. Passive Immobilization: Biological Films
Biological films are the multilayer growth of cells on solid support surfaces. The support material can be inert or biologically active. Biofilm formation is common in natural and industrial fermentation systems, such as biological wastewater treatment and mold fermentations. The interaction among cells and the binding forces between the cell and support material may be very complicated.
In mixed-culture microbial films, the presence of some polymer-producing organisms facilitates biofilm formation and enhances the stability of the biofilms. Microenvironmental conditions inside a thick biofilm vary with position and affect the physiology of the cells.
In a stagnant biological film, nutrients diffuse into the biofilm and products diffuse out into liquid nutrient medium. Nutrient and product profiles within the biofilm are important factors affecting cellular physiology and metabolism. A schematic of a biofilm is depicted in Figure 9.13. Biofilm cultures have almost the same advantages as those of the immobilized cell systems over suspension cultures, as listed in the previous section.
The thickness of a biofilm is an important factor affecting the performance of the biotic phase. Thin biofilms have low rates of conversion due to low biomass concentration, and thick biofilms may experience diffusionally limited growth, which may or may not be beneficial depending on the cellular system and objectives. Nutrient-depleted regions may also develop within the biofilm for thick biofilms. In many cases, an optimal biofilm thickness resulting in the maximum rate of bioconversion exists and can be determined. In some cases, growth under diffusion limitations may result in higher yields of products as a result of changes in cell physiology and cell–cell interactions. In this case, improvement in reaction stoichiometry (e.g., high yield) may overcome the reduction in reaction rate, and it may be more beneficial to operate the system under diffusion limitations. Usually, the most sparingly soluble nutrient, such as dissolved oxygen, is the rate-limiting nutrient within the biofilm. A typical variation of dissolved oxygen concentration within the biofilm is depicted in Figure 9.14.
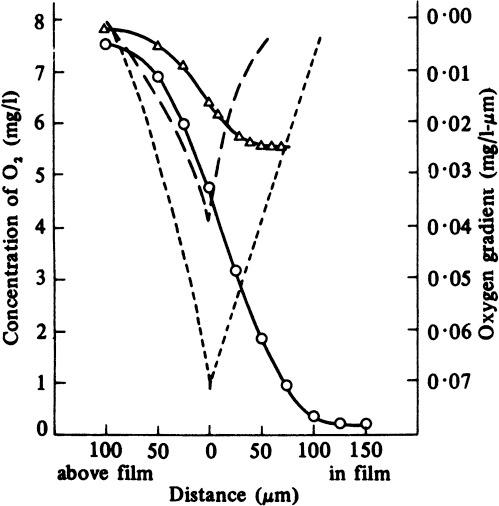
Figure 9.14. Dissolved-oxygen profiles and oxygen gradients in a microbial slime bathed in flowing medium: -Δ-Δ- oxygen profile for 20 ppm nutrient broth, 27.5°C; – – oxygen gradient for this profile; -O-O- oxygen profile for 500 ppm nutrient broth, 26°C; --- oxygen gradient for this profile. (With permission, from H. R. Bungay and others, Biotechnol. Bioeng. 11:765, 1969, John Wiley & Sons, Inc., New York.)
9.3.3. Diffusional Limitations in Immobilized Cell Systems
Immobilization of cells may cause extra diffusional limitations as compared to suspension cultures. The presence and significance of diffusional limitations depend on the relative rates of bioconversion and diffusion, which can be described by the Damköhler number (Da) (see equation 3.52 also):

Here rmax is the maximum rate of bioconversion (mg S/l-h), De is the effective diffusivity of the rate-limiting substrate, δ is the thickness of diffusion path (or liquid film), and S0 is the bulk substrate concentration in liquid phase. When the film-theory model applies, De/δ is the mass transfer coefficient (i.e., kL = De/δ).
If Da >> 1, the rate of bioconversion is diffusion limited; for Da << 1, the rate is limited by the rate of bioconversion; and for Da ≈ 1, the diffusion and bioreaction rates are comparable. It is desirable to keep Da < 1 to eliminate diffusion limitations when the productivity of a cell population does not improve upon immobilization due to cell–cell contact and nutrient gradients.
Diffusional limitations may be external (i.e., between fluid and support surface in adsorption and covalent binding), intraparticle (i.e., inside particles in entrapment, encapsulation, or immobilization in porous particles), or both. If the external mass transfer is limiting, an increase in liquid-phase turbulence should result in an increase in the reaction rate. In case of intraparticle mass-transfer limitations, a reduction in particle size or an increase in the porous void fraction of the support material should result in an increase in the rate of the bioreaction.
In Chapter 3, we discussed in reasonable detail a mathematical model of the interaction of diffusion and reaction for surface immobilized or entrapped biocatalysts. These models apply directly to immobilized cells when the kinetics of bioconversion are described by a Michaelis–Menten type of kinetic expression.
Another interesting case is to consider biofilms where we allow cell growth. Models for immobilized enzymes have no terms for biocatalyst replication, so this case presents a new problem.
The thickness of a biofilm or the size of microbial floc increases with time during the growth phase. A microbial floc is an aggregation of many cells, and in some processes these aggregates can be more than 1 mm in diameter. However, since the rate of increase in biofilm thickness is much slower than the rate of substrate uptake, the system can be assumed to be at quasi-steady state for relatively short periods. The simplest case is to assume that the system is at quasi-steady state and all the cells inside the biofilm are in the same physiological state. In this situation, we write a steady-state substrate balance within the biofilm by using average kinetic constants for the biotic phase (living cells).
A differential material balance for the rate-limiting substrate within the biofilm (see Figure 9.11) yields the following at steady state:
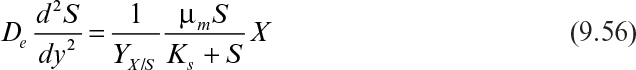
Here De is the effective diffusivity (cm2/S) and YX/S is the growth yield coefficient (g cells/g substrate).
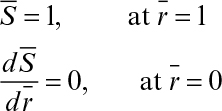
Following are the boundary conditions:
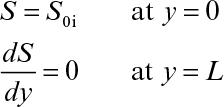
Here L is the thickness of biofilm.
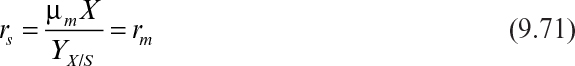
If it is also assumed that the liquid nutrient phase is vigorously agitated and the liquid film resistance is negligible, then S0 ≈ S0i. By defining a maximum rate of substrate utilization as rm = μmX/YX/S (g subs/cm3 h), we rewrite equation 9.46 as
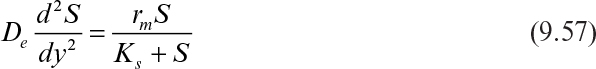
In dimensionless form, equation 9.51 can be written as

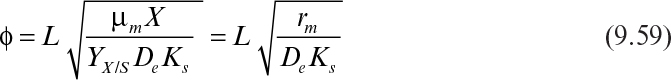
where

and
Equation 9.58 can be solved numerically. An analytical solution can be derived for the limiting cases of zero or first-order reaction rates.
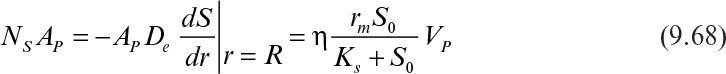
The maximum rate of substrate flux in the absence of diffusion limitations is given by
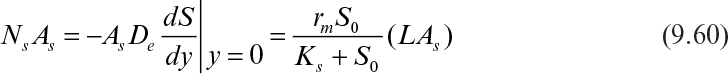
where As is a surface area of biofilm available for substrate flux, Ns is the substrate flux, and L is the thickness of the biofilm.
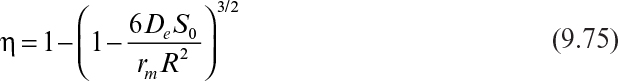
In the presence of diffusion limitation, the rate of substrate consumption or flux is expressed in terms of the effectiveness factor:

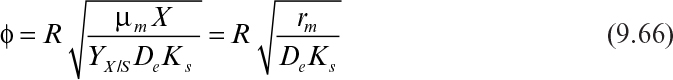
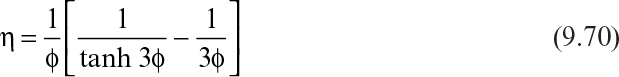
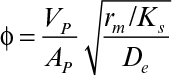
where η is the effectiveness factor, defined as the ratio of the rate of substrate consumption in the presence of diffusion limitation to the rate of substrate consumption in the absence of diffusion limitation. In the absence of diffusion limitations, η ≅ 1, and in the presence of diffusion limitations, η < 1. The effectiveness factor is a function of ϕ and β. Figure 9.15 is a plot of η versus β for various values of ϕ. The ϕ value should be low (ϕ < 1) to eliminate diffusion limitations. As the biofilm grows (slowly), the value of ϕ will gradually increase. If shear forces cause a portion of the film to detach, then ϕ will decrease abruptly.

Figure 9.15. Effectiveness factor for a flat biofilm as a function of β, the dimensionless initial substrate concentration, and ϕ, the Thiele modulus. (Redrawn from B. Atkinson, Biochemical Reactors, Pion Ltd., London, 1974, p. 81.)
The effectiveness factor (η) can be calculated as

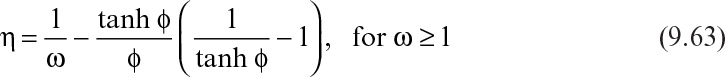
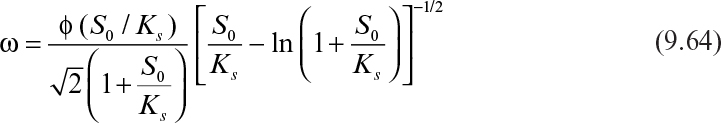
where ω is the modified Thiele modulus and is given by
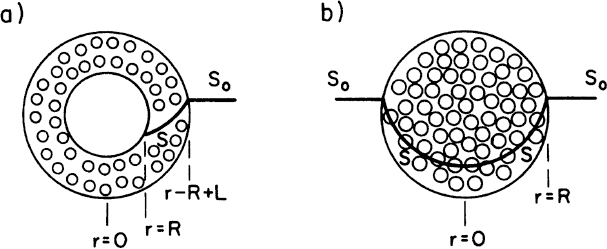
Some cells, such as molds (Aspergillus niger), form pellets in a fermentation broth, and substrates need to diffuse inside pellets to be available for microbial consumption. Cells may form biofilms on spherical support particles, as depicted in Figure 9.16. Similar equations need to be solved in spherical geometry in this case to determine the substrate profile within the floc and the substrate consumption rate. The dimensionless substrate transport equation within the microbial floc is

where
and
The boundary conditions are
For nonspherical particles, a characteristic length is defined as
where VP and AP are the volume and surface area of microbial pellet.
The rate of substrate consumption by a single microbial floc is
The effectiveness factor (η) is a function of ϕ and β. Variation of η with ϕ and β is similar to that of Figure 9.15. However, η values for spherical geometry are slightly lower than those of rectangular geometry for intermediate values of ϕ (1 < ϕ < 10). An analytical solution to equation 9.65 is possible for first- and zero-order reaction kinetics.
The reaction rate can be approximated to first order at low substrate concentrations:
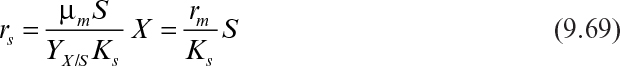
where rm = (μm/YX/S)X. The effectiveness factor in this case is given by
where
The rate of bioreaction can be approximated to zero order at values of S >> KS. Because KS is often very small, the zero-order limit usefully describes many systems of practical interest:
The solution to equation 9.57 in this case is

Substrate concentration may be zero at a certain radial distance from the center of the floc. This distance is called the critical radius (rcr) and is determined by setting S = 0 at rcr in equation 9.72:

When rcr > 0 (i.e., R > (6DeS0/rm)1/2), then the concentration of the limiting substrate is zero for 0 < r < rcr. In this case, the limiting substrate is consumed only in the outer shell of the floc, and the effectiveness factor is given by

or
9.3.4. Bioreactor Considerations in Immobilized Cell Systems
Various reactor configurations can be used for immobilized cell systems. Since the support matrices used for cell immobilization are often mechanically fragile, bioreactors that minimize particle collisions, such as packed-column, are preferred. Mechanically agitated fermenters can be used for some immobilized cell systems if the support matrix is strong and durable. Any of these reactors can usually be operated in perfusion mode by passing nutrient solution through a column of immobilized cells. Schematic diagrams of immobilized-cell packed-column and fluidized-bed reactors are depicted in Figure 9.17. These reactors can be operated in batch or continuous mode.

Figure 9.17. Schematics of a packed-bed and a fluidized-bed biofilm or immobilized cell bioreactors. In batch operation, only the streams with solid lines exist. In continuous operation, the streams shown by dashed lines are added. For the fluidized bed, fluidization can be accomplished by liquid recirculation only by a mixture of liquid and gas flows.
Consider the reactors shown in Figure 9.17. When the fluid recirculation rate is high, the system approaches CFSTR behavior. One commercial fluidized-bed, immobilized-animal-cell bioreactor system requires high recirculation to maintain uniform conditions in the reactor. The models we have discussed so far can be applied to such systems. The other extreme involves some waste-treatment systems where the rate of fluid recirculation is low or even zero. In the latter case, the system cannot be modeled as a CFSTR but must be treated as a PFR. To analyze such a system, consider a material balance on the rate-limiting substrate over a differential element:
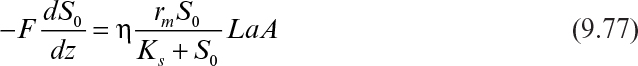
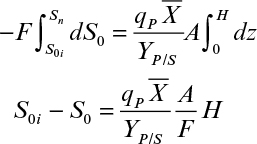
where S0 is the bulk liquid-phase substrate concentration (mg S/cm3) and is a function of height, F is the liquid nutrient flow rate (cm3/h), Ns is flux of substrate into the biofilm (mg S/cm2 h), a is the biofilm or support particle surface area per unit reactor volume (cm2/cm3), A is the cross-sectional area of the bed (cm2), and dz is the differential height of an element of the column (cm). Substituting equation 9.63 into equation 9.76 yields
Integration of equation 9.77 yields

where S0i is the inlet bulk substrate concentration, L is the biofilm thickness or the characteristic length of the support particle (L = VP/AP), and H is the total height of the packed bed.
For low substrate concentrations in the feed, the rate of substrate consumption is first order, and equation 9.78 has the following form:
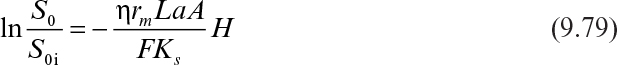
Substrate concentration drops exponentially with the height of the column in this case, and a plot of ln S0 versus H results in a straight line. Equation 9.77 or 9.78 can be used as the design equation for immobilized–biofilm column reactors to determine the height of the column for a desired level of substrate conversion.
Glucose is converted to ethanol by immobilized S. cerevisiae cells entrapped in Ca-alginate beads in a packed column. The specific rate of ethanol production is qP 0.2 g ethanol/g cell h, and the average dry-weight cell concentration in the bed is ![]() = 25 g/l bed. Assume that growth is negligible (i.e., almost all glucose is converted to ethanol) and the bead size is sufficiently small that η ≅ 1. The feed flow rate is F = 400 l/h, and glucose concentration in the feed is S0i = 100 g glucose/l. The diameter of the column is 1 m, and the product yield coefficient is YP/S ≈ 0.49 g ethanol/g glucose.
= 25 g/l bed. Assume that growth is negligible (i.e., almost all glucose is converted to ethanol) and the bead size is sufficiently small that η ≅ 1. The feed flow rate is F = 400 l/h, and glucose concentration in the feed is S0i = 100 g glucose/l. The diameter of the column is 1 m, and the product yield coefficient is YP/S ≈ 0.49 g ethanol/g glucose.
a. Write a material balance on the glucose concentration over a differential height of the column and integrate it to determine S = S(z) at steady state.
b. Determine the column height for 98% glucose conversion at the exit of the column.
c. Determine the ethanol concentration in the effluent.
a. A material balance on the glucose concentration over a differential height of the column yields

This equation differs from the form of equation 9.79 because S0i is high and the reaction rate is effectively zero order.
b. S0 = 0.02(100) = 2 g glucose/l. Substituting the given values into the previous equation yields
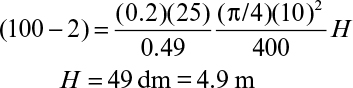
c. P=YP/S (S0i – S0) = 0.49(98) = 48 g/1.
9.4. Hybrid Bioreactors: Attached and Suspended Cells
In most biofilm reactors, such as the packed or fluidized beds, cells detach from the support particle surfaces and grow in the form of suspended cells or microbial flocs as well as biofilm. When the total amount of suspended cells exceeds 10% of the cells in the form of biofilm, then the contribution of suspended or floc-forming cells cannot be neglected. In this case, both the biofilm and suspended cells need to be included in the kinetic analysis of the system.
Consider a hybrid column bioreactor containing both biofilm on support particles and suspended cells where their amounts are comparable.
A substrate balance over a differential volume yields
where F is the flow rate of the nutrient solution; dS is the differential difference in the substrate concentration within the volume dV; Rf is the rate of conversion of substrate by the biofilm organisms; dVf is the differential volume of the biofilm within dV; Rs is the rate of conversion by the suspended cells; dV is the differential reaction volume, which includes both the biofilm and the suspended cells.
Rf and Rs can be described by the following equations:
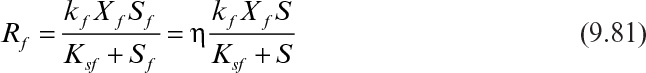
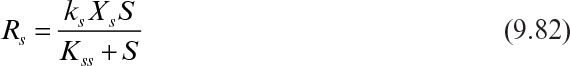
where kf and ks are the maximum specific rates of substrate consumption by the biofilm and the suspended cells; Xf and Xs are the biofilm and suspended cell concentrations; Sf and S are the rate limiting substrate concentrations in the biofilm and in the fermentation medium; Ksf and Kss are the saturation constants for the biofilm and suspended cells. Due to diffusion limitations within the biofilm the limiting substrate concentration in the biofilm (Sf) will be lower than the bulk substrate concentration (S). Effectiveness factor (η) is used to include the diffusion limitations and to express the Rf in terms of bulk substrate concentration (S).
Furthermore, we have the following:
where L is the average biofilm thickness (m) which is assumed to be constant; dAf is the differential biofilm surface area (m2); af is the biofilm surface area per unit reaction volume (m2/m3); Ao is the cross-section area of the column (m2); and dZ is the differential height of the column (m).
Substitution of equations 9.81, 9.82, and 9.83 to equation 9.80 yields

Assuming Ksf is approximately equal to Kss (Kss = Ksf = Ks), since the suspended cells are derived from the attached cells, equation 9.84 takes the following form:

The definition of Rmf = kf Xf and Rms = ks Xs, equation 9.85 becomes

where Rmf and Rms are the maximum rates of substrate conversion by the biofilm and the suspended organisms.
Assuming that the biofilm and suspended cell concentrations change slowly and can be assumed to be constant, integration of equation 9.86 yields

where Si and Se are the feed and the effluent substrate concentrations; θH is the hydraulic residence time; and H is the column height. The effectiveness factor (η) is determined by using either Figure 9.15 or equations 9.62 and 9.63.
For the first-order reaction rate equation 9.87 reduces to

The substrate concentration decreases with the height of the column exponentially and faster than if the reactor contained only the biofilm or the suspended culture alone.
If the reactor is completely mixed and contains both the biofilm and the suspended cells or flocs, the substrate balance takes the following form:

With the following definitions,
equation 9.89 takes the following form

or

where Rmf = kf Xf and Rms = ks Xs which are the maximum rates of substrate removal by the biofilm and the suspended cells, respectively.
With the definition of Rs = F(Si – S)/V, which is the actual rate of substrate removal, equation 9.92 reduces to

where Rm = ηRmfLaf + Rms and is the maximum substrate removal rate by the biofilm and the suspended cells. The effectiveness factor (η) is determined by using Figure 9.15 or equations 9.62, 9.63, and 9.64. In an experimental study, the data can be plotted in the form of 1/Rs versus 1/S and the constants determined from the slope and the intercept of the line.
9.5. Solid-State Fermentations
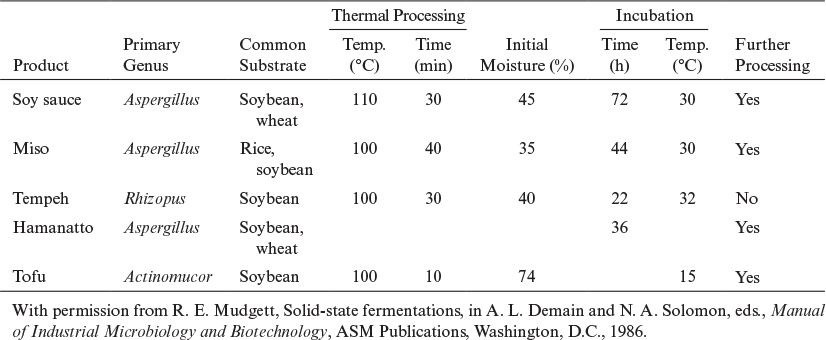
Solid-state fermentations (SSF) are fermentations of solid substrates at low moisture levels or water activities. The water content of a typical submerged fermentation is more than 95%. The water content of a solid mash in SSF often varies between 40% and 80%. SSFs are usually used for the fermentation of agricultural products or foods, such as rice, wheat, barley, corn, and soybeans. The unique characteristic of SSFs is operation at low moisture levels, which provides a selective environment for the growth of mycelial organisms, such as molds. In fact, most SSFs are mold fermentations producing extracellular enzymes on moist agricultural substrates. Since bacteria and yeasts cannot tolerate low moisture levels (water activities), the chances of contamination of fermentation media by bacteria or yeast are greatly reduced in SSF. Although most SSFs are mold fermentations, SSFs based on bacteria and yeast operating at relatively high moisture levels (75% to 90%) are also used. SSFs are used widely in Asia for food products, such as tempeh, miso, and soy sauce fermentations, and also for enzyme production, and they show promise for preparing wastes for bioenergy production.
The major advantages of SSFs over submerged fermentation systems are the small volume of fermentation mash or reactor volume, resulting in lower capital and operating costs; a lower chance of contamination due to low moisture levels; easy product separation; energy efficiency; and the allowing of the development of fully differentiated structures, which is critical in some cases to product formation. Examples include the formation of fungal spores for use as biocontrol agents, which develop more fully in SSF than in submerged fermentations. The major disadvantage of SSFs is the heterogeneous nature of the media due to poor mixing characteristics, which results in control problems (pH, DO, temperature) within the fermentation mash. To eliminate these control problems, fermentation media are usually mixed either continuously or intermittently. For large fermentation mash volumes, the concentration gradients may not be eliminated at low agitation speeds, and mycelial cells may be damaged at high agitation speeds. Usually, a rotating-drum fermenter is used for SSF systems, and the rotational speed needs to be optimized for the best performance. A key development in the last decade has been improved mathematical models to guide the operation and design of such bioreactors.
Solid-substrate fermentations imply a more general method of fermentations in which moisture content may not need to be low, but the substrate is in the form of submerged solid particles in liquid media. Bacterial ore leaching (i.e., growth and microbial oxidation on surfaces of mineral sulfide particles) and fermentation of rice in a packed column with circulating liquid media are examples of solid-substrate fermentations. Solid-state (or solid-phase) fermentations are a special form of solid-substrate fermentations for which the substrate is solid and the moisture level is low.
Four primary types of bioreactors for SSF have been described. A tray bioreactor, as used in production of many traditional SSF food processes (e.g., tempeh, miso, and soy sauce), is essentially an incubator with trays of grain or other substrate inoculated with mold spores. A second form is the packed-bed bioreactor in which air is typically circulated with forced aeration, and often a mode of heat removal is included. A third is the rotating-drum design whereby gas and solid are mixed as the drum is rotated. The fourth is the mixed and forcefully aerated bioreactor, which entails mechanical mixing of the contents, such as in a rotating drum, but with air supplied by forced convection. With each of these designs, the fragility of the mold may be a limiting factor, especially when mold differentiation is required.
The koji process is an SSF system that employs molds (Aspergillus, Rhizopus) growing on grains or foods (wheat, rice, soybean). A typical SSF process involves two stages. The first and primary stage is an aerobic, fungal SSF of grains called the koji. The second stage is an anaerobic submerged fermentation with a mixed bacterial culture called the moromi. Listed in Table 9.3 are the products of aerobic SSF, the koji process. Fermentation in the second stage (moromi) may be realized by using the natural flora or, usually, with externally added bacteria and yeasts. Some strains of Saccharomyces, Torulopsis, and Pediococcus are used as flavor producers in soy sauce manufacture. The moromi is usually fermented for 8 to 12 months. However, the processing time can be reduced to 6 months by temperature profiling. The final product is pressed to recover the liquid soy sauce and is pasteurized, filtered, and bottled.
The major industrial use of the koji process is for the production of enzymes by fungal species. Fungal amylases are produced by SSF of wheat bran by Aspergillus oryzae in a rotating-drum fermenter. Wheat bran is pretreated with formaldehyde, and the initial pH of the bran is adjusted to pH = 3.5 to 4.0 to reduce the chance of contamination. Usually, perforated pans, rotating drums, or packed beds with air ventilation are used. A typical rotary-drum type of koji fermenter is depicted in Figure 9.18. Enzymes other than amylases, such as cellulase, pectinase, protease, and lipases, can also be produced by koji fermentations. Trichoderma viride species have been used for the production of cellulases from wheat bran in a rotary-drum fermenter.

Figure 9.18. Schematic of a rotary-drum type solid-state fermenter including all operations (Koji process).
Some secondary metabolites, such as antibacterial agents, are produced by Rhizopus and Actinomucor species in some koji processes. Certain mycotoxins, such as aflatoxins, were produced by SSF of rice (40% moisture) by Aspergillus parasiticus. Ochratoxins were also produced by Aspergillus species on wheat in a rotary-drum koji fermenter. Microbial degradation of lignocellulosics can also be accomplished by SSF for waste-treatment purposes and in biopulping of wood chips for use in paper manufacture. Spores from some molds have found use as insecticides. Proper spore formation is difficult to obtain in submerged culture, and SSF must be used.
Major process variables in SSF systems are moisture content (water activity), inoculum density, temperature, pH, particle size, and aeration/agitation. Optimization of these parameters to maximize product yield and rate of product formation is the key in SSF systems and depends on the substrate and organism used. Most natural substrates (e.g., grains) require pretreatment to make the physical structure of substrates more susceptible to mycelial penetration and utilization. Solid substrates are usually treated with antimicrobial agents, such as formaldehyde, and are steamed in an autoclave. Nutrient media addition, pH adjustment, and the adjustment of moisture level are realized before inoculation of the fermentation mash. Koji fermentations are usually realized in a controlled-humidity air environment with air ventilation and agitation. Many solid-state mycelial fermentations are shear sensitive due to disruption of the mycelia at high agitation/rotation speeds. At low agitation rates, oxygen transfer and CO2 evolution rates become limiting. Therefore, an optimal range of agitation rate or rotation speed needs to be determined. Similarly, there is a minimum level of moisture content (~30% by weight) below which microbial activity is inhibited. At high moisture levels (>60%), solid substrates become sticky and form large aggregates. Moreover, moisture level affects the metabolic activities of cells. Optimal moisture level needs to be determined experimentally for each cell–substrate system. For most of the koji processes, the optimal moisture level is about 40% ± 5%. Particle size should be small enough to avoid any oxygen–CO2 exchange or other nutrient transport limitations. Porosity of the particles can be improved by pretreatment to provide a larger intraparticle surface to volume ratio for microbial action.
Most of the SSF processes are realized using a rotary-tray type of reactor in a temperature and humidity-controlled chamber where controlled-humidity air is circulated through stacked beds of trays containing fermented solids. Rotary-drum fermenters are used less frequently than rotary-tray fermenters because of the shear sensitivity of mycelial cells.
The biggest challenge for the design and operation of SSF systems is the intrinsic heterogeneity in such a system. Because of the localized nature of growth and lack of complete mixing, significant pH and temperature gradients as well as variations in oxygen transfer can be generated. Increased mixing as in a rotary-drum fermenter, which provides a more uniform environment, is not always possible due to the shear sensitivity of such systems and costs for mixing. Small trays (of order 30 cm by 60 cm) are labor intensive and still do not provide uniform culture conditions.
9.6. Summary
Bioreactors using suspended cells can be operated in many modes between a batch reactor and a single-stage chemostat. Although a chemostat has potential productivity advantages for primary products, considerations of genetic instability, process flexibility, and process reliability have limited the use of chemostat units. The use of cell recycle with a CFSTR increases volumetric productivity and has found use in large-volume, low-product-value processes (e.g., waste treatment and fuel-grade ethanol production). Multistage continuous systems improve the potential usefulness of continuous processes for the production of secondary metabolites and for the use of genetically unstable cells. The fed-batch system is widely used in commercial plants and combines the features of continuous culture and batch that allow the manufacturer to maintain flexibility and ease of intervention. The perfusion system is another option that is particularly attractive for animal cells.
Immobilized cell systems offer a number of potential processing advantages, and the commercialization of such systems has occurred in cases where cell culture is expensive and difficult (e.g., animal cell tissue culture). Physical entrapment or encapsulation is used in most cases, although adsorption onto surfaces or covalent binding of cells to surfaces is possible.
In some cases, self-immobilization on surfaces is possible, and a biofilm is formed. Biofilm reactors can apply to tissue culture, mold, and bacterial systems. Biofilm-based reactors are very important in waste-treatment applications and in natural ecosystems. The analysis of immobilized cell reactors is analogous to that for immobilized enzyme reactors except for the feature of biocatalyst replication.
Solid-state fermentations share some characteristics with immobilized cell systems but differ in that no discernible liquid is present. SSFs have found important uses in the production of some traditional fermented foods and may have use in upgrading agricultural or forest materials and in the production of mold products requiring full mold differentiation.
The reactor options described in this chapter are many. The best choice of reactor systems will ultimately be determined by the choice of biocatalyst and the requirements for product recovery and purification.
Suggestions for Further Reading
BAILEY, J. E., AND D. F. OLLIS, Biochemical Engineering Fundamentals, 2d ed., McGraw-Hill, New York, 1986.
BHARGAV, S., B. P. PANDA, M. ALI, AND S. JAVED, “Solid-State Fermentation: An Overview,” Chem. Biochem. Eng. Q. 22(1): 49–70, 2008.
BLANCH, H. W., AND D. S. CLARK, Biochemical Engineering, Marcel Dekker, New York, 1996.
CHANG, H. N., K. JUNG, J. CHOI, J. C. LEE, AND H. WOO, “Multi-stage Continuous High Cell Density Culture Systems: A Review,” Biotechnol. Adv. 32:514–525, 2014.
CONNELL, J. L., E. T. RITSCHDORFF, M. WHITLEY, AND J. B. SHEAR, “3D Printing of Microscopic Bacterial Communities,” PNAS 110(46): 18380–18385, 2013.
GUISAN, J. M, Immobilization of Enzymes and Cells, 3d ed., Humana Press, Totowa, NJ, 2013.
KARGI, F., AND M. MOO-YOUNG, “Transport Phenomena in Bioprocesses,” in M. Moo-Young, ed., Comprehensive Biotechnology, Vol. 2, Pergamon Press, Elmsford, NY, pp. 5–55, 1985.
KIM, B. S., S. C. LEE, S. Y. LEE, Y. K. CHANG, AND H. N. CHANG, “High Cell Density Fed-Batch Cultivation of Escherichia coli Using Exponential Feeding Combined with pH-stat,” Bioprocess. Biosys. Eng. 26(3): 147–150, 2004.
KRISHNA, C, “Solid-State Fermentation Systems—An Overview,” Crit. Rev. Biotechnol. 25(1–2): 1–30, 2005.
MANTZARIS, N. V., P. DAOUTIDIS, F. SRIENC, AND A. G. FREDRICKSON, “Growth Processes in a Cascade of Bioreactors: Mathematical Models,” AIChE J. 45(1):164–176, 1999.
MOULTON, G. G., Fed-batch Fermentation: A Practical Guide to Scalable Recombinant Protein Reduction in Escherichia coli, Elsevier, New York, 2014.
MURPHY, S. V., AND A. ATALA, “3D Bioprinting of Tissues and Organs,” Nat. Biotechnol. 32(8): 773–785, 2014.
Problems
9.1. Consider a 1000l CFSTR in which biomass is being produced with glucose as the substrate. The microbial system follows a Monod relationship with μm = 0.4 h–1, Ks = 1.5 g/l (an unusually high value), and the yield factor YX/S = 0.5 g biomass/g substrate consumed. Normal operation is with a sterile feed containing 10 g/l glucose at a rate of 100 l/h.
a. What is the specific biomass production rate (g/l-h) at steady state?
b. If recycle is used with a recycle stream of 10 l/h and a recycle biomass concentration five times as large as that in the reactor exit, what would be the new specific biomass production rate?
c. Explain any difference between the values found in parts a and b.
9.2. In a two-stage chemostat system, the volumes of the first and second reactors are V1 = 500 l and V2 = 300 l, respectively. The first reactor is used for biomass production and the second is for a secondary metabolite formation. The feed flow rate to the first reactor is F = 100 l/h, and the glucose concentration in the feed is S = 5.0 g/l. Use the following constants for the cells:

a. Determine cell and glucose concentrations in the effluent of the first stage.
b. Assume that growth is negligible in the second stage and the specific rate of product formation is qp = 0.2 g P/g cell h, and YP/S = 0.6 g P/g. Determine the product and substrate concentrations in the effluent of the second reactor.
9.3. Consider the following batch growth data:

You have available three tanks of different volumes: 900, 600, and 300 l. Given a flow rate of 100 l/h, what configuration of tanks would maximize product formation?
9.4. Two CFSTR in series are operated for fermentation of glucose to ethanol. The reactors are operated for a certain degree of conversion with a known feed substrate concentration (i.e., S0 and S2 are fixed). Assume a first order fermentation kinetics (Rs = k1S) in both reactors.
a. Write down the design equations for both reactors (θH as function of S) and the total hydraulic residence time as function of substrate concentrations.
b. Prove that total θH is minimum when S1 = (S0.S2)1/2.
c. Prove that θH1 = θH2 or the volumes of the reactors would be the same for the constant feed flow rate (F) when total θH or the total volume is minimum.
d. Express the hydraulic residence times for each reactor and the total hydraulic residence time in terms of k1, So, and S2.
9.5. Two-stage chemostat system is used for fermentation of glucose to ethanol using Saccharomyces cerevisiae. The feed flow rate and glucose concentrations are 1 l/h and S0 = 40 g/l, respectively. The following kinetic constants are known: td = 5 h, Ks = 1 g /l, YX/S = 0.1 gX/gS, YP/S = 0.5 g EtOH/g glucose. Assuming 80% conversion in every reactor, determine the following:
a. Substrate and product concentrations in the effluent of reactors
b. Biomass concentrations in both reactors
c. Volume of each reactor
d. Productivity of biomass (DX) and product (DP) for each reactor
e. Specific rates of product formation (qp) and substrate consumption (qs) for each reactor
9.6. Penicillin is produced by Penicillium chrysogenum in a fed-batch culture with the intermittent addition of glucose solution to the culture medium. The initial culture volume at quasi-steady state is V0 = 500 l, and glucose-containing nutrient solution is added with a flow rate of F = 50 l/h. Glucose concentration in the feed solution and initial cell concentration are S0 = 300 g/l and X0 = 20 g/l, respectively. The kinetic and yield coefficients of the organism are μm = 0.2 h–1, KS = 0.5 g/l, and YX/S = 0.3 g dw/g glucose.
a. Determine the culture volume at t = 10 h.
b. Determine the concentration of glucose at t = 10 h at quasi-steady state.
c. Determine the concentration and total amount of cells at quasi-steady state when t = 10 h.
d. If qP = 0.05 g product/g cells h and P0 = 0.1 g/l, determine the product concentration in the vessel at t = 10 h.
9.7. The bioconversion of glucose to ethanol is carried out in a packed-bed, immobilized cell bioreactor containing yeast cells entrapped in Ca-alginate beads. The rate-limiting substrate is glucose, and its concentration in the feed bulk liquid phase is S0i = 5g/l. The nutrient flow rate is F = 2 l/min. The particle size of Ca-alginate beads is DP = 0.5 cm. The surface area of the alginate beads per unit volume of the reactor is a = 25 cm2/cm3, and the cross-sectional area of the bed is A = 100 cm2.
Following are the rate constants for this conversion:
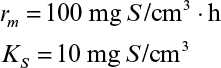
for the following rate expression:
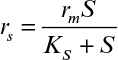
Assuming a first-order reaction-kinetics (e.g., relatively low substrate concentrations), determine the required bed height for 80% conversion of glucose to ethanol at the exit stream. Hint: To calculate the effectiveness factor, we can use the following equations:
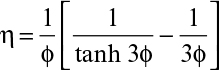
where

and
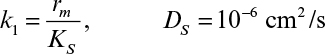
9.8. A fluidized-bed, immobilized cell bioreactor is used for the conversion of glucose to ethanol by Zymomonas mobilis cells immobilized in κ-carrageenan gel beads. The dimensions of the bed are 10 cm (diameter) by 200 cm. Since the reactor is fed from the bottom of the column and because of CO2 gas evolution, substrate and cell concentrations decrease with the height of the column. The average cell concentration at the bottom of the column is X0 = 45 g/l, and the average cell concentration decreases with the column height according to the following equation:
X = X0 (1- 0.005Z)
Z is the column height (cm). The specific rate of substrate consumption is qS = 2 g S/g cells h. The feed flow rate and glucose concentration in the feed are 5 l/h and 160 g glucose/l, respectively.
a. Determine the substrate (glucose) concentration in the effluent.
b. Determine the ethanol concentration in the effluent and ethanol productivity (g/l-h) if YP/S = 0.48 g ethanol/g glucose.
9.9. Lactic acid is produced by homolactic bacteria Streptococcus lactis from glucose solution using fed-batch operation. The following data are available: V0 = 10 l, X0 = 5 g/l, YX/S = 0.12 g X/g S, YP/S = 0.80 g P/g S, μm = 0.2 h–1, KS = 0.5 g/l, SF = 30 g/l, F = 2 l/h.
a. How long should the sytem be operated in order to obtain S = 0.5 g/l in the fermenter?
b. Determine the biomass and product concentrations at the end of operation.
c. What should be the feed flow rate in order to obtain S = 0.1 g/l after 10 h of operation?
d. Determine P and X for this operation.
9.10. A completely mixed bioreactor is used for ethanol fermentation of hydrolyzed starch solution containing 30 g/l total sugar. The following data are available: μm = 0.15 h–1, KS = 0.5 g/l, F = 10 l/h, YX/S = 0.1 g X/g S, YP/S = 0.5 gP/gS, kS = 0.1 d–1.
a. For 95% conversion of substrate to product, determine the required reactor volume and ethanol productivity when the system was operated without cell recycle.
b. For the same degree of conversion, determine the required reactor volume and ethanol productivity when the system was operated with cell recycle. r = 0.4, C = Xr/X = 3, α = 0.1.
9.11. In a fluidized-bed biofilm reactor, cells are attached on spherical plastic particles to form biofilms of average thickness L = 0.5 mm. The bed is used to remove carbon compounds from a wastewater stream. The feed flow rate and concentration of total fermentable carbon compounds in the feed are F = 2 l/h and S = 2000 mg/l. The diameter of the column is 10 cm. The kinetic constants of the microbial population are rm = 50 mg S/cm3-h and KS = 25 mg S/cm3. The specific surface area of the biofilm in the reactor is 2.5 cm2/cm3. Assuming first-order reaction kinetics and an average effectiveness factor of η = 0.7 throughout the column, determine the required height of the column for effluent total carbon concentration of S0i = 100 mg/l.
9.12. Glucose is converted to ethanol by immobilized yeast cells entrapped in gel beads. The specific rate of ethanol production is qP = 0.2 g ethanol/g cell-h. The effectiveness factor for an average bead is 0.8. Each bead contains 50 g/l of cells. The voids volume in the column is 40%. Assume growth is negligible (all glucose is converted into ethanol). The feed flow rate is F = 400 l/h, and glucose concentration in the feed is S0i = 150 g glucose/l. The diameter of the column is 1 m, and the yield coefficient is about 0.49 g ethanol/g glucose. The column height is 4 m.
a. What is the glucose conversion at the exit of the column?
b. What is the ethanol concentration in the exit stream?
9.13. Consider the batch growth curve in Figure 9.4 and the corresponding plots of dX/dt versus X and dP/dt versus P (Figure 9.7). You are asked to design a two-stage reactor system with continuous flow that will produce product P at a concentration of 0.55 g/l. You wish to minimize total reactor volume. For a flow rate of 1000 l/h, what size reactors (and in what order) would you recommend?
9.14. Consider Figure 9.9, which applies to a fed-batch system. Assume at t = 0, V = 100 l, X = 2 g/l, μ 1/h, S0 = 4 g/l, and S = 0.01 g/l. V is increased at a constant rate such that dV/dt = 20 l/h = F (or flow rate) and X is constant at all times.
a. Derive a formula to relate μ to V and dV/dt.
b. What is μ at t = 5 h?
9.15. An industrial wastewater stream is fed to a stirred-tank reactor continuously, and the cells are recycled back to the reactor from the bottom of the sedimentation tank placed after the reactor. The following are given for the system: F = 100 l/h; S0 = 5000 mg/l; μm = 0.25 h–1; Ks = 200 mg/l; α (recycle ratio) = 0.6; C (cell concentration factor) = 2; ![]() = 0.4. The effluent concentration is desired to be 100 mg/l.
= 0.4. The effluent concentration is desired to be 100 mg/l.
a. Determine the required reactor volume.
b. Determine the cell concentration in the reactor and in the recycle stream.
c. If the residence time is 2 h in the sedimentation tank, determine the volume of the sedimentation tank and cell concentration in the effluent of the sedimentation tank.
9.16. A wastewater stream is treated biologically by using a reactor containing immobilized cells in porous particles. Variation of rate of substrate removal with particle size is given in the following table.

a. What are the effectiveness factors for DP = 4 mm and DP = 7 mm?
b. The following data were obtained for DP = 4 mm at different substrate concentrations. Assuming no liquid film resistance, determine the rm and Ks for the microbial system.
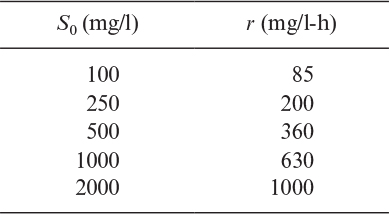
9.17. A wastewater stream of F = 1 m3/h with substrate at 2000 mg/l is treated in an upflow packed bed containing immobilized bacteria in form of biofilm on small ceramic particles. The effluent substrate level is desired to be 30 mg/l. The rate of substrate removal is given by the following equation:

By using the following information, determine the required height of the column (H): k = 0.5 h–1, X = 10 g/l, Ks = 200 mg/l, L = 0.2 mm, a = 100 m2/m3, A = 4 m2, η = 0.8.
9.18. A packed-column biofilm reactor (biofilter) with H/D0 = 2.5 is used for aerobic biological treatment of wastewater of flow rate Q = 5 m3/h and S0 = 1000 mg chemical oxygen demand/l to obtain Se = 25 mg COD/l in the effluent. The effluent is recycled with R = 2. The following information are available: μm = 0.12 h–1, Ks = 150 mg/l, Y = 0.35 g X/g S, X = 10 g X/l, L = 1.5 mm, R = 2 (Effluent recycle ratio), af = 120 m2/m3, De = 10–5 cm2/sec.
a. Determine the effectiveness factor (η).
b. Determine the volume and dimensions (Do and H) of the column.
c. For H = 3 m, determine biofilm area per unit reactor volume (af) and Do, when H/Do = 2.