Safety Stock Planning for a Hong Kong Fashion Retailer
Tsan-Ming (Jason) Choi, The Hong Kong Polytechnic University1
1 Tsan-Ming (Jason) Choi can be contacted at [email protected].
Introduction and Company Background
Inventory management is a critical part of fashion retail supply chain management. For most fashion products, consumer demand is very difficult to forecast, which makes inventory planning more difficult. In this case analysis, we explore the safety stock management problem in a fashion retailer in Hong Kong. With the (adapted) real data from the company, a systematic analysis on safety stock level can be conducted.
JTMC2 is one of the well-known chain store fashion retailers in Hong Kong. JTMC currently has 20 retail shops in Hong Kong3 (each of which carries approximately 400 items), and its annual sales turnover is approximately U.S. $100 million. In addition, it also has an overseas retail network extending to China, Macau, Indonesia, Australia, and many countries in the Middle East, with a combination of direct operation, franchising, and licensing. The company’s objective is to provide its customers with high-quality service and products at a very reasonable price. One of the company’s operational philosophies in terms of inventory management is that stock-outs should be avoided as much as possible. To achieve this target, the senior management of the company implements a logistics planning scheme in which (1) the product is replenished every day in a one-to-one replenishment manner (that is, one unit sold today will be filled by a replenishment within one day); and (2) inventory levels should be high and appropriately fill the available display space throughout the year for each in-season item. Thus, for both peak and non-peak seasons, the inventory level (including safety stock) for the same in-season item is the same (if the product is not out of stock, which is also the usual case for JTMC).
2 Company JTMC is a fictitious name for a real company.
3 To keep the company details anonymous, we modified and/or scaled the numbers provided in this case from the real values, but they do show the essential feature of the company and its inventory practice.
Safety Stock Analysis
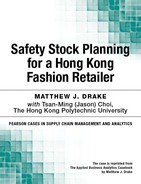
We have collected a sample of demand data from JTMC (Exhibits 1 and 2) and inventory data (Exhibit 3) for 10 items. With the use of these data sets, we can study quantitatively the appropriate safety stock level with respect to a target inventory service level. We can also comment on the efficiency of the existing inventory planning practice in JTMC.
To conduct the analysis, we make a few assumptions. For the sake of simplicity, we assume the daily demand of each item during each selling season follows a normal distribution. Using the information from Exhibits 1 and 2, we can construct Exhibits 4 and 5, which show the mean and the standard deviation of the daily demand of each item directly.
Because replenishment lead time is fixed (in fact, it is equal to 1), we can employ the standard textbook safety stock formula to calculate the amount of safety stock needed with a given inventory service target. The specific formula is given here:
where
• ![]() = the amount of required safety stock for item i = 1, 2,..., 10, during season k = peak, non-peak.
= the amount of required safety stock for item i = 1, 2,..., 10, during season k = peak, non-peak.
• ![]() = the standard deviation of daily demand for item i = 1, 2,..., 10, during season k = peak, non-peak.
= the standard deviation of daily demand for item i = 1, 2,..., 10, during season k = peak, non-peak.
• L = the lead time measured in days.
• α = the target inventory service level, which represents the chance of no stock-out during the replenishment cycle (that is, lead time L) and α < 100%.
• ![]() = the inverse of the standard normal cumulative distribution function (cdf).4
= the inverse of the standard normal cumulative distribution function (cdf).4
4 In Excel, the inverse of the standard normal cdf can be computed by the built-in function “normsinv().” In this case, the numerical analysis is conducted by the Office 2010 version of Microsoft Excel. A different version of Excel might yield slightly different numerical values.
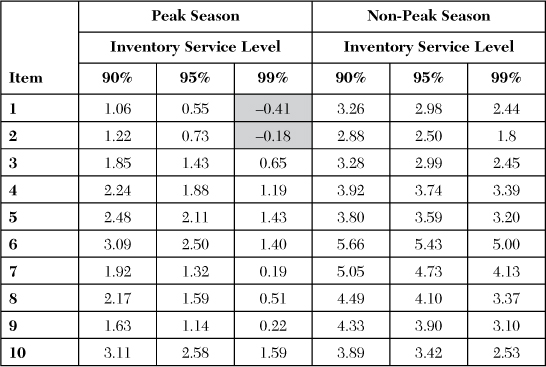
With (1), we can calculate the amounts of required safety stock for each item with different inventory service targets. The results are summarized in Exhibits 6 and 7.
With the amount of calculated safety stock as shown in Exhibits 6 and 7, we can establish the inventory level that should be kept for each item with a given inventory service target for each season scenario. In this case study, the inventory level is equal to the mean of daily demand multiplied by the lead time plus the amount of required safety stock, as shown in the following formula:
Inventory level of item i = Mean daily demand of item i × L + the amount of required safety stock of item i. (2)
Exhibit 8 shows the result.
Define: The inventory saving (in quantity) = current inventory level in the company (Exhibit 3) – calculated inventory level with a given inventory service target (Exhibit 8).
From Exhibits 3 and 8, we can compute Exhibit 9, which summarizes the inventory saving in quantity.
It is obvious from Exhibit 9 that the company has overstocked the majority of the items under consideration; therefore, the current safety stock levels are not correctly determined. As a result, substantial inventory savings potentially exist even for the case when the target inventory service level is set to be very high. Notice that the only exceptions, which refer to the cases in which the company has under-stocked, appear in two cases (both highlighted in Exhibit 9: Items 1 and 2 under the peak season scenario). Thus, the current inventory management practice in the company is far from efficient. There is a big opportunity to improve, for example, by re-benchmarking the inventory level with respect to the theoretical benchmark in terms of the required inventory to achieve the specific inventory service target.
Inventory Cost Analysis
As shown in Exhibit 9, despite having significant inventory savings, JTMC senior management is also interested in estimating the monetary value associated with the potential inventory savings. If the monetary cost-savings realized by a change in inventory practice is small, the company might not have an incentive to implement the change. In the following section, we discuss how the company can estimate the monetary saving by changing the safety stock level with the theoretical benchmark. Suppose that according to the accounting manager of the company, the inventory holding cost of an item per season is estimated to be 2.8% of its product value. For the sake of simplicity, suppose that the product value for items 1 to 5 is $10 each, and for items 6 to 10, is $15 each. Exhibit 10 shows the monetary value of the inventory saving by adopting the theoretical benchmark for the 10 selected items under consideration in the study.
From Exhibit 10, we have two findings:
1. The monetary savings are larger when the target inventory service is smaller. This point can be explained by the fact that the company’s current inventory level tends to be excessive.
2. Comparing between the peak season and the non-peak season, the monetary value of inventory savings is larger under the non-peak season case. This result is intuitive because the company’s current practice simply sets the same inventory level regardless of whether the seasonal demand is high (peak season) or low (non-peak season). Despite being an easy measure, it is in fact very inefficient.
Further Discussions and Analysis
In the preceding sections, we investigated the case using the simple analytical safety stock formula with the given data. Some areas for further analysis are listed in the following:
1. In the preceding analysis, the estimated safety stock levels are not expressed in integer values. Suppose that inventory levels must be expressed as integers, and re-analyze the case assuming that the given target inventory service level is the “minimum” required target inventory service level.
2. Assuming that the 10 items are good representatives of the whole retail assortment of the company (in terms of inventory savings) and that the peak season occurs over four months of each year,5 what will be the estimated annual monetary inventory savings for JTMC if it changes its safety stock quantity from the current practice to the theoretical benchmark if the target inventory service level is 95%?
5 Notice that each season is one month long. Thus, the remaining eight months are non-peak seasons.
3. Discuss whether the one-day replenishment cycle under the current “everyday replenishment” inventory practice is necessarily the most efficient method.
4. If there is a certain level of uncertainty with respect to the lead time, how will this lead time uncertainty affect the inventory cost savings for JTMC if it changes its safety stock quantity from the current practice to the theoretical benchmark for a certain given inventory service level?
Exhibits

Exhibit 2 A Sample of Demand Data During the Non-Peak Season for 10 Items of the Same Product Category (Adapted from and Scaled in Units with Respect to the Real Data Set)
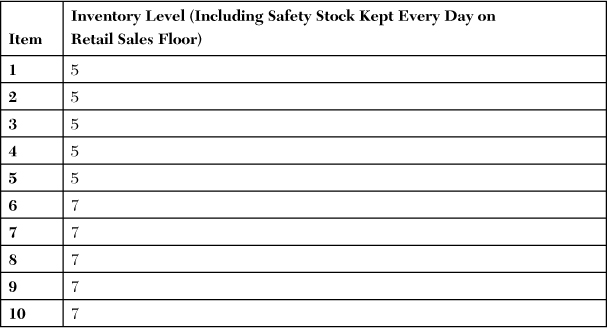
Exhibit 3 Inventory Level of the 10 Items of the Same Product Category (Adapted from and Scaled in Units with Respect to the Real Data Set)

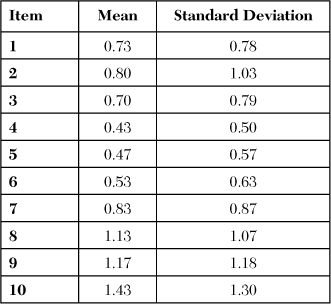

Exhibit 6 The Amount of Required Safety Stock During the Peak Season with a Given Target Inventory Service Level