8. Multiple Reactions
The breakfast of champions is not cereal, it’s your opposition.
—Nick Seitz
8.1 Definitions
8.1.1 Types of Reactions
There are four basic types of multiple reactions: parallel, series, independent, and complex. These types of multiple reactions can occur by themselves, in pairs, or all together. When there is a combination of parallel and series reactions, they are often referred to as complex reactions.
Parallel reactions (also called competing reactions) are reactions where the reactant is consumed by two different reaction pathways to form different products:

Parallel reactions
An example of an industrially significant parallel reaction is the oxidation of ethylene to ethylene oxide while avoiding complete combustion to carbon dioxide and water:

Serious chemistry
Series reactions (also called consecutive reactions) are reactions where the reactant forms an intermediate product, which reacts further to form another product:
Series reactions
An example of a series reaction is the reaction of ethylene oxide (EO) with ammonia to form mono-, di-, and triethanolamine:
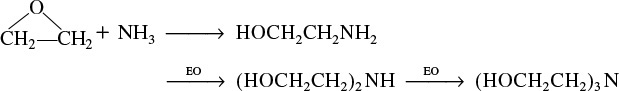
In recent years, the shift has been toward the production of diethanolamine as the desired product rather than triethanolamine.
Independent reactions are reactions that occur at the same time but neither the products nor the reactants react with themselves or one another.
Independent reactions
An example is the cracking of crude oil to form gasoline, where two of the many reactions occurring are

Complex reactions are multiple reactions that involve combinations of series and independent parallel reactions, such as
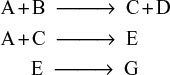
An example of a combination of parallel and series reactions is the formation of butadiene from ethanol:

8.1.2 Selectivity
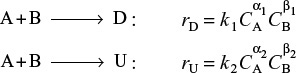
Desired and Undesired Reactions. Of particular interest are reactants that are consumed in the formation of a desired product, D, and the formation of an undesired product, U, in a competing or side reaction. In the parallel reaction sequence
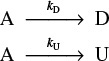
or in the series sequence
we want to minimize the formation of U and maximize the formation of D because the greater the amount of undesired product formed, the greater the cost of separating the undesired product U from the desired product D (see Figure 8-1).

The economic incentive
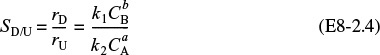
Selectivity tells us how one product is favored over another when we have multiple reactions. We can quantify the formation of D with respect to U by defining the selectivity and yield of the system. The instantaneous selectivity of D with respect to U is the ratio of the rate of formation of D to the rate of formation of U.
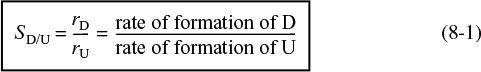
Instantaneous selectivity
In the next section, we will see how evaluating SD/U will guide us in the design and selection of our reaction system to maximize the selectivity.
Another definition of selectivity used in the current literature, ![]() , is given in terms of the flow rates leaving the reactor.
, is given in terms of the flow rates leaving the reactor. ![]() is the overall selectivity.
is the overall selectivity.

Overall selectivity
It is easily shown that for a CSTR the instantaneous and overall selectivites are identical. See P8-1A (d) and Summary Notes on the CRE Web site, www.umich.edu/~elements/5e/index.html.
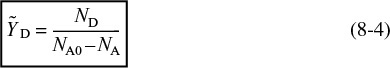
For a batch reactor, the overall selectivity is given in terms of the number of moles of D and U at the end of the reaction time.

8.1.3 Yield
Reaction yield, like selectivity, has two definitions: one based on the ratio of reaction rates and one based on the ratio of molar flow rates. In the first case, the yield at a point can be defined as the ratio of the reaction rate of a given product to the reaction rate of the key reactant A, usually the basis of calculation. This yield is referred to as the instantaneous yield YD.

Two definitions for selectivity and yield are found in the literature.
Instantaneous yield based on reaction rates
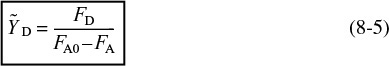
The overall yield, ![]() , is based on molar flow rates and defined as the ratio of moles of product formed at the end of the reaction to the number of moles of the key reactant, A, that have been consumed.
, is based on molar flow rates and defined as the ratio of moles of product formed at the end of the reaction to the number of moles of the key reactant, A, that have been consumed.
For a batch system
Overall yield based on moles
For a flow system
Overall yield based on molar flow rates
As with selectivity, the instantaneous yield and the overall yield are identical for a CSTR (i.e., ![]() ). From an economic standpoint, the overall selectivities,
). From an economic standpoint, the overall selectivities, ![]() , and yields,
, and yields, ![]() , are important in determining profits, while the instantaneous selectivities give insights in choosing reactors and reaction schemes that will help maximize the profit. There often is a conflict between selectivity and conversion because you want to make as much as possible of your desired product (D) and at the same time minimize the undesired product (U). However, in many instances, the greater the conversion you achieve, not only do you make more D, but you also form more U.
, are important in determining profits, while the instantaneous selectivities give insights in choosing reactors and reaction schemes that will help maximize the profit. There often is a conflict between selectivity and conversion because you want to make as much as possible of your desired product (D) and at the same time minimize the undesired product (U). However, in many instances, the greater the conversion you achieve, not only do you make more D, but you also form more U.
8.2 Algorithm for Multiple Reactions
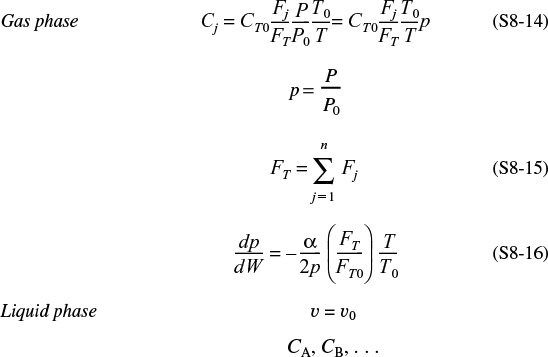
The multiple-reaction algorithm can be applied to parallel reactions, series reactions, independent reactions, and complex reactions. The availability of software packages (ODE solvers) makes it much easier to solve problems using moles Nj or molar flow rates Fj rather than conversion. For liquid systems, concentration is usually the preferred variable used in the mole balance equations.
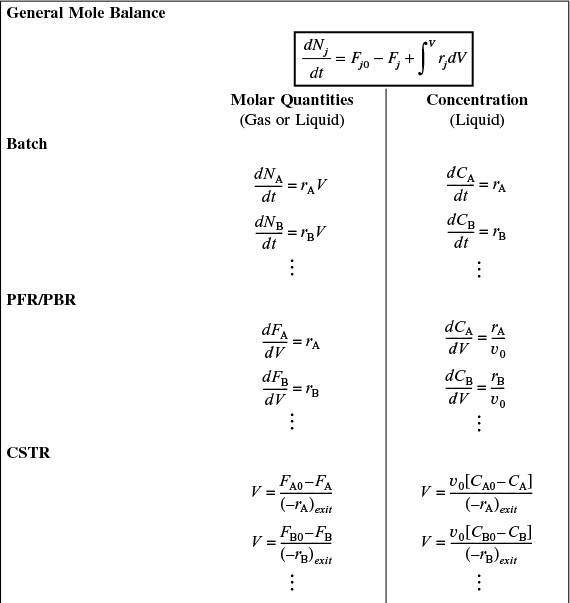

Mole balances on every species
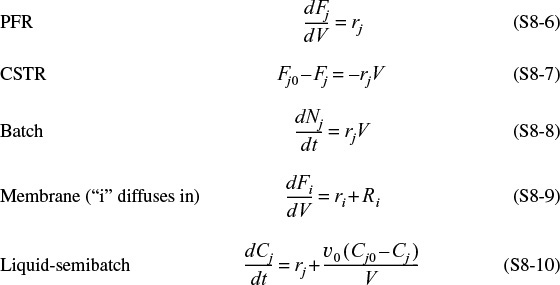
After numbering each and every reaction involved we carry out a mole balance on each and every species. The mole balances for the various types of reactors we have been studying are shown in Table 8-1. The rates shown Table 8-1, e.g., rA, are the net rates of formation and are discussed in detail in Table 8-2. The resulting coupled differential mole balance equations can be easily solved using an ODE solver. In fact, this section has been developed to take advantage of the vast number of computational techniques now available on laptop computers (e.g., Polymath).
Just a very few changes to our CRE algorithm for multiple reactions

8.2.1 Modifications to the Chapter 6 CRE Algorithm for Multiple Reactions
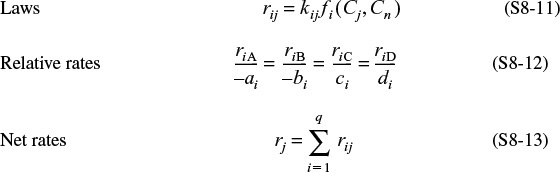
There are a few small changes to the CRE algorithm presented in Table 6-2, and we will describe these changes in detail when we discuss complex reactions in Section 8.5. However, before discussing parallel and series reactions, it is necessary to point out some of the modifications to our algorithm. These changes are highlighted in Table 8-2. When analyzing multiple reactions, we first number every reaction. Next, we must perform a mole balance on each and every species, just as we did in Chapter 6 to analyze reactions in terms of the mole balances for different reactor types. The rates of formation shown in the mole balances in Table 6-2 (e.g., rA, rB, rj) are the net rates of formation. The main change in the CRE algorithm in Table 6-2 is that the Rate Law step in our algorithm has now been replaced by the step Rates, which includes three substeps:
• Rate Laws
• Net Rates
• Relative Rates
8.3 Parallel Reactions
8.3.1 Selectivity
In this section, we discuss various means of minimizing the undesired product, U, through the selection of reactor type and operating conditions. We also discuss the development of efficient reactor schemes.
For the competing reactions such as

the rate laws are
Rate laws for formation of desired and undesired products
The net rate of disappearance of A for this reaction sequence is the sum of the rates of formation of U and D:
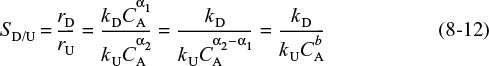
where α1 and α2 are positive reaction orders. We want the rate of formation of D, rD, to be high with respect to the rate of formation of U, rU. Taking the ratio of these rates [i.e., Equation (8-6) to Equation (8-7)], we obtain the instantaneous selectivity, SD/U, which is to be maximized:
Instantaneous selectivity
8.3.2 Maximizing the Desired Product for One Reactant
In this section, we examine ways to maximize the instantaneous selectivity, SD/U, for different reaction orders of the desired and undesired products.
Case 1: α1>α2. The reaction order of the desired product, α1, is greater than the reaction order of the undesired product, α2. Let a be a positive number that is the difference between these reaction orders (a > 0) :
α1–α2 = a
Then, upon substitution into Equation (8-10), we obtain
For α1>α2, make CA as large as possible by using a PFR or batch reactor.
To make this ratio as large as possible, we want to carry out the reaction in a manner that will keep the concentration of reactant A as high as possible during the reaction. If the reaction is carried out in the gas phase, we should run it without inerts and at high pressures to keep CA high. If the reaction is in the liquid phase, the use of diluents should be kept to a minimum.1
1 For a number of liquid-phase reactions, the proper choice of a solvent can enhance selectivity. See, for example, Ind. Eng. Chem., 62(9), 16. In gas-phase heterogeneous catalytic reactions, selectivity is an important parameter of any particular catalyst.
A batch or plug-flow reactor should be used in this case because, in these two reactors, the concentration of A starts at a high value and drops progressively during the course of the reaction. In a perfectly mixed CSTR, the concentration of reactant within the reactor is always at its lowest value (i.e., that of the outlet concentration) and therefore the CSTR should not be chosen under these circumstances.
Case 2: α2>α1. The reaction order of the undesired product is greater than that of the desired product. Let b = α2–α1, where b is a positive number; then
For the ratio rD/rU to be high, the concentration of A should be as low as possible.
This low concentration may be accomplished by diluting the feed with inerts and running the reactor at low concentrations of species A. A CSTR should be used because the concentrations of reactants are maintained at a low level. A recycle reactor in which the product stream acts as a diluent could be used to maintain the entering concentrations of A at a low value.
For α2>α1 use a CSTR and dilute the feed stream.
Because the activation energies of the two reactions in cases 1 and 2 are not given, it cannot be determined whether the reaction should be run at high or low temperatures. The sensitivity of the rate selectivity parameter to temperature can be determined from the ratio of the specific reaction rates
Effect of temperature on selectivity
where A is the frequency factor and E the activation energy, and the subscripts D and U refer to desired and undesired product, respectively.
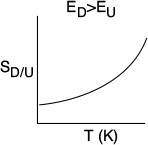
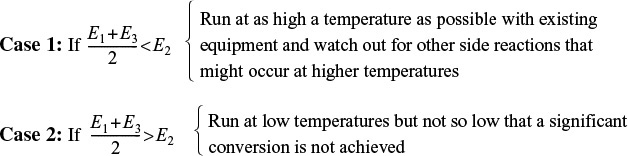
Case 3: ED>EU. In this case, the specific reaction rate of the desired reaction kD (and therefore the overall rate rD) increases more rapidly with increasing temperature, T, than does the specific rate of the undesired reaction kU. Consequently, the reaction system should be operated at the highest possible temperature to maximize SD/U.
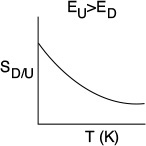
Case 4: EU>ED. In this case, the reaction should be carried out at a low temperature to maximize SD/U, but not so low that the desired reaction does not proceed to any significant extent.
Example 8–1 Maximizing the Selectivity for the Famous Trambouze Reactions
Reactant A decomposes by three simultaneous reactions to form three products, one that is desired, B, and two that are undesired, X and Y. These gas-phase reactions, along with the appropriate rate laws, are called the Trambouze reactions (AIChE J., 5, 384).
The specific reaction rates are given at 300 K and the activation energies for reactions (1), (2), and (3) are E1 = 10,000 kcal/mole, E2 = 15,000 kcal/mole, and E3 = 20,000 kcal/mole.
(a) How, and under what conditions (e.g., reactor type(s), temperature, concentrations), should the reaction be carried out to maximize the selectivity of species B for an entering concentration of species A of 0.4 M and a volumetric flow rate of 2.0 dm3/s?
(b) How could the conversion of B be increased and still keep selectivity relatively high?
Solution
Part (a)
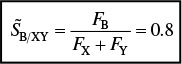
The instantaneous selectivity of species B with respect to species X and Y is

When we plot SB/XY vs. CA, we see that there is a maximum, as shown in Figure E8-1.1

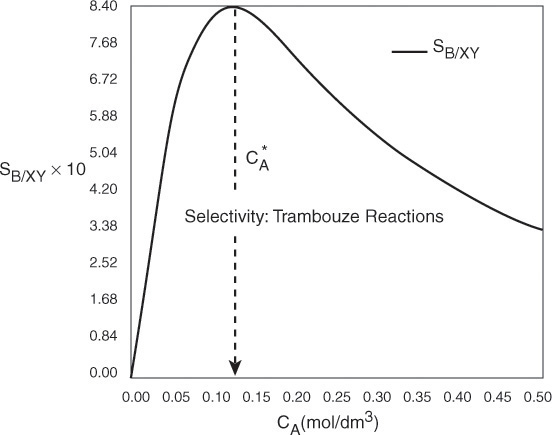
As we can see, the selectivity reaches a maximum at a concentration ![]() . Because the concentration changes down the length of a PFR, we cannot operate at this maximum. Consequently, we will use a CSTR and design it to operate at this maximum. To find the maximum,
. Because the concentration changes down the length of a PFR, we cannot operate at this maximum. Consequently, we will use a CSTR and design it to operate at this maximum. To find the maximum, ![]() , we differentiate SB/XY with respect to CA, set the derivative to zero, and solve for
, we differentiate SB/XY with respect to CA, set the derivative to zero, and solve for ![]() . That is
. That is
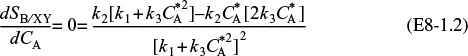
Solving for ![]()
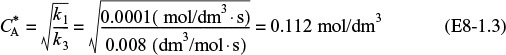
Operate at this CSTR reactant concentration: ![]() = 0.112 mol/dm3.
= 0.112 mol/dm3.
We see from Figure E8-1.1 that the selectivity is indeed a maximum at ![]() = 0.112 mol/dm3.
= 0.112 mol/dm3.

Therefore, to maximize the selectivity SB/XY, we want to carry out our reaction in such a manner that the CSTR concentration of A is always at ![]() . The corresponding selectivity at
. The corresponding selectivity at ![]() is
is

We now calculate the CSTR volume when the exit concentration is ![]() . The net rate of formation of A is a sum of the reaction rates from Equations (1), (2), and (3)
. The net rate of formation of A is a sum of the reaction rates from Equations (1), (2), and (3)

Using Equation (E8-1.5) in the mole balance on a CSTR for this liquid-phase reaction (υ = υ0) to combine it with the net rate we obtain
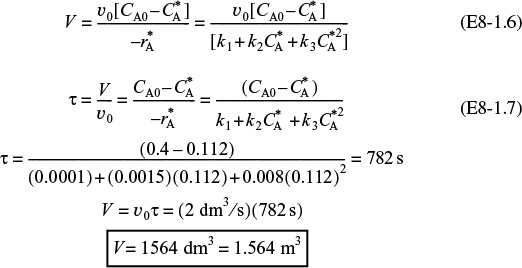
CSTR volume to maximize selectivity ![]()
For an entering volumetric flow rate of 2 dm3/s, we must have a CSTR volume of 1564 dm3 to maximize the selectivity, SB/XY.
Maximize the selectivity with respect to temperature.
We now substitute ![]() in Equation (E8-1.1) and then substitute for
in Equation (E8-1.1) and then substitute for ![]() in terms of k1 and k3, cf. Equation (E8-1.3), to get SB/XY in terms of k1, k2, and k3.
in terms of k1 and k3, cf. Equation (E8-1.3), to get SB/XY in terms of k1, k2, and k3.

At what temperature should we operate the CSTR?
For the activation energies given in this example
So the selectivity for this combination of activation energies is independent of temperature!
What is the conversion of A in the CSTR?

Part (b)
If a greater than 72% conversion of A is required, say 90%, then the CSTR operated with a reactor concentration of 0.112 mol/dm3 should be followed by a PFR because the conversion will increase continuously as we move down the PFR (see Figure E8-1.2(b)). However, as can be seen in Figure E8-1.2, the concentration will decrease continuously from ![]() , as will the selectivity SB/XY as we move down the PFR to an exit concentration CAf. Hence the system
, as will the selectivity SB/XY as we move down the PFR to an exit concentration CAf. Hence the system
How can we increase the conversion and still have a high selectivity SB/XY?
would give the highest selectivity and least total reactor volume while forming more of the desired product B, beyond what was formed at ![]() in a CSTR.
in a CSTR.
Figure E8-1.2 illustrates how as the conversion is increased above X* by adding the PFR reactor volume; however, the selectivity decreases.

Figure E8-1.2 Effect of adding a PFR to increase conversion. (a) Reactor arrangement; (b) Selectivity and conversion trajectories.
This calculation for the PFR is carried out on the CRE Web site in Example 8-1. The results of this calculation show that at the exit of the PFR, the molar flow rates are FX = 0.22 mol/s, FB = 0.32 mol/s, and FY = 0.18 mol/s corresponding to a conversion of X = 0.9. The corresponding selectivity at a conversion of 90% is
Do you really want to add the PFR?
Analysis: One now has to make a decision as to whether adding the PFR to increase the conversion of A from 0.72 to 0.9 and the molar flow rate of B from 0.26 to 0.32 mol/s is worth not only the added cost of the PFR, but also the decrease in selectivity from 0.84 to 0.8. In this example, we used the Trambouze reactions to show how to optimize the selectivity to species B in a CSTR. Here, we found the optimal exit conditions (CA = 0.112 mol/dm3), conversion (X = 0.72), and selectivity (SB/XY = 0.84). The corresponding CSTR volume was V = 1564 dm3. If we wanted to increase the conversion to 90%, we could use a PFR to follow the CSTR, and find that the selectivity decreased.
8.3.3 Reactor Selection and Operating Conditions
Next, consider two simultaneous reactions in which two reactants, A and B, are being consumed to produce a desired product, D, and an unwanted product, U, resulting from a side reaction. The rate laws for the reactions
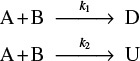
are
The instantaneous selectivity
Instantaneous selectivity
is to be maximized. Shown in Figure 8-2 are various reactor schemes and conditions that might be used to maximize SD/U.
The two reactors with recycle shown in (i) and (j) can be used for highly exothermic reactions. Here, the recycle stream is cooled and returned to the reactor to dilute and cool the inlet stream, thereby avoiding hot spots and runaway reactions. The PFR with recycle is used for gas-phase reactions, and the CSTR is used for liquid-phase reactions.
The last two reactors in Figure 8-2, (k) and (l), are used for thermodynamically limited reactions where the equilibrium lies far to the left (reactant side)
and one of the products must be removed (e.g., C) for the reaction to continue to completion. The membrane reactor (k) is used for thermodynamically limited gas-phase reactions, while reactive distillation (l) is used for liquid-phase reactions when one of the products has a higher volatility (e.g., C) than the other species in the reactor.
In making our selection of a reactor, the criteria are safety, selectivity, yield, temperature control, and cost.
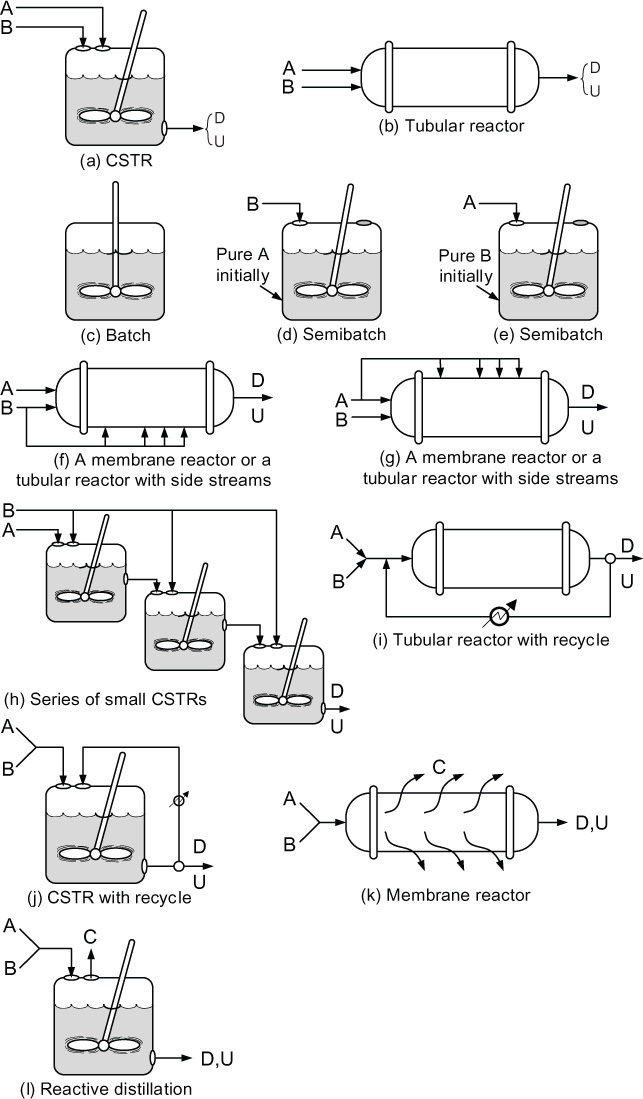
Figure 8-2 Different reactors and schemes for maximizing SD/U in Equation 8-16. Note unreacted A and B also exit the reactor along with D and U.
Reactor Selection
Criteria:
• Safety
• Selectivity
• Yield
• Temperature control
• Cost
Example 8–2 Choice of Reactor and Conditions to Minimize Unwanted Products
For the parallel reactions
consider all possible combinations of reaction orders and select the reaction scheme that will maximize SD/U.
Solution
Case 1: α1 > α2, β1 > β2. Let a = α1–α2 and b = β1–β2, where a and b are positive constants. Using these definitions, we can write Equation (8-16) in the form

To maximize the ratio rD/rU, maintain the concentrations of both A and B as high as possible. To do this, use
• A tubular reactor, Figure 8-2(b).
• A batch reactor, Figure 8-2(c).
• High pressures (if gas phase), and reduce inerts.
Case 2: α1>α2, β1<β2. Let a = α1–α2 and b = β2–β1, where a and b are positive constants. Using these definitions, we can write Equation (8-16) in the form

To make SD/U as large as possible, we want to make the concentration of A high and the concentration of B low. To achieve this result, use
• A semibatch reactor in which B is fed slowly into a large amount of A as in Figure 8-2(d).
• A membrane reactor or a tubular reactor with side streams of B continually fed to the reactor as in Figure 8-2(f).
• A series of small CSTRs with A fed only to the first reactor and small amounts of B fed to each reactor. In this way, B is mostly consumed before the CSTR exit stream flows into the next reactor as in Figure 8-2(h).
Case 3: α1<α2, β1<β2. Let a = α2–α1 and b = β2–β1, where a and b are positive constants. Using these definitions, we can write Equation (8-16) in the form
To make SD/U as large as possible, the reaction should be carried out at low concentrations of A and of B. Use
• A CSTR as in Figure 8-2(a).
• A tubular reactor in which there is a large recycle ratio as in Figure 8-2(i).
• A feed diluted with inerts.
• Low pressure (if gas phase).
Case 4: α1<α2, β1>β2. Let a = α2–α1 and b = β1–β2, where a and b are positive constants. Using these definitions, we can write Equation (8-16) in the form
To maximize SD/U, run the reaction at high concentrations of B and low concentrations of A. Use
• A semibatch reactor with A slowly fed to a large amount of B as in Figure 8-2(e).
• A membrane reactor or a tubular reactor with side streams of A as in Figure 8-2(g).
• A series of small CSTRs with fresh A fed to each reactor.
Analysis: In this very important example we showed how to use the instantaneous selectivity, SD/U, to guide the initial selection of the type of reactor and reactor system to maximize the selectivity with respect to the desired species D. The final selection should be made after one calculates the overall selectivity ![]() for the reactors and operating conditions chosen.
for the reactors and operating conditions chosen.
8.4 Reactions in Series
In Section 8.1, we saw that the undesired product could be minimized by adjusting the reaction conditions (e.g., concentration, temperature) and by choosing the proper reactor. For series (i.e., consecutive) reactions, the most important variable is time: space time for a flow reactor and real time for a batch reactor. To illustrate the importance of the time factor, we consider the sequence
in which species B is the desired product.
If the first reaction is slow and the second reaction is fast, it will be extremely difficult to produce species B. If the first reaction (formation of B) is fast and the reaction to form C is slow, a large yield of B can be achieved. However, if the reaction is allowed to proceed for a long time in a batch reactor, or if the tubular flow reactor is too long, the desired product B will be converted to the undesired product C. In no other type of reaction is exactness in the calculation of the time needed to carry out the reaction more important than in series reactions.
Example 8–3 Series Reactions in a Batch Reactor
The elementary liquid-phase series reaction
is carried out in a batch reactor. The reaction is heated very rapidly to the reaction temperature, where it is held at this temperature until the time it is quenched.
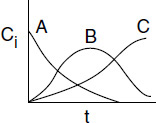
(a) Plot and analyze the concentrations of species A, B, and C as a function of time.
(b) Calculate the time to quench the reaction when the concentration of B will be a maximum.
(c) What are the overall selectivity and yields at this quench time?
CA0 = 2M, k1 = 0.5h–1, k2 = 0.2h–1
Solution
Part (a)
Number the Reactions:
The preceding series reaction can be written as two reactions
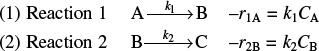
1. Mole Balances:
2A. Mole Balance on A:
a. Mole balance in terms of concentration for V = V0 becomes
b. Rate law for Reaction 1: Reaction is elementary
c. Combining the mole balance and rate law

Integrating with the initial condition CA = CA0 at t = 0
Solving for CA
2B. Mole Balance on B:
a. Mole balance for a constant-volume batch reactor becomes
b. Rates:
Rate Laws
Elementary reactions
Relative Rates
Rate of formation of B in Reaction 1 equals the rate of disappearance of A in Reaction 1.
The net rate of reaction of B will be the rate of formation of B in reaction (1) plus the rate of formation of B in reaction (2).
c. Combining the mole balance and rate law
Rearranging and substituting for CA
Using the integrating factor gives
At time t = 0, CB = 0. Solving Equation (E8-3.13) gives
2C. Mole Balance on C:
The mole balance on C is similar to Equation (E8-3.1).
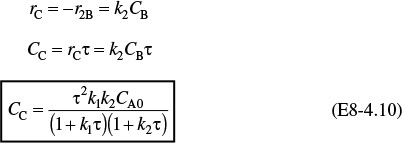
The rate of formation of C is just the rate of disappearance of B in reaction (2), i.e., rC = –r2B = k2CB
Substituting for CB
and integrating with CC = 0 at t = 0 gives
Note that as t → ∞, then CC = CA0 as expected. We also note the concentration of C, CC, could have been obtained more easily from an overall balance.
Calculating the concentration of C the easy way
The concentrations of A, B, and C are shown as a function of time in Figure E8-3.1.

Part (b)
4. Optimum Yield
We note from Figure E8-3.1 that the concentration of B goes through a maximum. Consequently, to find the maximum we need to differentiate Equation E8-3.14 and set it to zero.
Solving for tmax gives
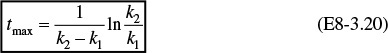
Substituting Equation (E8-3.20) into Equation (E8-3.5), we find the concentration of A at the maximum for CB is

Series Reaction
Similarly, the concentration of B at the maximum is

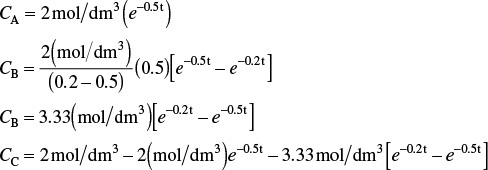
5. Evaluate: Substituting for CA0 = 2 mol/dm3, k1 = 0.5h–1, and k2 = 0.2h–1 in Equations (E8-3.5), (E8-3.14), and (E8-3.18), the concentrations as a function of time are
Substituting in Equation (E8-3.20)
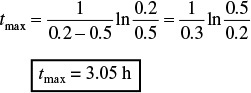
The time to quench the reaction is at 3.05 h.
At tmax = 3.05 h, the concentrations of A, B, and C are

The concentration of C at the time we quench the reaction is
CC = CA0–CA–CB = 2–0.44–1.07 = 0.49 mol/dm3
Part (c) Calculate the overall selectivity and yield at the reaction quench time.
The selectivity is
The yield is
Analysis: In this example, we applied our CRE algorithm for multiple reactions to the series reaction A → B → C. Here, we obtained an analytical solution to find the time at which the concentration of the desired product B was a maximum and, consequently, the time to quench the reaction. We also calculated the concentrations of A, B, and C at this time, along with the selectivity and yield.
We will now carry out this same series reaction in a CSTR.
Example 8–4 Series Reaction in a CSTR
The reactions discussed in Example 8-3 are now to be carried out in a CSTR.

(a) Determine the exit concentrations from the CSTR.
(b) Find the value of the space time τ that will maximize the concentration of B.
Part (a)
1. a. Mole Balance on A:

Dividing by υ0, rearranging and recalling that τ = V/υ0, we obtain
b. Rates
The laws and net rates are the same as in Example 8-3.
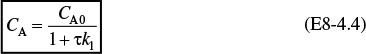
c. Combining the mole balance of A with the rate of disappearance of A
Solving for CA
We now use the same algorithm for species B we did for species A to solve for the concentration of B.
2. a. Mole Balance on B:
Dividing by υ0 and rearranging
b. Rates
The laws and net rates are the same as in Example 8-3.
Net Rates
c. Combine

Substituting for CA


Rates
Part (b) Optimum Concentration of B
To find the maximum concentration of B, we set the differential of Equation (E8-4.8) with respect to τ equal to zero

Solving for τ at which the concentration of B is a maximum at

The exiting concentration of B at the optimum value of τ is
Substituting Equation (E8-4.11) for τmax in Equation (E8-4.12)

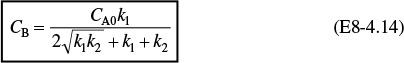
Rearranging, we find the concentration of B at the optimum space time is
Evaluation
At τmax, the concentrations of A, B, and C are

The selectivity is
The yield is
Analysis: The CRE algorithm for multiple reactions was applied to the series reaction A → B → C in a CSTR to find the CSTR space time necessary to maximize the concentration of B, i.e., τ = 3.16 h. The conversion at this space time is 61%, the selectivity, ![]() , is 1.60, and the yield,
, is 1.60, and the yield, ![]() , is 0.63. The conversion and selectivity are less for the CSTR than those for the batch reactor at the time of quenching.
, is 0.63. The conversion and selectivity are less for the CSTR than those for the batch reactor at the time of quenching.
PFR
If the series reaction were carried out in a PFR, the results would essentially be those of a batch reactor where we replaced the time variable “t” with the space time, “τ”. Data for the series reaction
is compared for different values of the specific reaction rates, k1 and k2, in Figure 8-3.

Figure 8-3 Yield of acetaldehyde as a function of ethanol conversion. Data were obtained at 518 K. Data points (in order of increasing ethanol conversion) were obtained at space velocities of 26,000, 52,000, 104,000, and 208,000 h–1. The curves were calculated for a first-order series reaction in a plug-flow reactor and show yield of the intermediate species B as a function of the conversion of reactant for various ratios of rate constants k2 and k1. (McCabe, Robert W. and Patricia J. Mitchell. Oxidation of ethanol and acetaldehyde over alumina-supported catalysts. Industrial & Engineering Chemistry Product Research and Development 1983 22 (2), 212-217. Copyright © 1963, American Chemical Society. Reprinted by permission.)
A complete analysis of this reaction carried out in a PFR is given on the CRE Web site.

Side Note: Blood Clotting
Many metabolic reactions involve a large number of sequential reactions, such as those that occur in the coagulation of blood.
Cut → Blood → Clotting
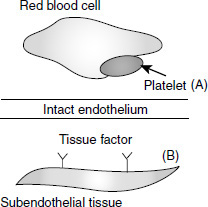
Blood coagulation (see Figure A) is part of an important host defense mechanism called hemostasis, which causes the cessation of blood loss from a damaged vessel. The clotting process is initiated when a nonenzymatic lipoprotein (called the tissue factor) contacts blood plasma because of cell damage. The tissue factor (TF) is normally not in contact with plasma (see Figure B) because of an intact endothelium. The rupture (e.g., cut) of the endothelium exposes the plasma to TF and a cascade* of series reactions proceeds (Figure C). These series reactions ultimately result in the conversion of fibrinogen (soluble) to fibrin (insoluble), which produces the clot. Later, as wound healing occurs, mechanisms that restrict formation of fibrin clots, necessary to maintain the fluidity of the blood, start working.
*Platelets provide procoagulant, phospholipids-equivalent surfaces upon which the complex-dependent reactions of the blood coagulation cascade are localized.
Ouch!
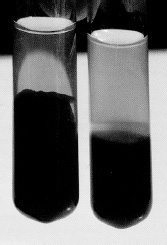
Figure A Normal clot coagulation of blood. (Dietrich Mebs, Venomous and Poisonous Animals, Stuttgart: Medpharm, (2002), p. 305 Reprinted by permission of the author.)

An abbreviated form (1) of the initiation and following cascade metabolic reactions that can capture the clotting process is


In order to maintain the fluidity of the blood, the clotting sequence (2) must be moderated. The reactions that attenuate the clotting process are
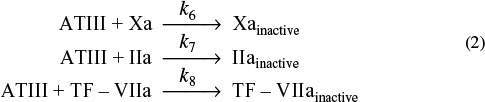
where TF = tissue factor, VIIa = factor novoseven, X = Stuart Prower factor, Xa = Stuart Prower factor activated, II = prothrombin, IIa = thrombin, ATIII = antithrombin, and XIIIa = factor XIIIa.
Symbolically, the clotting equations can be written as
One can model the clotting process in a manner identical to the series reactions by writing a mole balance and rate law for each species, such as
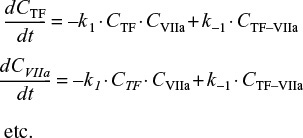
The next time you have to go to the emergency room for a serious cut, discussing the clotting mechanism should impress the doctor as you are stitched up.
and then using Polymath to solve the coupled equations to predict the thrombin (shown in Figure D) and other species concentration as a function of time, as well as to determine the clotting time. Laboratory data are also shown below for a TF concentration of 5 pM. One notes that when the complete set of equations is used, the Polymath output is identical to Figure E. The complete set of equations, along with the Polymath Living Example Problem code, is given in the Solved Problems on the CRE Web site. You can load the program directly and vary some of the parameters.
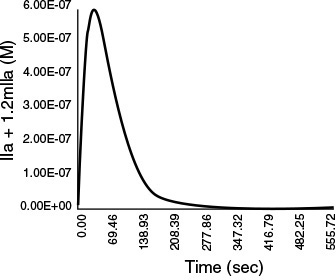
Figure D Total thrombin as a function of time with an initiating TF concentration of 25 pM (after running Polymath) for the abbreviated blood-clotting cascade.
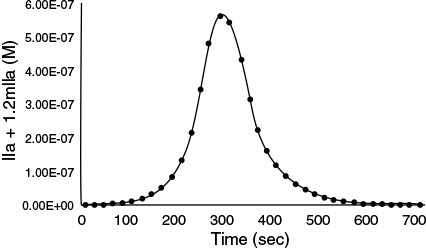
Figure E Total thrombin as a function of time with an initiating TF concentration of 25 pM. Full blood clotting cascade. (Enzyme Catalysis and Regulation: Mathew F. Hockin, Kenneth C. Jones, Stephen J. Everse, and Kenneth G. Maan. A Model for the Stoichiometric Regulation of Blood Coagulation. J. Biol. Chem. 2002 277: 18322–18333. First published on March 13, 2002. Copyright © 2002, by the American Society for Biochemistry and Molecular Biology.)
8.5 Complex Reactions
A complex reaction system consists of a combination of interacting series and parallel reactions. Overall, this algorithm is very similar to the one given in Chapter 6 for writing the mole balances in terms of molar flow rates and concentrations (i.e., Figure 6-1). After numbering each reaction, we write a mole balance on each species, similar to those in Figure 6-1. The major difference between the two algorithms is in the rate-law step. As shown in Table 8-2, we have three steps (3, 4, and 5) to find the net rate of reaction for each species in terms of the concentration of the reacting species. As an example, we shall study the following complex reactions
carried out in a PBR, a CSTR, and a semibatch reactor.
8.5.1 Complex Gas-Phase Reactions in a PBR
We now apply the algorithms in Tables 8-1 and 8-2 to a very important complex reaction carried out in a PBR. To protect the confidential nature of this reaction the chemicals have been given the names A, B, C, and D.
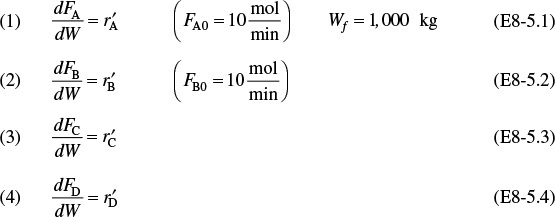
Examples 8–5 Multiple Gas-Phase Reactions in a PBR
The following complex gas-phase reactions follow elementary rate laws

and take place isothermally in a PBR. The feed is equimolar in A and B with FA0 = 10 mol/min and the volumetric flow rate is 100 dm3/min. The catalyst weight is 1,000 kg, the pressure drop is α = 0.0019 kg–1, and the total entering concentration is CT0 = 0.2 mol/dm3.
(a) Plot and analyze FA, FB, FC, FD, y, and ![]() as a function of catalyst weight, W.
as a function of catalyst weight, W.

Solution
Following the algorithm in Table 8-2 and having numbered our reactions, we now proceed to carry out a mole balance on each and every species in the reactor.
Gas-Phase PBR
1. Mole Balances
Net Rates

Rate Laws

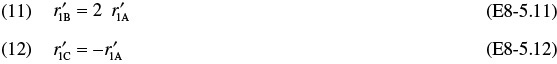
Relative Rates
![]()
![]()
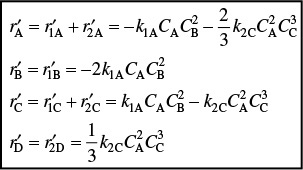
The net rates of reaction for species A, B, C, and D are
Selectivity
![]()
At W = 0, FD = 0 causing SC/D to go to infinity. Therefore, we set SC/D = 0 between W = 0 and a very small number, W = 0.0001 kg to prevent the ODE solver, as well as other ODE solvers such as MATLAB and Excel, from crashing. In Polymath, this condition is written

3. Stoichiometry Isothermal T = T0

4. Parameters
(22) CT0 = 0.2 mol/dm3
(23) α = 0.0019 kg–1
(24) υ0 = 100 dm3/min
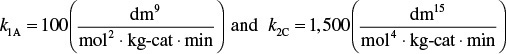
(25) k1A = 100(dm3/mol)2/min/kg-cat
(26) k2C = 1,500 (dm15/mol4)/min/kg-cat
(27) FT0 = 20 mol/min
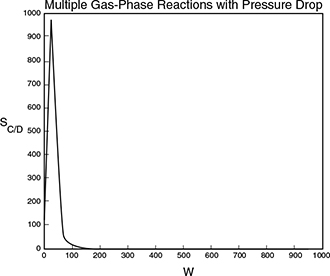
Entering the above equations into Polymath’s ODE solver, we obtain the following results in Table E8-5.1 and Figures E8-5.1 and E8-5.2.
Analysis: This example is a very important one as it shows, step by step, how to handle isothermal complex reactions. For complex reactions occurring in any of the reactors shown in Figure 8-2, a numerical solution is virtually always required. The Polymath program and sample results are shown below. This problem is a Living Example Problem, LEP, so the reader can download the Polymath code and vary the reaction parameters (e.g., k1A, α, k2C, υ0) to learn how Figures E8-5.1 and E8-5.2 change.
In looking at the solution we note from Figure E8-5.2 that the selectivity reaches a maximum very close to the entrance (W ≈ 60 kg) and then drops rapidly. However, 90% of A is not consumed until 200 kg, the catalyst weight at which the desired product C reaches its maximum flow rate. If the activation energy for reaction (1) is greater than that for reaction (2), try increasing the temperature to increase the molar flow rate of C and selectivity. However, if that does not help, then one has to decide which is more important, selectivity or the molar flow rate of the desired product. In the former case, the PBR catalyst weight will be 60 kg. In the latter case, the PBR catalyst weight will be 200 kg.
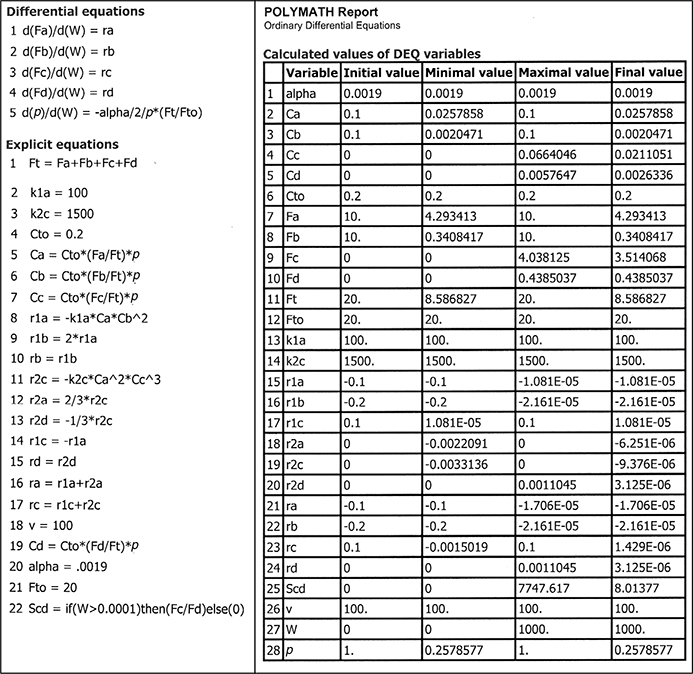
PBR Results

8.5.2 Complex Liquid-Phase Reactions in a CSTR
For a CSTR, a coupled set of algebraic equations analogous to the PFR differential equations must be solved. These equations are arrived at from a mole balance on CSTR for every species coupled with the rates step and stoichiometry. For q liquid-phase reactions occurring where N different species are present, we have the following set of algebraic equations:
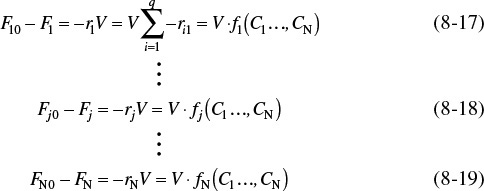
We can use a nonlinear algebraic equation solver (NLE) in Polymath or a similar program to solve Equations (8-17) through (8-19).
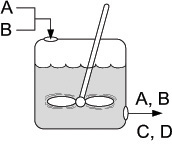
Example 8–6 Complex Reactions in a Liquid-Phase CSTR
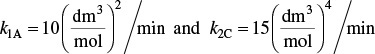
The complex reactions discussed in Example 8-5 now take place in the liquid phase in a 2,500 dm3 CSTR. The feed is equimolar in A and B with FA0 = 200 mol/min and the volumetric flow rate is 100 dm3/min. The rate constants are
A + 2B → C
2A + 3C → D
Find the concentrations of A, B, C, and D exiting the reactor, along with the exiting selectivity, ![]() .
.
Solution
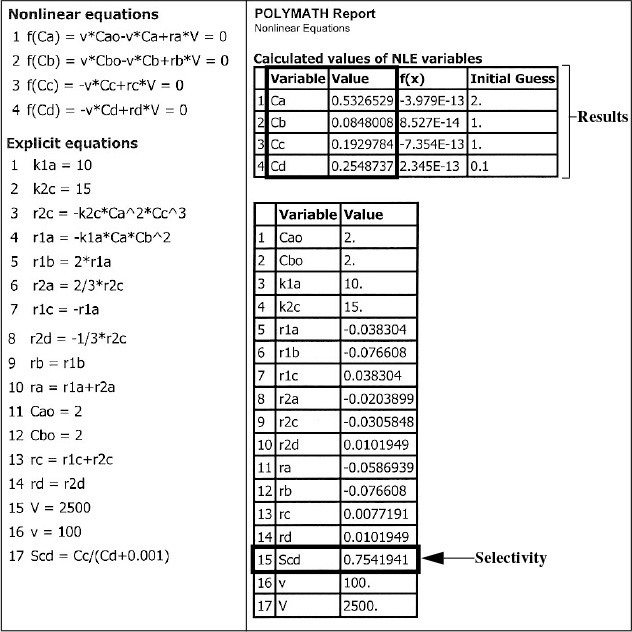
Liquid-Phase CSTR: υ = υ0 (Polymath Formulation)
Mole Balances

CSTR results
The Rate Laws, Relative Rates, and Net Rates are the same as in Example 8-5. In addition, Steps (5) through (14) (i.e., Equations (E8-5.5) through (E8-5.14) from Example 8-5) remain unchanged for this example. This fact is going to save us a lot of time in solving this example problem.
Selectivity
Note: We add a very small number (0.001 mol/min) to the term in the denominator to prevent SC/D going to infinity when FD = 0.
(16) υ0 = 100 dm3/min
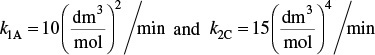
(17) k1A = 10(dm3/mol)2/min
(18) k2C = 15(dm3/mol)4/min
(19) V = 2,500 dm3
(20) CA0 = 2.0 mol/dm3
(21) CB0 = 2.0 mol/dm3
These equations are now used to solve for the exit concentrations using Polymath’s nonlinear equation solver.
Liquid-Phase CSTR
CSTR results
The exit concentrations are CA = 0.53 M, CB = 0.085 M, CC = 0.19 M, and CD = 0.25 M with ![]() = 0.75. The corresponding conversion of A is
= 0.75. The corresponding conversion of A is
Analysis: The CRE algorithm for a complex reaction carried out in a CSTR was solved using the nonlinear equation solver. The CSTR exit concentrations shown in the results table correspond to a selectivity ![]() = 0.75, as shown in the Polymath report. While the CSTR conversion is reasonable, the selectivity is rather low. The PFR is a better choice for these reactions to maximize selectivity.
= 0.75, as shown in the Polymath report. While the CSTR conversion is reasonable, the selectivity is rather low. The PFR is a better choice for these reactions to maximize selectivity.
8.5.3 Complex Liquid-Phase Reactions in a Semibatch Reactor
Next up is the application of Tables 8-1 and 8-2 to a complex reaction carried out in a semibatch reactor.
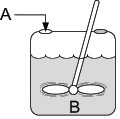
Example 8–7 Complex Reactions in a Semibatch Reactor
The complex liquid-phase reactions discussed in Example 8-6 now take place in a semibatch reactor where A is fed to B with FA0 = 3 mol/min. The volumetric flow rate is 10 dm3/min and the initial reactor volume is 1,000 dm3. The rate constants are
A + 2B → C
2A + 3C → D
The maximum volume is 2,000 dm3. The inlet concentration of A is CA0 = 0.3 mol/dm3 and the initial concentration of B is CBi = 0.2 mol/dm3.
(a) Plot and analyze NA, NB, NC, ND, and SC/D as a function of time.
Solution
Mole Balances

Semibatch Reactor
Net Rates, Rate Laws, and Relative Rates are the same as liquid-phase CSTR.
Same as Step 2 in Example 8-5, i.e., Steps (5) through (14), Equations (E8-5.5) through (E8-5.14).
Stoichiometry

Selectivity
Tricks of the Trade. Because ND is 0 at time t = 0, the selective goes to infinity so we again use an “if” statement.

Parameters
New Parameters
(21) υ0 = 10 dm3/min
(22) V0 = 1,000 dm3
(23) FA0 = 3 mol/min
Putting this information into Polymath’s ODE solver, we obtain the following results.
Semibatch Reactor
Liquid-Phase Multiple Reactions in a Semibatch Reactor

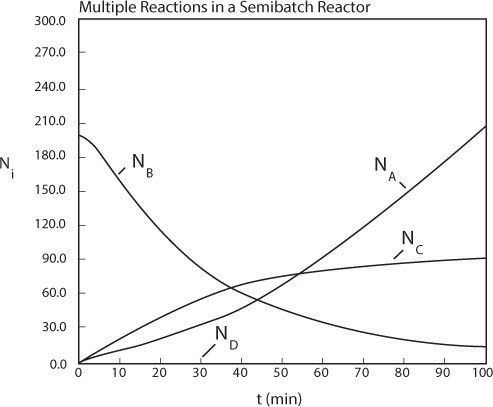

Analysis: The CRE algorithm for a complex reaction was applied to a semibatch reactor and solved using the ODE solver Polymath. The maximum in the selectivity occurs after only 6.5 minutes; however, very little of the desired product, C, has been formed at this time. If ED > EU, first try changing the temperature to see if that will improve the selectivity and the amount of product formed. If that does not work, an economical decision needs to be made. Are selectivity and the cost of separating C and D more important than making more C to sell?
One notes in Figure E8-7.1 that after 70 minutes, very little change in the number of moles of species A, C, and D takes place; however, the number of moles of B continue to increase because it is continually fed and there isn’t sufficient A to react with B. The number of moles of D produced is so small that it is indistinguishable from the x-axis in Figure E8-7.1. Finally, we note that these times, 6.5 and 10 minutes, are far too short to use a semibatch reactor and, consequently, one should consider another reactor scheme such as Figure 8-2(g), where A is fed along the length of the reactor, or analogous to that shown in Figure 8-2(h), where A is fed to each of the CSTRs.
8.6 Membrane Reactors to Improve Selectivity in Multiple Reactions
In addition to using membrane reactors (MRs) to remove a reaction product in order to shift the equilibrium toward completion, we can use membrane reactors to increase selectivity in multiple reactions. This increase can be achieved by injecting one of the reactants along the length of the reactor. It is particularly effective in partial oxidation of hydrocarbons, as well as chlorination, ethoxylation, hydrogenation, nitration, and sulfonation reactions, to name a few.2
2 W. J. Asher, D. C. Bomberger, and D. L. Huestis, Evaluation of SRI’s Novel Reactor Process PermixTM (New York: AIChE, 2000).

In the top two reactions, the desired product is the intermediate (e.g., C2H4O). However, because there is oxygen present, the reactants and intermediates can be completely oxidized to form undesired products, CO2 and water. The desired product in the bottom reaction is xylene. We can enhance selectivity by keeping one of the reactants at a low concentration, which can be achieved by feeding it through the sides of a membrane reactor.
In the solved example problem in the Expanded Material on the CRE Web site, we have used a membrane reactor (MR) for the hydrodealkylation of mesitylene reaction. In some ways, this CRE Web site example parallels the use of MRs for partial oxidation reactions. We will now do an example for a different reaction to illustrate the advantages of an MR for certain types of reactions.
Example 8–8 Membrane Reactor (MR) to Improve Selectivity in Multiple Reactions
The reactions
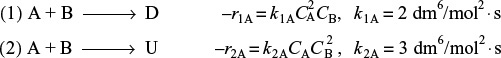
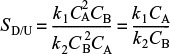
take place in the gas phase. The overall selectivities, ![]() , are to be compared for a membrane reactor (MR) and a conventional PFR.† First, we use the instantaneous selectivity to determine which species should be fed through the membrane
, are to be compared for a membrane reactor (MR) and a conventional PFR.† First, we use the instantaneous selectivity to determine which species should be fed through the membrane
† Prof. Dr. Sven Köttlov in the chemical engineering department at Jofostan University in Riça, Jofostan, is one of the best membrane analysts in that area of the world.
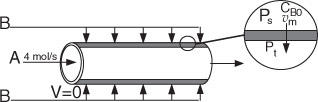
We see that to maximize SD/U, we need to keep the concentration of A high and the concentration of B low; therefore, we feed B through the membrane. The molar flow rate of A entering the reactor is 4 mol/s and that of B entering through the membrane is 4 mol/s, as shown in Figure E8-8.1. For the PFR, B enters along with A.

The reactor volume is 50 dm3 and the entering total concentration is 0.8 mol/dm3. Plot and analyze the molar flow rates and the overall selectivity, ![]() , as a function of reactor volume for both the MR and PFR.
, as a function of reactor volume for both the MR and PFR.
Solution
1. Mole Balances for Both the PFR and the MR

2. Net Rates and Rate Laws (same for PFR and MR)
3. Transport Law (MR)
The volumetric flow rate through the membrane is given by Darcy’s Law.1
1 Wilkes, J. O., Fluid Mechanics for Chemical Engineers with Microfluidics and CFD, 2nd Ed. (Upper Saddle River, NJ: Prentice Hall, 2006).
where K is the membrane permeability (m/s ⋅ kPa), Ps (kPa) and Pt (kPa) are the shell-side and tube-side pressures, and At is the membrane surface area (m2). The flow rate through the membrane can be controlled by adjusting the pressure drop across the membrane (Ps – Pt). Recall from Equation (6-5) that “a” is the membrane surface area per unit volume of reactor
The total molar flow rate of B through the sides of the reactor is

The molar flow rate of B into the side of the reactor per unit volume of reactor is
4. Stoichiometry (same for PFR and MR)
Isothermal (T = T0) and neglect pressure drop down the length of the reactor (P = P0, p = 1.0).
For no pressure drop down the length of the reactor and isothermal operation, the concentrations for both the PFR and MR are

Here, T = T0 and ΔP = 0.
The Polymath program will combine the mole balance, net rates, and stoichiometric equations to solve for the molar flow rate and selectivity profiles for both the conventional PFR and the MR, and also the selectivity profile.
A note of caution on calculating the overall selectivity
Fool Polymath!
We have to fool Polymath because at the entrance of the reactor FU = 0, Polymath will look at Equation (E8-8.17) and will not run because it will say you are dividing by zero. Therefore, we need to add a very small number to the denominator, say 0.0001 mol/s (or smaller); that is
Sketch the trends or results you expect before working out the details of the problem.
Table E8-8.1 shows the Polymath program and report sheet.

We can easily modify the program, shown in Table E8-8.1, for the PFR simply by setting RB equal to zero (RB = 0) and the initial condition for B to be 4.0.
Figures E8-8.2(a) and E8-8.2(b) show the molar flow rate profiles for the conventional PFR and MR, respectively.

Figures E8-8.3(a) and E8-8.3(b) show the selectivity for the PFR and MR. One notices the enormous enhancement in selectivity the MR has over the PFR.

Selectivities at V = 5 dm3
MR: SD/U = 14
PFR: SD/U = 0.65
Be sure to download this Living Example Problem (LEP) from the CRE Web site and play with the reactions and reactors. With minor modifications, you can explore reactions analogous to partial oxidations
where oxygen (B) is fed through the side of the membrane (see Problem P8-15C).
Analysis: One notes that A is consumed more rapidly in the PFR than in the side-fed MR and that more of the desired product is also formed in the PFR. However, the selectivity is much higher in the MR than the PFR. One also notes, when comparing the molar flow rates, that the rates in the side-fed MR continue to change significantly after 30 dm3 down the reactor, while those in the PFR do not change significantly after 30 dm3.
8.7 Sorting It All Out
In Example 8-5 we were given the rate laws and asked to calculate the product distribution profiles. The inverse of the problem described in Example 8-5 must frequently be solved. Specifically, the rate laws often must be determined from the variation in the product distribution profiles generated by changing the feed concentrations. In some instances, this determination may not be possible without carrying out independent experiments on some of the reactions in the sequence. The best strategy to use to sort out all of the rate-law parameters will vary from reaction sequence to reaction sequence. Consequently, the strategy developed for one system may not be the best approach for other multiple-reaction systems. One general rule is to start an analysis by looking for species produced in only one reaction; next, study the species involved in only two reactions, then three, and so on.
When some of the intermediate products are free radicals, it may not be possible to perform independent experiments to determine the rate-law parameters. Consequently, we must deduce the rate law parameters from changes in the distribution of reaction products with feed conditions. Under these circumstances, the analysis turns into an optimization problem to estimate the best values of the parameters that will minimize the sums of the squares between the calculated variables and measured variables. This process is basically the same as that described in Section 7.5, but more complex, owing to the larger number of parameters to be determined. We begin by estimating the parameter values using some of the methods just discussed. Next, we use these estimates in nonlinear regression techniques to determine the best estimates of our parameter values from the data for all of the experiments.3 Software packages are available for an analysis such as this one.
3 See, for example, Y. Bard, Nonlinear Parameter Estimation (San Diego, CA: Academic Press, 1974).
Nonlinear least squares

8.8 The Fun Part
I’m not talking about the fun you can have at an amusement park, but CRE fun. Now that we have an understanding on how to solve for the exit concentrations of multiple reactions in a CSTR and how to plot the species concentrations down the length of a PFR or PBR, we can address one of the most important and fun areas of chemical reaction engineering. This area, discussed in Section 8.3, is learning how to maximize the desired product and minimize the undesired product. It is this area that can make or break a chemical process financially. It is also an area that requires creativity in designing the reactor schemes and feed conditions that will maximize profits. Here, you can mix and match reactors, feed streams, and side streams, as well as vary the ratios of feed concentration in order to maximize or minimize the selectivity of a particular species. Problems of this type are what I call digital-age problems because we normally need to use ODE solvers, along with critical and creative thinking skills, to find the best answer.4 A number of problems at the end of this chapter will allow you to practice these critical and creative thinking skills. These problems offer the opportunity to explore many different solution alternatives to enhance selectivity and have fun doing it. The chemical reaction engineering students at Jofostan University in Riça, Jofostan, have often commented on how much they enjoy the LEPs and varying the parameters as they explore the problems and maximize the selective.
4 H. Scott Fogler, Teaching Critical Thinking, Creative Thinking, and Problem Solving in the Digital Age, Phillips Lecture (Stillwater, OK: OSU Press, 1997).
However, to carry CRE to the next level and to have a lot more fun solving multiple-reaction problems, we will have to be patient a little longer. The reason is that in this chapter we consider only isothermal multiple reactions, and it is nonisothermal multiple reactions where things really get interesting. Consequently, we will have to wait to carry out schemes to maximize the desired product in nonisothermal multiple reactions until we study heat effects in Chapters 11, 12, and 13. After studying these chapters, we will add a new dimension to multiple reactions, as we now have another variable, temperature, that we may or may not be able to use to affect selectivity and yield. In one particularly interesting problem (P12-27C), we will study the production of styrene from ethylbenzene in which two side reactions, one endothermic and one exothermic, must be taken into account. Here, we may vary a whole slew of variables, such as entering temperature, diluent rate, and observed optima, in the production of styrene. However, we will have to delay gratification of the styrene study until we have mastered Chapters 11 and 12.
Multiple reactions with heat effects is unique to this book
Summary
1. For the competing reactions
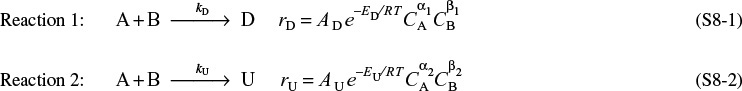
the instantaneous selectivity parameter is defined as

a. If ED > EU, the selectivity parameter SD/U will increase with increasing temperature.
b. If α1 > α2 and β2 > β1, the reaction should be carried out at high concentrations of A and low concentrations of B to maintain the selectivity parameter SD/U at a high value. Use a semibatch reactor with pure A initially or a tubular reactor in which B is fed at different locations down the reactor. Other cases discussed in the text are (α2 > α1, β1 > β2), (α2 > α1, β2 > β1), and (α1 > α2, β1 > β2).
The overall selectivity, based on molar flow rates leaving the reactor, for the reactions given by Equations (S8-1) and (S8-2) is
2. The overall yield is the ratio of the number of moles of a product at the end of a reaction to the number of moles of the key reactant that have been consumed
3. The algorithm for multiple reactions is shown in Table 8S-1. As noted earlier in this chapter, equations for the Rates Step are the major change in our CRE algorithm.
Number all reactions (1), (2), etc.
Mole balances:
Mole balance on each and every species
Rates:
Combine:
Polymath will combine all the equations for you. Thank you, Polymath!!
TABLE 8S-1 ALGORITHM FOR MULTIPLE REACTIONS
CRE Web Site Materials
• Expanded Material
1. Hydrodealkylation of Mesitylene in a PFR
2. Hydrodealkylation of Mesitylene in a CSTR
3. Calculating Concentration as a Function of Position for NH3 Oxidation in a PFR
4. Puzzle Problem “What’s Wrong with this Solution?”
• Learning Resources
1. Summary Notes
2. Web Modules
A. Cobra Bites


B. AspenTech

3. Interactive Computer Games (ICG)
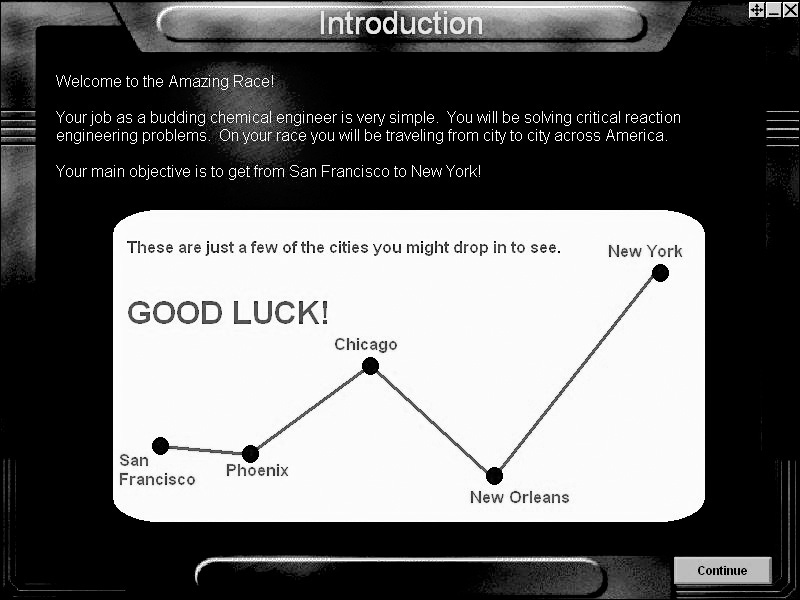
The Great Race

4. Reactor Lab. See Learning Resources at the end of Chapter 5 for a description of these interactive computer exercises.
5. Solved Problems
A. Blood Coagulation; also Living Example Problems LEP
B. Hydrodealkylation of Mesitylene in a PFR, CSTR, and Membrane Reactor; also Living Example Problems (LEPs)
C. All You Wanted to Know About Making Malic Anhydride and More; also Living Example Problems
D. Oxidation of Ammonia in a PFR; also Living Example Problems (LEP)
6. Clarification: PFR with feed streams along the length of the reactor.
• Living Example Problems (LEPs)
The LEPs are given using POLYMATH, MATLAB, and Wolfram
1. Example 8-1 Trambouzi Reaction: Taking the output from the CSTR and feeding it to a PFR to increase conversion (decrease selectivity).
2. Example 8-5 Complex Gas-Phase Reactions in a PFR
3. Example 8-6 Complex Liquid-Phase Reactions in a CSTR
4. Example 8-7 Complex Liquid-Phase Reactions in a Semibatch Reactor
5. Example 8-8 Membrane Reactor to Improve Selectivity in Multiple Reactions
6. Example Web/Web Modules: Calculating Concentrations as a Function of Position for NH3 Oxidation in a PFR (See Chapter 8 Solved Problems on the CRE Web site for problem statement.)
7. Example Web/Web Modules: Cobra Bite Problem
8. Example Web/Web Modules: Solved Problems: Blood Coagulation
9. Example Web/Web Modules: Oscillating Reactions
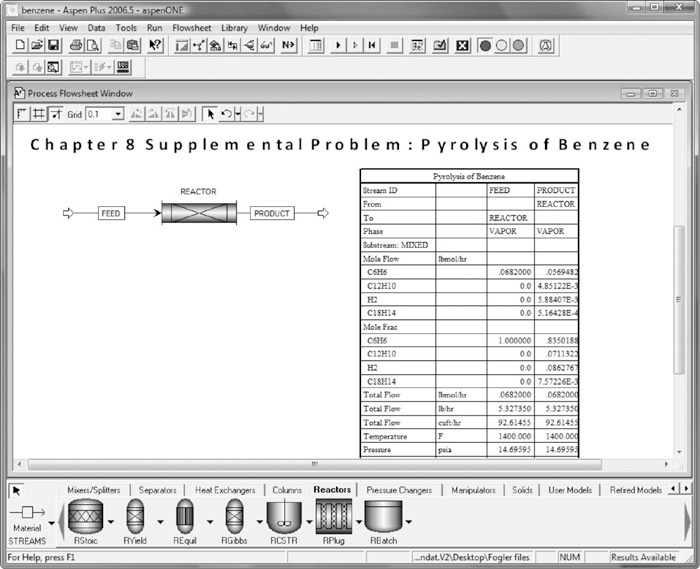
10. AspenTech Example: Pyrolysis of Benzene
• FAQ (Frequently Asked Questions) — In Updates/FAQ icon section
• Professional Reference Shelf
R8.1. Attainable Region Analysis (ARA)
The ARA allows one to find the optimum reaction system for certain types of rate laws. The example used is one of modified van de Vusse kinetics

to find the optimum with respect to B using a combination of PFRs and CSTRs.
R8.2. Oxidation of Ammonia
The coupled reactions for the oxidation of ammonia are modeled using a PFR.
Questions and Problems
The subscript to each of the problem numbers indicates the level of difficulty: A, least difficult; D, most difficult.
In each of the following questions and problems, rather than just drawing a box around your answer, write a sentence or two describing how you solved the problem, the assumptions you made, the reasonableness of your answer, what you learned, and any other facts that you want to include.

Questions
Q8-1A
(a) Reactant A has been unsuccessful in courting/dating reactant B because of a completing reaction. The matchmaker advises that the only way A will succeed is to raise the temperature. Is this a surefire idea? Will that work?
(b) Make up and solve an original problem to illustrate the principles of this chapter. See Problem P5-1A for guidelines.
(c) Write a question based on the material in this chapter that requires critical thinking. Explain why your question requires critical thinking. (Hint: See Preface Section I.)
(d) Are the overall and instantaneous selectivities identical for a CSTR, i.e., ![]() ? Also, are the instantaneous and overall yields for a CSTR equal, i.e.,
? Also, are the instantaneous and overall yields for a CSTR equal, i.e., ![]() for a CSTR?
for a CSTR?
Q8-2C Read the cobra bite Web Module on the CRE Web site.
(a) Determine how many cobra bites are necessary in order that no amount of antivenom will save the victim.
(b) Suppose the victim was bitten by a harmless snake and not bitten by a cobra and anti-venom was injected. How much antivenom would need to be injected to cause death?
(c) What is the amount and latest possible time that anti-venom can be injected after a bite, such that the victim would not die?
(d) Apply one or more of the six ideas in Preface Table P-4, page xxviii, to this problem. (Hint: The Living Example Polymath program is on the CRE Web site.)

(a) Example 8-1. (1) What are YB, ![]() , CA, CX, and CY at
, CA, CX, and CY at ![]() ? (2) What would have been the selectivity SB/XY and conversion, X, if the reaction had been carried out in a single PFR with the same volume as the CSTR? (3) How would your answers change if the pressure were increased by a factor of 100?
? (2) What would have been the selectivity SB/XY and conversion, X, if the reaction had been carried out in a single PFR with the same volume as the CSTR? (3) How would your answers change if the pressure were increased by a factor of 100?
(b) Example 8-2. Make a table/list for each reactor shown in Figure 8-2, identifying all the types of reactions that would be best carried out in this reactor. For example, Figure 8-2(d) Semibatch: used for (1) highly exothermic reactions and (2) increased selectivity.
(c) Example 8-3. How would topt change if k1 = k2 = 0.25/h at 300 K?
(d) Example 8-4. (1) What are SB/C and YB? (2) What CSTR operating temperature (with τ = 0.5s) would you recommend to maximize B for CA0 = 5 mol/dm3, k1 = 0.4 s–1 and k2 = 0.01 s–1, with E1 = 10 kcal/mol and E2 = 20 kcal/mol? (Hint: Plot CB versus T. Use Wolfram if available on your computer.)
(e) Example 8-5. Download the Living Example Problem (LEP) from the CRE Web site. Explore the problem. (1) Vary the ratio of entering flow rates of A to B to learn the effect on selectivity. (2) Do the same for volumetric flow rate. (3) How would your answers change if the first reaction were reversible ![]() with the equilibrium constant KC = 0.002 (dm3/mol)2?
with the equilibrium constant KC = 0.002 (dm3/mol)2?
(f) Example 8-6. Download the Living Example Problem (LEP) from the CRE Web site. Explore the problem and describe what you find. (Hint: Repeat (e).)
(g) Example 8-7. Download the Living Example Problem (LEP) from the CRE Web site. Vary the flow rate to learn its effect on selectivity. Feed A to B to learn how the selectivity varies.
(h) Example 8-8. Download the Living Example Problem (LEP) from the CRE Web site. (1) How would your answers change if FB0 = 2FA0? (2) If reaction (1) were A+2B → D with the rate law remaining the same? Describe what you find.
(i) AspenTech Benzene Pyrolysis Example. (1) Change the activation energies to E1 = 28 kcal/mol and E2 = 32 kcal/mol, run the AspenTech program, and describe what you find. Compare with original data. (2) Repeat (1) by changing E1 = 32 kcal/mol and E2 = 28 kcal/mol, and describe what you find. (3) Double the reactor volume and compare the molar flow rate profiles. Describe what you find.
(j) Web Example. PFR Mesitylene Reaction. Download the Living Example Problem (LEP) from the CRE Web site. (1) How would your answers change if the feed were equal molar in hydrogen and mesitylene? (2) What is the effect of ΘH on τopt? On ![]() ?
?
(k) Web Example. CSTR Mesitylene Reaction. Same question as P8-2(j).
(l) Web Example. Oxidation of Ammonia. Consider the following set of reactions:
Rate Laws Determined from Totusimetry Data (11/2/2019)

Use Wolfram to investigate the set of reactions in a PFR. Describe what you find.
(m) Read Solved Blood-Coagulation Problem. Download the Living Example Problem. (1) Plot out some of the other concentrations, such as TF-VIIa and TF-VIIaX. (2) Why do the curves look the way they do? What reaction in the cascade is most likely to be inhibited causing one to bleed to death? (3) What reactions, if eliminated, could cause one to die of a blood clot? (Hint: Look at ATIIII and/or TFPI.)
(n) Web Module Living Example: Oscillating Reactions. Use the Living Example Polymath Program for oscillating reactions on the CRE Web site. For the (IO–) and (I) reactions set k1 = 0.0001/min–1 and for reaction (1) CP0 = 0.01 mol/dm3. (1) What did you find? Look at the linearized stability analysis on the CRE Web site. (2) What factors affect the frequency and onset of the oscillations? (3) Explore and write a paragraph describing what you find. (4) Download the Living Example Polymath Program for the BZ reaction. Vary the parameters and write a paragraph describing what you find.
P8-2A Download the Interactive Computer Game (ICG) The Great Race from the CRE Web site. Play the game and then record your performance number for the module, which indicates your mastery of the material. Your professor has the key to decode your performance number. Performance #_____________________________.
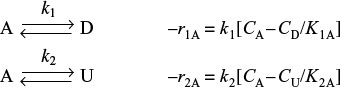
take place in a batch reactor.
k1 = 1.0 min–1, K1A = 10
k2 = 100 min–1, K2A = 1.5
CA0 = 1 mol/dm3
(Adapted from a problem by John Falconer, University of Colorado.)
(a) Plot and analyze conversion and the concentrations of A, D, and U as a function of time. When would you stop the reaction to maximize the concentration of D? Describe what you find.
(b) When does the maximum concentration of U occur? (Ans.: t = 0.31 min)
(c) What are the equilibrium concentrations of A, D, and U?
(d) What would be the exit concentrations from a CSTR with a space time of 1.0 min? Of 10.0 min? Of 100 min?
P8-4A Consider the following system of gas-phase reactions:
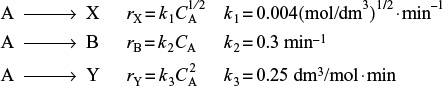
B is the desired product, and X and Y are foul pollutants that are expensive to get rid of. The specific reaction rates are at 27°C. The reaction system is to be operated at 27°C and 4 atm. Pure A enters the system at a volumetric flow rate of 10 dm3/min.
(a) Sketch the instantaneous selectivities (SB/X, SB/Y, and SB/XY = rB/(rX + rY)) as a function of the concentration of CA.
(b) Consider a series of reactors. What should be the volume of the first reactor?
(c) What are the effluent concentrations of A, B, X, and Y from the first reactor?
(d) What is the conversion of A in the first reactor?
(e) If 99% conversion of A is desired, what reaction scheme and reactor sizes should you use to maximize SB/XY?
(f) Suppose that E1 = 20,000 cal/mol, E2 = 10,000 cal/mol, and E3 = 30,000 cal/mol. What temperature would you recommend for a single CSTR with a space time of 10 min and an entering concentration of A of 0.1 mol/dm3?
(g) If you could vary the pressure between 1 and 100 atm, what pressure would you choose?
P8-5B Pharmacokinetics concerns the ingestion, distribution, reaction, and elimination reaction of drugs in the body. Consider the application of pharmacokinetics to one of the major problems we have in the United States, drinking and driving. Here, we shall model how long one must wait to drive after having a tall martini. In most states, the legal intoxication limit is 0.8 g of ethanol per liter of body fluid. (In Sweden it is 0.5 g/L, and in Eastern Europe and Russia it is any value above 0.0 g/L.)

The ingestion of ethanol into the bloodstream and its subsequent elimination can be modeled as a series reaction. The rate of absorption from the gastrointestinal tract into the bloodstream and body is a first-order reaction with a specific reaction-rate constant of 10 h–1. The rate at which ethanol is broken down in the bloodstream is limited by regeneration of a coenzyme. Consequently, the process may be modeled as a zero-order reaction with a specific reaction rate of 0.192 g/h · L of body fluid.
Suppose you immediately drank two tall martinis after arriving at a party. How long would you have to wait before your blood-alcohol concentration is below the legal limit in order to drive (a) in the United States, (b) in Sweden, and (c) in Russia? How would your answer change if (d) the drinks were taken ![]() hour apart? (e) and if the two drinks were consumed at a uniform rate during the first hour? (Ans.: (b) t = 7.8 h)
hour apart? (e) and if the two drinks were consumed at a uniform rate during the first hour? (Ans.: (b) t = 7.8 h)
(f) Suppose that one went to a party, had two tall martinis right away, and then received a phone call saying an emergency had come up and the person needed to drive home immediately. How many minutes would the individual have to reach home before he/she became legally intoxicated, assuming that the person had nothing further to drink? (g) How would your answers be different for a thin person? A heavy person? (Hint: Base all ethanol concentrations on the volume of body fluid. Plot the concentration of ethanol in the blood as a function of time.) What generalizations can you make? (h) What is the major unspoken point of this problem?
Additional information:
Ethanol in a tall martini: 40 g
Volume of body fluid: 40 L (SADD-MADD problem)
(See Web site Chapter 9 PRS R9-7 for a more in-depth look at alcohol metabolism.)
P8-6B (Pharmacokinetics) Tarzlon is a liquid antibiotic that is taken orally to treat infections of the spleen. It is effective only if it can maintain a concentration in the bloodstream (based on volume of body fluid) above 0.4 mg per dm3 of body fluid. Ideally, a concentration of 1.0 mg/dm3 in the blood should be realized. However, if the concentration in the blood exceeds 1.5 mg/dm3, harmful side effects can occur. Once the Tarzlon reaches the stomach, it can proceed in two pathways, both of which are first order: (1) It can be absorbed into the bloodstream through the stomach walls; (2) it can pass out through the gastrointestinal tract and not be absorbed into the blood. Both these processes are first order in Tarzlon’s concentration in the stomach. Once in the bloodstream, Tarzlon attacks bacterial cells and is subsequently degraded by a zero-order process. Tarzlon can also be removed from the blood and excreted in urine through a first-order process within the kidneys. In the stomach:
In the bloodstream:
One dose of Tarzlon is 250 mg in liquid form: Volume of body fluid = 40 dm3.
(a) Plot and analyze the concentration of Tarzlon in the blood as a function of time when 1 dose (i.e., one liquid capsule) of Tarzlon is taken.
(b) How should the Tarzlon be administered (dosage and frequency) over a 48-h period to be most effective? (Hint: Recall what it says on many antibiotic prescriptions regarding the first dose.)
(c) Comment on the dose concentrations and potential hazards.
(d) How would your answers change if the drug were taken on a full or empty stomach?
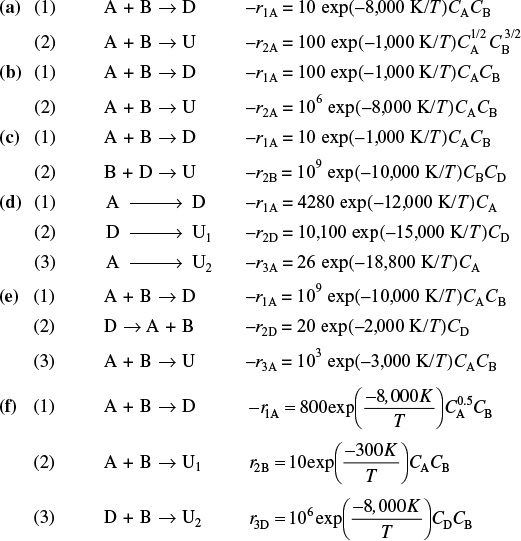
P8-7C (Reactor selection and operating conditions) For each of the following sets of reactions, describe your reactor system and conditions to maximize the selectivity to D. Make sketches where necessary to support your choices. The rates are in (mol/dm3·s), and concentrations are in (mol/dm3).
Pure A is fed to a 1.0-dm3 CSTR where it reacts to form a desired product (D), which can then react further to produce an undesired product (U); both reactions are elementary and irreversible, and everything is liquid phase. The entering concentration of A is 1 mole/dm3 at a molar flow rate of 1 mol/min.
(a) Sketch the conversion of A, X, the instantaneous selectivity of D to U, SD/U, and the instantaneous yield of D, YD, as a function of space time (make sure to label them on the plot). You may want to write a sentence or two of reasoning for partial credit purposes.
(b) If at τ = 1.0 minutes the instantaneous selectivity, SD/U, is (1/2) and the conversion of A is (0.5), what are the specific reactions rates k1 and k2?
Exam Problem
P8-9B The elementary liquid-phase series reaction
is carried out in a 500-dm3 batch reactor. The initial concentration of A is 1.6 mol/dm3. The desired product is B, and separation of the undesired product C is very difficult and costly. Because the reaction is carried out at a relatively high temperature, the reaction is easily quenched.
(a) Plot and analyze the concentrations of A, B, and C as a function of time. Assume that each reaction is irreversible, with k1 = 0.4 h–1 and k2 = 0.01 h–1.
(b) Plot and analyze the concentrations of A, B, and C as a function of time when the first reaction is reversible, with k–1 = 0.3 h–1.
(c) Plot and analyze the concentrations of A, B, and C as a function of time for the case where both reactions are reversible, with k–2 = 0.005 h–1.
(d) Compare (a), (b), and (c) and describe what you find.
(e) Vary k1, k2, k–1, and k–2. Explain the consequence of k1 > 100 and k2 < 0.1 with k–1 = k–2 = 0 and with k–2 = 1, k–1 = 0, and k–2 = 0.25.
(f) Apply one or more of the six ideas in Preface Table P-4, page xxviii, to this problem.
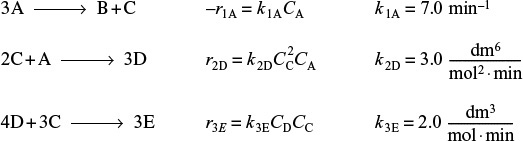
P8-10B Terephthalic acid (TPA) finds extensive use in the manufacture of synthetic fibers (e.g., Dacron) and as an intermediate for polyester films (e.g., Mylar). The formation of potassium terephthalate from potassium benzoate was studied using a tubular reactor [Ind. Eng. Chem. Res., 26, 1691].
It was found that the intermediates (primarily K-phthalates) formed from the dissociation of K-benzoate over a CdCl2 catalyst reacted with K-terephthalate in an autocatalytic reaction step

where A = K-benzoate, R = lumped intermediates (K-phthalates, K-isophthalates, and K-benzenecarboxylates), and S = K-terephthalate. Pure A is charged to the reactor at a pressure of 110 kPa. The specific reaction rates at 410°C are k1 = 1.08 × 10⁻³ s–1 with E1 = 42.6 kcal/mol, k2 = 1.19 × 10⁻³ s–1 with E2 = 48.6 kcal/mol, and k3 = 1.59 × 10⁻³ dm3/mol ⋅ s with E3 = 32 kcal/mol.
(a) Plot and analyze the concentrations of A, R, and S as a function of time in a batch reactor at 410°C, noting when the maximum in R occurs.
(b) Repeat (a) for temperatures of 430°C and 390°C.
(c) What would be the exit concentrations from a CSTR operated at 410°C and a space time of 1200 s?
P8-11A The following liquid-phase reactions were carried out in a CSTR at 325 K:
Sketch the trends or results you expect before working out the details of the problem.
The concentrations measured inside the reactor were CA = 0.10, CB = 0.93, CC = 0.51, and CD = 0.049 all in mol/dm3.
(a) What are r1A, r2A, and r3A ? (r1A = –0.7 mol/dm3 · min)
(b) What are r1B, r2B, and r3B ?
(c) What are r1C, r2C, and r3C ? (r1C = 0.23 mol/dm3 · min)
(d) What are r1D, r2D, and r3D ?
(e) What are r1E, r2E, and r3E ?
(f) What are the net rates of formation of A, B, C, D, and E?
(g) The entering volumetric flow rate is 100 dm3/min and the entering concentration of A is 3 M. What is the CSTR reactor volume? (Ans.: 400 dm3.)
(h) What are the exit molar flow rates from the 400 dm3 CSTR?
Note: The following parts require an ODE solver and are of “B level” difficulty.
(i) PFR. Now assume the reactions take place in the gas phase. Use the preceding data to plot the molar flow rate’s selectivity and p as a function of PFR volume up to 400 dm3. The pressure-drop parameter is 0.001 dm–3, the total concentration entering the reactor is 0.2 mol/dm3, and υ0 = 100 dm3/min. What are ![]() and
and ![]() ?
?
(j) Membrane Reactor. Repeat (i) when species C diffuses out of a membrane reactor and the transport coefficient, kC, is 10 min–1. Compare your results with part (i).
P8-12B In this problem, the complex reactions described below will first be carried out in the liquid phase (parts (a) through (d)) and then in the gas phase (parts (e) through (g)). One need not solve the liquid phase to solve the gas-phase problems.
The following reactions are carried out isothermally.

Additional information:
(a) Consider the reactions to be liquid phase and plot the species concentrations and the conversion of A as a function of the distance (i.e., volume) down a 50-dm3 PFR. Note any maxima.
(b) Consider the reactions to be liquid phase and determine the effluent concentrations and conversion from a 50-dm3 CSTR. (Ans.: CA = 0.61, CB = 0.79, CF = 0.25, and CD = 0.45 mol/dm3.)
(c) Plot and analyze the species concentrations and the conversion of A as a function of time when the reaction is carried out in a semibatch reactor initially containing 40 dm3 of liquid. Consider two cases: (1) A is fed to B, and (2) B is fed to A. What differences do you observe for these two cases? Describe what you find.
(d) Vary the ratio of B to A (1 < ΘB < 10) in the feed to the PFR and describe what you find. What generalizations can you make from this problem?
(e) Rework (a) for the case when the reaction is a gas-phase reaction. We will keep the constants the same so you won’t have to make too many changes in your Polymath program, but we will make υ0 = 100 dm3/min, CT0 = 0.4 mol/dm3, V = 500 dm3, and an equalmolar feed of A and B. Plot the molar flow rates and SC/D and SE/F down a PFR. Describe what you find.
(f) Repeat (e) when D diffuses out through the sides of a membrane reactor where the mass-transfer coefficient, kCD, can be varied between 0.1 min–1 and 10 min–1. What trends do you find?
(g) Repeat (e) when B is fed through the sides of a membrane reactor. Describe what you find.
P8-13B The gas-phase reactions take place isothermally in a membrane reactor packed with catalyst. Pure A enters the reactor at 24.6 atm and 500 K, and a flow rate of A of 10 mol/min.

Only species B diffuses out of the reactor through the membrane.
Additional Information:
Overall mass-transfer coefficient kC = 1.0 dm3 / kg-cat ⋅ min
k1C = 2 dm3 / kg-cat ⋅ min
K1C = 0.2 mol / dm3
k2D = 0.4 dm3 / kg-cat ⋅ min
k3E = 5.0 dm3 / mol2 ⋅ kg-cat ⋅ min
Wf = 100 kg
α = 0.008 kg–1
(a) Plot and analyze the concentrations down the length of the reactor.
(b) Explain why your curves look the way they do.
(c) Describe the major differences you observe when C diffuses out instead of B, with the same mass-transfer coefficient.
(d) Vary some of the parameters (e.g., kB, k1C, K1C) and write a paragraph describing what you find.
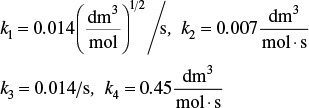
P8-14B The complex reactions involved in the oxidation of formaldehyde to formic acid over a Vanadium titanium oxide catalyst [Ind. Eng. Chem. Res. 28, p. 387 (1989)] are shown below. Each reaction follows an elementary rate law.
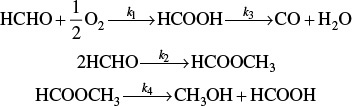
Let A = HCHO, B = O2, C = HCOOH, D = HCOOCH3, E = CO, W = H2O, and G = CH3OH.
The entering flow rates are FA0 = 10 mol/s and FB0 = 5 mol/s, and υ0 = 100 dm3/s. At a total entering concentration CT0 = 0.147 mol/dm3, the suggested reactor volume is 1,000 dm3.
At 300 K
(a) Plot the molar flow rates of each species along the volume (length) of the reactor on the same figure and then analyze why the profiles look the way they do.
(b) Plot and analyze ![]() ,
, ![]() ,
, ![]() , and
, and ![]() along the length of the reactor. Note and explain any maximums and the volume at which they occur.
along the length of the reactor. Note and explain any maximums and the volume at which they occur.
(c) Plot and analyze the overall HCOOH yield and overall selectivity of HCOH to CO, of HCOOCH3 to CH3OH, and of HCOOH to HCOOCH3 as a function of the ΘO2. Suggest some conditions to best produce formic acid. Write a paragraph describing what you find.
(d) Compare your plot in part (a) with a similar plot when pressure drop is taken into account with α = 0.002 dm–3. Note any unusual differences between parts (a) and (d).
(e) Suppose that E1 = 10,000 cal/mol, E2 = 30,000 cal/mol, E3 = 20,000 cal/mol, and E4 = 10,000 cal/mol, what temperature would you recommend for a 1000-dm3 PFR?
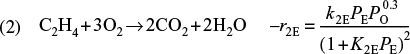
P8-15C The ethylene epoxydation is to be carried out using a cesium-doped silver catalyst in a packed-bed reactor.
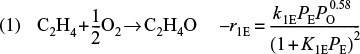
Along with the desired reaction, the complete combustion of ethylene also occurs
[M. Al-Juaied, D. Lafarga, and A. Varma, Chem. Eng. Sci. 56, 395 (2001)].
It is proposed to replace the conventional PBR with a membrane reactor in order to improve the selectivity. As a rule of thumb, a 1% increase in the selectivity to ethylene oxide translates to an increase in profit of about $2 million/yr. The feed consists of 12% (mole) oxygen, 6% ethylene, and the remainder nitrogen at a temperature of 250°C and a pressure of 2 atm. The total molar flow rate is 0.0093 mol/s to a reactor containing 2 kg of catalyst.
Additional information:

(a) What conversion and selectivity of ethylene epoxide to CO2 are expected in a conventional PBR?
(b) What would be the conversion and selectivity if the total molar flow rate were divided and the 12% oxygen stream (no ethylene) were uniformly fed through the sides of the membrane reactor, and 6% ethylene (no oxygen) were fed at the entrance?
(c) Repeat (b) for a case when ethylene is fed uniformly through the sides and oxygen is fed at the entrance. Compare with parts (a) and (b). Describe what you find.
P8-16B Solar energy capture has great potential to help meet the world’s growing energy demand, which is 12 terawatts in 2010 and is expected to rise to 36 terawatts in 2050 (cf. P3-15B). Professor Al Weiner and his students at the University of Colorado are engaged in developing methods of utilizing solar-thermal energy. In solar-thermal reactors, mirrors are used to focus and concentrate the sun’s energy on a flow-type cavity reactor where temperatures as high as 1200°C can be realized, as shown below.

Figure P8-16.1 Solar field design. Five 265-m-tall towers with three heliostat fields/tower, on 275 acres of land in Daggett, CA. Net concentration 3,868 suns and 295 MW delivered to each solar reactor. (Melinda M. Channel, Jonathan Scheffe, Allan Lewandowski, and Alan W. Weimer, November 11, 2009. Also see: Chemical Engineering, 116, p. 18, March 2009).
The switch grass is fed to the 1200°C solar-thermal reactor. At these temperatures, biomass can be converted to CO and H2, i.e., syn gas, which then can be used for liquid fuels. Switch grass, which is approximately ![]() cellulose (C6H10O5) and
cellulose (C6H10O5) and ![]() lignin (C10H12O3) will be fed with steam to produce CO, H2 and a small amount of ash, which we will neglect. In order to simplify this process into a tractable home problem, we assume the switch grass is volatilized immediately upon entering the plug-flow reactor and that the reactions and postulated rate laws are
lignin (C10H12O3) will be fed with steam to produce CO, H2 and a small amount of ash, which we will neglect. In order to simplify this process into a tractable home problem, we assume the switch grass is volatilized immediately upon entering the plug-flow reactor and that the reactions and postulated rate laws are
(1) Cellulose: C6H10O5 (C) + H2O(W) → 6H2 + 6CO
(2) Lignin: C10 H12O3 (L) + 7H2O(W) → 13H2 + 10CO
[AIChE J. 55, p. 286 (2009)]. Also see Science p. 326, 1472 (2009).
The rate laws and constants are hypothesized to be

Total gas concentration in the feed and reactor with ![]() with the entering molar flow rates of cellulose, lignin, and water are FC0 = 0.00411 mol/s and FL0 = 0.00185 mol/s, FW0 = 0.02 mol/s, respectively.
with the entering molar flow rates of cellulose, lignin, and water are FC0 = 0.00411 mol/s and FL0 = 0.00185 mol/s, FW0 = 0.02 mol/s, respectively.
(a) Plot and analyze the molar flow rates as a function of PFR volume up to V = 0.417 dm3.
(b) Plot and analyze YC, YW, YL, and ![]() down the reactor. Describe what you find.
down the reactor. Describe what you find.
(c) Repeat (a) for different molar flow rates of water.
P8-17B Solar-thermal biochar gasification has also been studied at the University of Colorado (see P8-16B). [Chemical Engineering and Processing: Process Intensification 48, p. 1279 (2009) and AIChE J. 55 p.286 (2009).] While this process follows a shrinking core model (see the Expanded Material for Chapter 14 on the CRE Web site), for the purposes of this example, we will use the following sequence:
(1) Lignin: C10 H12O3 (L) + 3H2O(W) → 3H2 + 3CO + Char (e.g., cresol)
(2) Char: Char(Ch) + 4H2O → 10H2 + 7CO
The rate laws at 1200°C are hypothesized to be
The entering molar flow rates are FL0 = 0.0123 mol/s, FW0 = 0.111 mol/s, the total entering concentration is CT0 = 0.2 mol/dm3, and the reactor volume is 0.417 dm3.
(a) Plot and analyze FCh, FL, FW, FCO, and FH2 down the length of a plug-flow reactor.
(b) Repeat (a) for the concentrations CC, CCh, etc.
(c) Plot and analyze the selectivity ![]() and yields
and yields ![]() and YL down the PFR.
and YL down the PFR.
(d) At what point is the char molar flow rate a maximum? How does it change with changing feed conditions, such as the ratio of (FW0/FL0), CT0, etc? Describe what you found in parts (a) through (d).
P8-18A Go to Professor Herz’s Reactor Lab on the CRE Web site at www.reactorlab.net.
(a) Download Division 5, Lab 2 of the Reactor Lab from the CRE Web site for the selective oxidation of ethylene to ethylene oxide. Click the [i] info button to get information about the system. Perform experiments and develop rate equations for the reactions. Write a technical memo that reports your results and includes plots and statistical measurements of how well your kinetic model fits experimental data.
(b) Download Division 5, Labs 3 and 4 of the Reactor Lab for batch reactors in which parallel and series reactions, respectively, can be carried out. Investigate how dilution with solvent affects the selectivity for different reaction orders and write a memo describing your findings.
• Additional Homework Problems
A number of homework problems that can be used for exams or supplementary problems or examples are found on the CRE Web site, http://www.umich.edu/~elements/5e/index.html.
Supplementary Reading
1. Selectivity, reactor schemes, and staging for multiple reactions, together with evaluation of the corresponding design equations, may or may not be presented in
BURGESS, THORNTON W., The Adventures of Chatterer the Red Squirrel, New York: Dover Publications, Inc., 1915.
BUTT, JOHN B, Reaction Kinetics and Reactor Design, Second Edition, Revised and Expanded, New York: Marcel Dekker, Inc., 1999.
DENBIGH, K. G., and J. C. R. TURNER, Chemical Reactor Theory, 2nd ed. Cambridge: Cambridge University Press, 1971, Chap. 6.
2. Many analytical solutions for parallel, series, and combination reactions are presented in
WALAS, S. M., Chemical Reaction Engineering Handbook of Solved Problems. Newark, NJ: Gordon and Breach, 1995.