15. Diffusion and Reaction
Research is to see what everybody else sees, and to think what nobody else has thought.
—Albert Szent-Gyorgyi
15.1 Diffusion and Reactions in Homogeneous Systems
For homogeneous systems, the mole balance on species A, Equation (14-2), for one-dimensional diffusion at steady state is
For diffusion through a stagnant film at dilute concentrations, Equation (14-9) becomes
Substituting in Equation (14-2) one obtains

Understanding and modeling diffusion with chemical reaction is not only important for industrial catalysts but also has many other applications. These applications include medicine, cancer treatment using drug laced particulates, and, as shown in the Expanded Material on the CRE Web site (www.umich.edu/~elements/5e/index.html), tissue engineering. In P15-15B, we discuss the diffusion and reaction of oxygen in cartilage.
We will now discuss solid-gas catalytic reactions and diffusion limitation in catalyst pellets.
15.2 Diffusion and Reactions in Spherical Catalyst Pellets
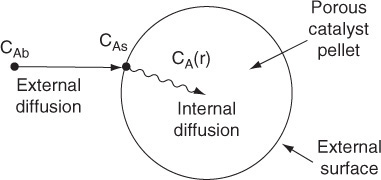
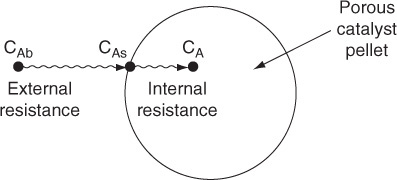
The following sections of this chapter will focus solely on the transport and reaction in heterogeneous systems with catalyst pellets. In a heterogeneous reaction sequence, mass transfer of reactants must first take place from the bulk fluid to the external surface of the pellet. The reactants then diffuse from the external surface into and through the pores within the pellet (CAs > CA(r)), with reaction taking place only on the catalytic surface of the pores. A schematic representation of this two-step diffusion process is shown in Figures 10-6, 14-1, and 15-1.
In Chapter 14 we discussed external diffusion. In this section we will discuss internal diffusion and develop the internal effectiveness factor for spherical catalyst pellets. The development of models that treat individual pores and pellets of different shapes is undertaken in the problems at the end of this chapter. We will first look at the internal mass transfer resistance to either the reaction products or reactants that occurs between the external pellet surface and the interior of the pellet. To illustrate the salient principles of this model, we consider the irreversible isomerization
that occurs on the surface of the pore walls within the spherical pellet of radius R.
15.2.1 Effective Diffusivity
To reach the inner surface, the reactant A must diffuse from a higher reactant concentration at the pellet external surface into and through the pores of pellets which are at a lower concentration as shown in Figure 15-1.
The pores in the pellet are not straight and cylindrical; rather, they are a series of tortuous, interconnecting paths of pore bodies and pore throats with varying cross-sectional areas. It would not be fruitful to describe diffusion within each and every one of the tortuous pathways individually; consequently, we shall define an effective diffusion coefficient so as to describe the average diffusion taking place at any interior position r in the pellet. We shall consider only radial variations in the concentration; the radial flux WAr will be based on the total area (voids and solid) normal to diffusion transport (i.e., 4πr2) rather than void area alone. This basis for WAr is made possible by proper definition of the effective diffusivity De.
The effective diffusivity accounts for the fact that:
1. Not all of the area normal to the direction of the flux is available (i.e., the area occupied by solids) for the molecules to diffuse.
2. The paths are tortuous.
3. The pores are of varying cross-sectional areas.
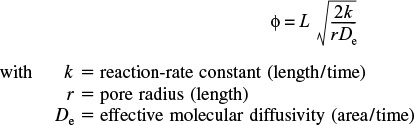
An equation that relates the effective diffusivity De to either the bulk diffusivity DAB or the Knudsen diffusivity DK is
The effective diffusivity
where

1 Some investigators lump the constriction factor and tortuosity into one factor, called the tortuosity factor, and set it equal to ![]() . See C. N. Satterfield, Mass Transfer in Heterogeneous Catalysis (Cambridge, MA: MIT Press, 1970), pp. 33–47.
. See C. N. Satterfield, Mass Transfer in Heterogeneous Catalysis (Cambridge, MA: MIT Press, 1970), pp. 33–47.
The constriction factor, σc, accounts for the variation in the cross-sectional area that is normal to diffusion.2 It is a function of the ratio of maximum to minimum pore areas (Figure 15-2(a)). When the two areas, A1 and A2, are equal, the constriction factor is unity, and when β = 10, the constriction factor is approximately 0.5.
2 See E. E. Petersen, Chemical Reaction Analysis (Upper Saddle River, NJ: Prentice Hall, 1965), Chap. 3; C. N. Satterfield and T. K. Sherwood, The Role of Diffusion in Catalysis (Reading, MA: Addison-Wesley, 1963), Chap. 1.

Example 15–1 Finding the Effective Diffusivity De
Using typical values of DAB, ϕ p, σc, and τ, estimate the effective diffusivity, De.
Solution
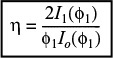
First, calculate the tortuosity for the hypothetical pore of length, L (Figure 15-2(b)), from the definition of ![]() .
.
The shortest distance between points A and B for the idealized pore shown in Figure 15-2(b) is ![]() . The actual distance the molecule travels from A to B is 2L.
. The actual distance the molecule travels from A to B is 2L.
Although this value is reasonable for ![]() , values for
, values for ![]() to 10 are not uncommon. Typical values of the constriction factor, the tortuosity, and the pellet porosity are, respectively, σc = 0.8,
to 10 are not uncommon. Typical values of the constriction factor, the tortuosity, and the pellet porosity are, respectively, σc = 0.8, ![]() , and ϕp = 0.40. A typical value of the gas = phase diffusivity is DAB = 10–6 m2/s.
, and ϕp = 0.40. A typical value of the gas = phase diffusivity is DAB = 10–6 m2/s.
Using these values in Equation (15-1)

De = 0.1 • 10–6 m2/s = 10–7 m2/s
Analysis: The purpose of this example was to give an understanding of tortuosity and help the reader understand how it decreases De. We also see that a representative value of the effective diffusivity in the porous pellet is 10% of the gas-phase diffusivity.
15.2.2 Derivation of the Differential Equation Describing Diffusion and Reaction in a Single Catalyst Pellet
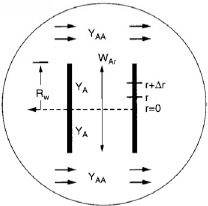
We now perform a steady-state mole balance on species A as it enters, leaves, and reacts in a spherical shell of inner radius r and outer radius r + Δr of the pellet (Figure 15-3). Note that even though A is diffusing inward toward the center of the pellet, the convention of our shell balance dictates that the flux be in the direction of increasing r. We choose the flux of A to be positive in the direction of increasing r (i.e., the outward direction). Because A is actually diffusing inward, the flux of A will have some negative value, such as (–10 mol/m2 · s), indicating that the flux is actually in the direction of decreasing r.
First, we will derive the concentration profile of reactant A in the pellet.
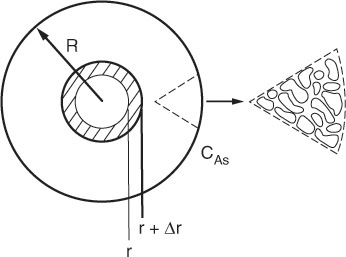
We now proceed to perform our shell balance on A. The area that appears in the balance equation is the total area (voids and solids) normal to the direction of the molar flux shown by the arrows in Figure 15-3.
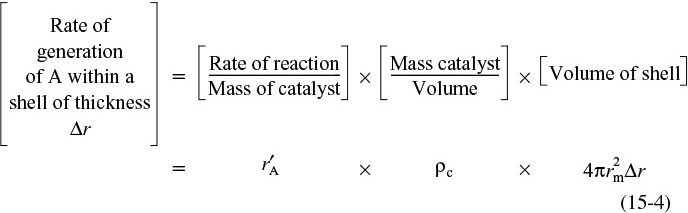
Mole balance for diffusion and reaction inside the catalyst pellet
where rm is some mean radius between r and r + Δr that is used to approximate the volume ΔV of the shell, and ρc is the density of the pellet.
The mole balance over the shell thickness Δr is
Mole balance

After dividing by (–4π Δr) and taking the limit as Δr → 0, we obtain the following differential equation
Because 1 mol of A reacts under conditions of constant temperature and pressure to form 1 mol of B, we have Equal Molar Counter Diffusion (EMCD) at constant total molar concentration (Section 14.2.1) and, therefore
The flux equation
where CA is the number of moles of A per dm3 of open-pore volume (i.e., volume of gas) as opposed to (mol/vol of gas and solids). In systems where we do not have EMCD in catalyst pores, it may still be possible to use Equation (15-7) if the reactant gases are present in dilute concentrations.
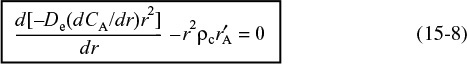
After substituting Equation (15-7) into Equation (15-6), we arrive at the following differential equation describing diffusion with reaction in a catalyst pellet
We now need to incorporate the rate law. In the past, we have based the rate of reaction in terms of either per unit volume
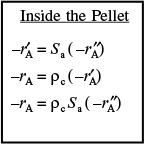
or per unit mass of catalyst
When we study reactions on the internal surface area of catalysts, the rate of reaction and rate law are often based on per unit surface area
As a result, the surface area of the catalyst per unit mass of catalyst
Sa [=] (m2/g-cat)
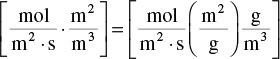
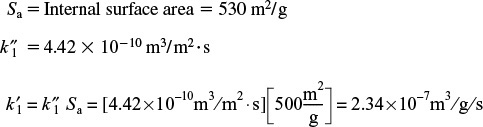
is an important property of the catalyst. The rate of reaction per unit mass of catalyst, ![]() , and the rate of reaction per unit surface area of catalyst are related through the equation
, and the rate of reaction per unit surface area of catalyst are related through the equation

Sa: 10 grams of catalyst may cover as much surface area as a football field.
A typical value of Sa might be 150 m2/g of catalyst.
The rate law
As mentioned previously, at high temperatures, the denominator of the catalytic rate law often approaches 1 as discussed in Section 10.3.7. Consequently, for the moment, it is reasonable to assume that the surface reaction is of nth order in the gas-phase concentration of A within the pellet
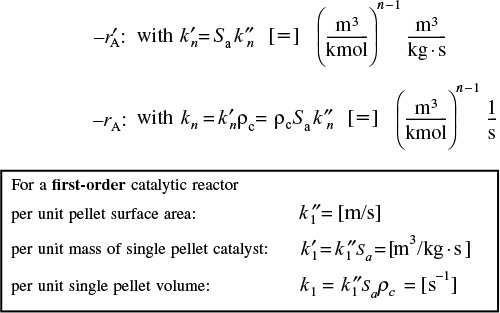
where the units of the rate constants for –rA, ![]() , and
, and ![]() are
are
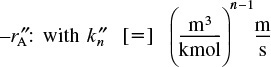
Similarly,
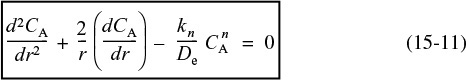
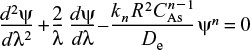
Substituting the rate-law equation (15-9) into Equation (15-8) gives
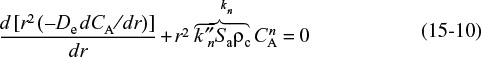
Differential equation and boundary conditions describing diffusion and reaction in a catalyst pellet
Letting kn represent the terms under the bracket, differentiating the first term and dividing through by –r2De, Equation (15-10) becomes
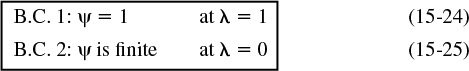
The boundary conditions are:
1. The concentration remains finite at the center of the pellet
2. At the external surface of the catalyst pellet, the concentration is CAs
15.2.3 Writing the Diffusion with the Catalytic Reaction Equation in Dimensionless Form
We now introduce dimensionless variables ψ and λ so that we may arrive at a parameter that is frequently discussed in catalytic reactions, the Thiele modulus. Let
With the transformation of variables, the boundary condition
becomes
and the boundary condition
becomes
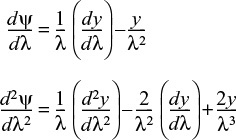
We now rewrite the differential equation for the molar flux in terms of our dimensionless variables. Starting with
we use the chain rule to write
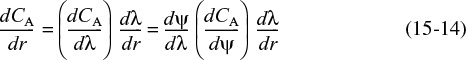
Then differentiate Equation (15-12) with respect to ψ and Equation (15-13) with respect to r, and substitute the resulting expressions
into Equation (15-14) to obtain
The flux of A in terms of the dimensionless variables, ψ and λ, is

The total rate of consumption of A inside the pellet, MA (mol/s)
At steady state, the net flow of species A that enters into the pellet at the external pellet surface reacts completely within the pellet. The overall rate of reaction is therefore equal to the total molar flow of A into the catalyst pellet. The overall rate of reaction, MA (mol/s), can be obtained by multiplying the molar flux into the pellet at the outer surface by the external surface area of the pellet, 4πR2

All the reactant that diffuses into the pellet is consumed (a black hole).
Consequently, to determine the overall rate of reaction, which is given by Equation (15-17), we first solve Equation (15-11) for CA, differentiate CA with respect to r, and then substitute the resulting expression into Equation (15-17).
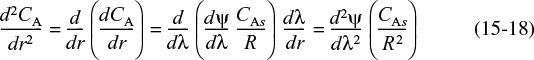
Differentiating the concentration gradient, Equation (15-15), yields
After dividing by CAs/R2, the dimensionless form of Equation (15-11) is written as
Then
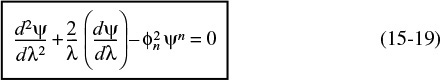
Dimensionless form of equations describing diffusion and reaction
where
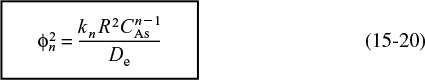
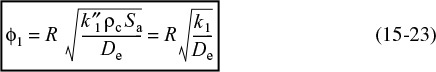
The square root of the coefficient of ψn in Equation 15-19 (i.e., ϕn) is called the Thiele modulus (pronounced th ![]() –l
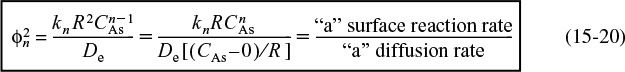
–l ![]() ). The Thiele modulus, ϕn, will always contain a subscript (e.g., n), which refers to the reaction order and distinguishes this symbol from the symbol for porosity, ϕ, used in the Ergun pressure drop equation and defined in Chapter 5, which has no subscript. The quantity
). The Thiele modulus, ϕn, will always contain a subscript (e.g., n), which refers to the reaction order and distinguishes this symbol from the symbol for porosity, ϕ, used in the Ergun pressure drop equation and defined in Chapter 5, which has no subscript. The quantity ![]() is a measure of the ratio of “a” surface reaction rate to “a” rate of diffusion through the catalyst pellet
is a measure of the ratio of “a” surface reaction rate to “a” rate of diffusion through the catalyst pellet
Thiele modulus
When the Thiele modulus is large, internal diffusion usually limits the overall rate of reaction; when ϕn is small, the surface reaction is usually rate-limiting. If, for the first order reaction
A → B
Limiting conditions:
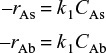
the reaction were surface reaction rate limited with respect to the adsorption of A and desorption of B, and if A and B were weakly adsorbed (i.e., low surface coverage), we can write the apparent first-order reaction rate law per unit volume of pellet as
–rA = k1CA
where k1 is the rate constant for a single catalyst pellet.
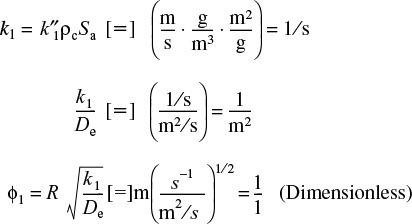
Recalling k1 = Saρck″ we could also write the rate in terms of pellet catalytic surface area (mol/m2•s)

The units of ![]() are m3/m2 s (= m/s).
are m3/m2 s (= m/s).
For a first-order reaction, Equation (15-19) becomes
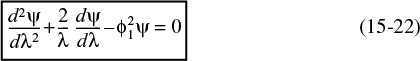
the Thiele modulus for this first-order reaction is
where
The boundary conditions are
15.2.4 Solution to the Differential Equation for a First-Order Reaction
Differential equation (15-22) is readily solved with the aid of the transformation y = ψλ:
With these transformations, Equation (15-22) reduces to
This differential equation has the following solution (see Appendix A.3):
y = A1 cosh ϕ1λ + B1 sinh ϕ1λ
In terms of ψ,
The arbitrary constants A1 and B1 can easily be evaluated with the aid of the boundary conditions. At λ = 0, cosh ϕ1λ → 1, (1/λ) → ∞, and sinh ϕ1λ → 0. Because the second boundary condition requires ψ to be finite at the center (i.e., λ = 0), therefore A1 must be zero.
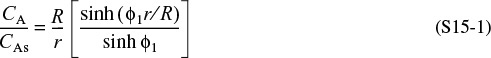
The constant B1 is evaluated from B.C. 1 (i.e., ψ = 1, λ = 1) and the dimensionless concentration profile is
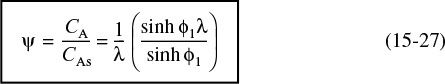
Concentration profile
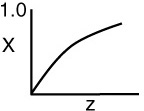
Figure 15-4 shows the concentration profile for three different values of the Thiele modulus, ϕ1 . Small values of the Thiele modulus indicate surface reaction controls and a significant amount of the reactant diffuses well into the pellet interior without reacting. As a result, the concentration profile is very shallow, with the concentration at the center of the pellet being close to that at the external surface. That is, virtually the entire internal surface is accessible to the reactant concentration CAs. Large values of the Thiele modulus indicate that the surface reaction is rapid and that the reactant is consumed very close to the external pellet surface and very little penetrates into the interior of the pellet. Consequently, if the porous pellet is to be plated with a precious metal catalyst (e.g., Pt), it should only be plated in the immediate vicinity of the external surface when large values of ϕn characterize the diffusion and reaction. That is, it would be a waste of the precious metal to plate the entire pellet when internal diffusion is limiting because the reacting gases are consumed near the outer surface. Consequently, the reacting gases would never contact the center portion of the pellet.
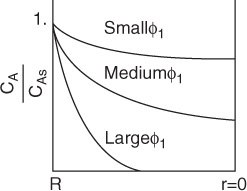
For large values of the Thiele modulus, internal diffusion limits the rate of reaction.
15.3 The Internal Effectiveness Factor
In Figure 15-4 we saw that the concentration varied with the pellet radius. Consequently, for all but zero-order reactions, the rate will also vary throughout the pellet. In order to account for this variation in rates, we introduce the internal effectiveness factor.
15.3.1 Isothermal First-Order Catalytic Reactions
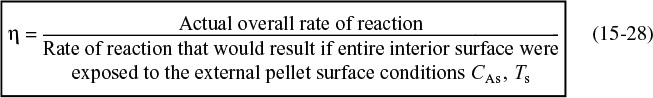
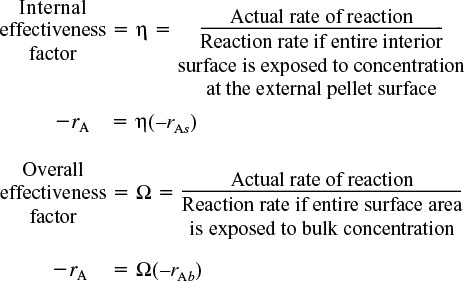
The magnitude of the effectiveness factor (ranging from 0 to 1) indicates the relative importance of diffusion and reaction limitations. The internal effectiveness factor is defined as
η is a measure of how far the reactant diffuses into the pellet before reacting.
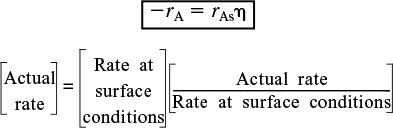
The overall rate, ![]() , is also referred to as the observed rate of reaction [–rA (obs)]. In terms of symbols, the effectiveness factor is
, is also referred to as the observed rate of reaction [–rA (obs)]. In terms of symbols, the effectiveness factor is

To derive the effectiveness factor for a first-order reaction, it is easiest to work in reaction rates of moles per unit time, MA, rather than in moles per unit time per volume of catalyst (i.e., –rA)
First, we shall consider the denominator, MAs . If the entire surface were exposed to the concentration at the external surface of the pellet, CAs, the rate for a first-order reaction would be
The subscript s indicates that the rate –rAs is evaluated at the conditions (e.g., concentration, temperature) present at the external surface of the pellet (i.e., λ = 1).
The actual rate of reaction is the rate at which the reactant diffuses into the pellet at the outer surface; that is, all of A that diffuses into the pellet at the outer surface reacts and no A diffuses back out. (It behaves as a “black hole.”) We recall Equation (15-17) on page 727 for the actual rate of reaction
The actual rate of reaction
Differentiating Equation (15-27) and then evaluating the result at λ = 1 yields

Substituting Equation (15-30) into (15-17) gives us
We now substitute Equations (15-29) and (15-31) into Equation (15-28) to obtain an expression for the effectiveness factor
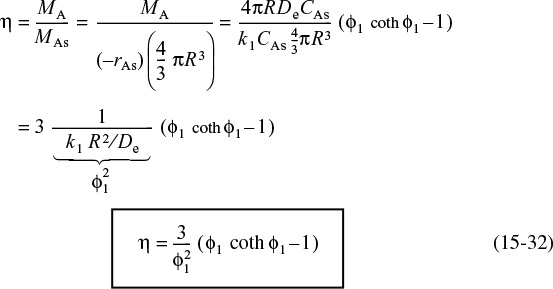
Internal effectiveness factor for a first-order reaction in a spherical catalyst pellet
A plot of the effectiveness factor as a function of the Thiele modulus is shown in Figure 15-5. Figure 15-5(a) shows η as a function of the Thiele modulus, ϕs, for a spherical catalyst pellet for reactions of zero, first, and second order. Figure 15-5(b) corresponds to a first-order reaction occurring in three differently shaped pellets of volume Vp and external surface area Ap, and where the Thiele modulus for a first-order reaction, ϕ1, is defined differently for each shape. When volume change accompanies a reaction (i.e., ε ≠ 0), the corrections shown in Figure 15-6 apply to the effectiveness factor for a first-order reaction.
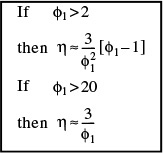
We observe that as the particle diameter becomes very small, ϕn decreases, so that the effectiveness factor approaches 1 and the reaction is surface reaction-limited. On the other hand, when the Thiele modulus ϕn is large (e.g., ![]() 30), the internal effectiveness factor η is small (e.g.,
30), the internal effectiveness factor η is small (e.g., ![]() 0.1), and the reaction is diffusion-limited within the pellet. Consequently, factors influencing the rate of external mass transport such as fluid velocity will have a negligible effect on the overall reaction rate when the reaction is either internal surface reaction rate limited or internal diffusion limited. For large values of the Thiele modulus, the effectiveness factor can be written as
0.1), and the reaction is diffusion-limited within the pellet. Consequently, factors influencing the rate of external mass transport such as fluid velocity will have a negligible effect on the overall reaction rate when the reaction is either internal surface reaction rate limited or internal diffusion limited. For large values of the Thiele modulus, the effectiveness factor can be written as

Figure 15-5 (a) Effectiveness factor plot for nth-order kinetics on spherical catalyst particles. [Satterfield, C. N. “Mass Transfer in Heterogeneous Catalysis,” AIChE Journal 16(3) 509–510 (1970). With permission of the American Institute of Chemical Engineers. Copyright © 1970 AIChE. All rights reserved.] (b) First-order reaction in different pellet geometrics. [Aris, R. Introduction to the Analysis of Chemical Reactors, 1965, p. 131; reprinted by permission of Pearson Education, Upper Saddle River, NJ.]

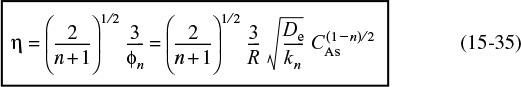
To express the overall rate of reaction in terms of the Thiele modulus, we rearrange Equation (15-28) and use the rate law for a first-order reaction in Equation (15-29)
For a first-order reaction
Combining Equations (15-33) and (15-34), the overall rate of reaction for a first-order, internal-diffusion-limited reaction is
Note that for catalytic packed beds the rate varies inversely with the particle diameter of the catalyst.
15.3.2 Effectiveness Factors with Volume Change with Reaction
When there is volume change, ε ≠ 0, we use a correction factor to account for this change. The correction is obtained from a plot of the ratio of effective factors
as a function of ε for various values of the Thiele modulus. This plot is given in Figure 15-6.
For example, if the Thiele modulus were 10 for the gas-phase reaction A → 2B with (ε = 1) then the effectiveness factor with volume change would be η′ = 0.8η .
How can the rate of reaction be increased?
15.3.3 Internal Diffusion Limited Reactions Other Than First Order
To increase the reaction rate, ![]() , for internal diffusion limited reactions, we can (1) decrease the radius R (make pellets smaller); (2) increase the temperature; (3) increase the concentration; and (4) increase the internal surface area. For reactions of order n, we have from Equation (15-20)
, for internal diffusion limited reactions, we can (1) decrease the radius R (make pellets smaller); (2) increase the temperature; (3) increase the concentration; and (4) increase the internal surface area. For reactions of order n, we have from Equation (15-20)
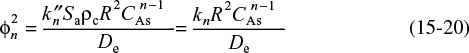
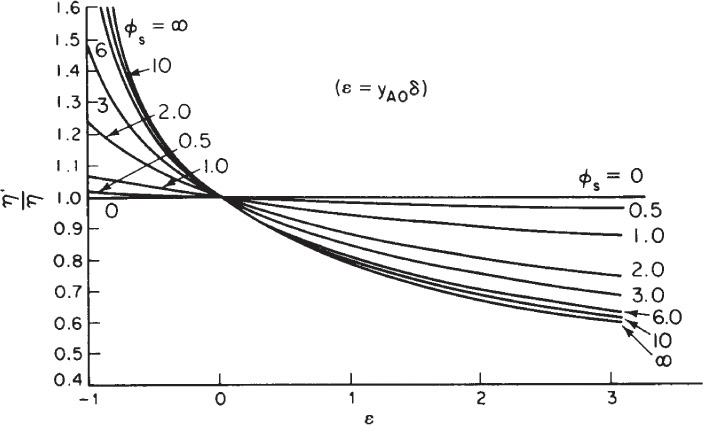
Figure 15-6 Effectiveness factor ratios for first-order kinetics on spherical catalyst pellets for various values of the Thiele modulus of a sphere, ϕs, as a function of volume change. [From V. W. Weekman and R. L. Goring, “Influence of Volume Change on Gas-Phase Reactions in Porous Catalysts.” J. Catal., 4(2), 260 (1965).]
Correction for volume change with reaction (i.e., ε ≠ 0)
For large values of the Thiele modulus, the effectiveness factor is
Consequently, for reaction orders greater than 1, the effectiveness factor decreases with increasing concentration at the external pellet surface.
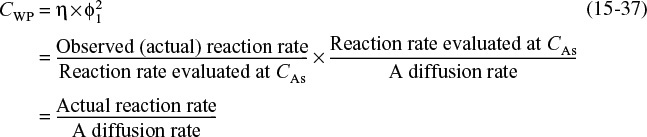
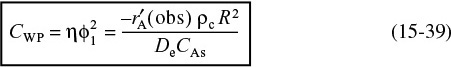
15.3.4 Weisz–Prater Criterion for Internal Diffusion Limitations
The Weisz–Prater criterion uses measured values of the rate of reaction, ![]() (obs), to determine if internal diffusion is limiting the reaction. This criterion can be developed intuitively for a first-order reaction by first rearranging Equation (15-32) in the form
(obs), to determine if internal diffusion is limiting the reaction. This criterion can be developed intuitively for a first-order reaction by first rearranging Equation (15-32) in the form
The left-hand side is the Weisz–Prater parameter:
Showing where the Weisz–Prater comes from
in Equation (15-59) we obtain

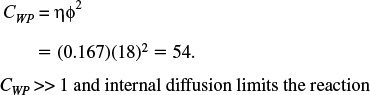
Are there any internal diffusion limitations indicated from the Weisz–Prater criterion?
All the terms in Equation (15-39) are either measured or known. Consequently, we can calculate CWP to learn if there are any diffusion limitations.
If
No diffusion limitations
there are no diffusion limitations and consequently no concentration gradient exists within the pellet.
However, if
Severe diffusion limitations
internal diffusion limits the reaction severely. Ouch!
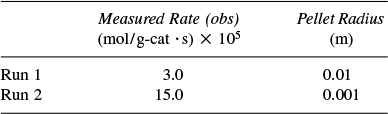
Example 15–2 Estimating the Thiele Modulus and Effectiveness Factor
The first-order reaction
was carried out over two different-sized pellets. The pellets were contained in a spinning basket reactor that was operated at sufficiently high rotation speeds that external mass transfer resistance was negligible. The results of two experimental runs made under identical conditions are given in Table E15-2.1.
(a) Estimate the Thiele modulus and effectiveness factor for each pellet.
(b) How small should the pellets be made to virtually eliminate all internal diffusion resistance, e.g., η = 0.95?
These two experiments yield an enormous amount of information.
Solution
(a) Combining Equations (15-36) and (15-39), we obtain
Letting the subscripts 1 and 2 refer to runs 1 and 2, we apply Equation (E15-2.1) to runs 1 and 2 and then take the ratio to obtain
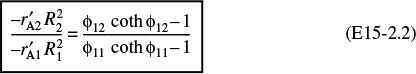
The terms ρc, De, and CAs cancel because the runs were carried out under identical conditions. The Thiele modulus is
Taking the ratio of the Thiele moduli for runs 1 and 2, we obtain

or
Substituting for ϕ11 in Equation (E15-2.2) above and evaluating ![]() and R for runs 1 and 2 gives us
and R for runs 1 and 2 gives us
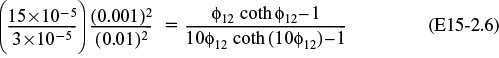
We now have one equation and one unknown. Solving Equation (E15-2.7) we find that

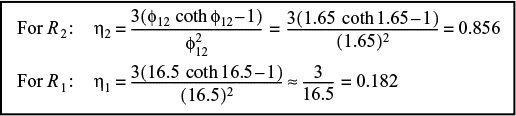
The corresponding effectiveness factors are
Given two experimental points, one can predict the particle size where internal mass transfer does not limit the rate of reaction.
(b) Next we calculate the particle radius needed to virtually eliminate internal diffusion control (say, η = 0.95)
The solution to Equation (E15-2.8) yields ϕ13 = 0.9
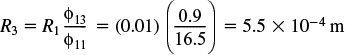
A particle size of 0.55 mm is necessary to virtually eliminate diffusion control (i.e., η = 0.95).
Analysis: This example is important because it shows us how, with only two measurements and some assumptions, we can determine internal diffusion limitations for the two pellet sizes, and predict the pellet size necessary to completely eliminate internal diffusion.
15.4 Falsified Kinetics
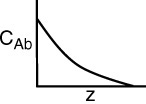
There are circumstances under which the measured reaction order and activation energy are not the true values. Consider the case in which we obtain reaction-rate data in a differential reactor at two different temperatures, T1 and T2, where precautions are taken to virtually eliminate external mass transfer resistance (i.e., CAs = CAb). From these data, we construct a log-log plot of the measured rate of reaction ![]() as a function of the gas-phase concentration, CAs (Figure 15-7). The slope of this plot is the apparent reaction order n’ and the measured rate law takes the form
as a function of the gas-phase concentration, CAs (Figure 15-7). The slope of this plot is the apparent reaction order n’ and the measured rate law takes the form
You may not be measuring what you think you are.
Measured rate:
Measured rate with apparent reaction order n’

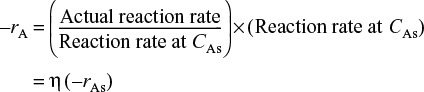
We will now proceed to relate this measured reaction order n’ to the true reaction order n. Using the definition of the effectiveness factor, noting that the actual rate, ![]() , is the product of η and the rate of reaction evaluated at the external surface,
, is the product of η and the rate of reaction evaluated at the external surface, ![]() , i.e.,
, i.e.,
Actual rate:
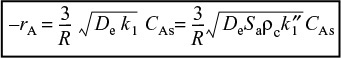
For large values of the Thiele modulus, ϕn, where internal mass is limiting, we can use Equation (15-38) to substitute into Equation (15-41) to obtain

Simplifying

We equate the true reaction rate, Equation (15-42), to the measured reaction rate, Equation (15-40), to get

The functional dependence of the reaction rate on concentration must be the same for both the measured rate and the theoretically predicted rate
therefore the measured apparent reaction order n’ (nApparent) is related to the true reaction order n (nTrue) by

The true and the apparent reaction order
In addition to an apparent reaction order, there is also an apparent activation energy, EApp . This value is the activation energy we would calculate using the experimental data from the slope of a plot of ln (![]() ) as a function of (1/T) at a fixed concentration of A. Substituting for the measured and true specific reaction rates in terms of the activation energy gives
) as a function of (1/T) at a fixed concentration of A. Substituting for the measured and true specific reaction rates in terms of the activation energy gives

into Equation (15-43), we find that

Taking the natural log of both sides gives us
where ET is the true activation energy.
As with the dependence rate on concentration, the temperature dependence must be the same for the analytical rate. Comparing the temperature-dependent terms on the right- and left-hand sides of Equation (15-45), we see that the true activation energy is equal to twice the apparent activation energy.
The true activation energy
This measurement of the apparent reaction order and activation energy results primarily when internal diffusion limitations are present and is referred to as disguised or falsified kinetics. Serious consequences could occur if the laboratory data were taken in the disguised regime and the reactor were operated in a different regime. For example, what if the particle size were reduced so that internal diffusion limitations became negligible? The higher activation energy, ET, would cause the reaction to be much more temperature sensitive, and there is the possibility for runaway reaction conditions causing an explosion to occur.
Important industrial consequence of falsified kinetic runaway reactions. Safety considerations!
15.5 Overall Effectiveness Factor
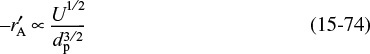
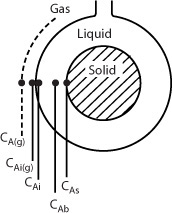
For first-order reactions, we can use an overall effectiveness factor to help us analyze diffusion, flow, and reaction in packed beds. We now consider a situation where external and internal resistance to mass transfer to and within the pellet are of the same order of magnitude (Figure 15-8). At steady state, the transport of the reactant(s) from the bulk fluid to the external surface of the catalyst is equal to the net rate of reaction of the reactant within and on the pellet.

Here, both internal and external diffusion are important.
The molar rate of mass transfer from the bulk fluid to the external surface is
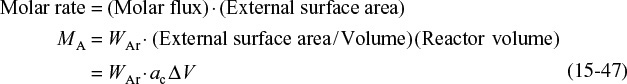
where ac is the external surface area per unit reactor volume (cf. Chapter 14) and ΔV is the volume.
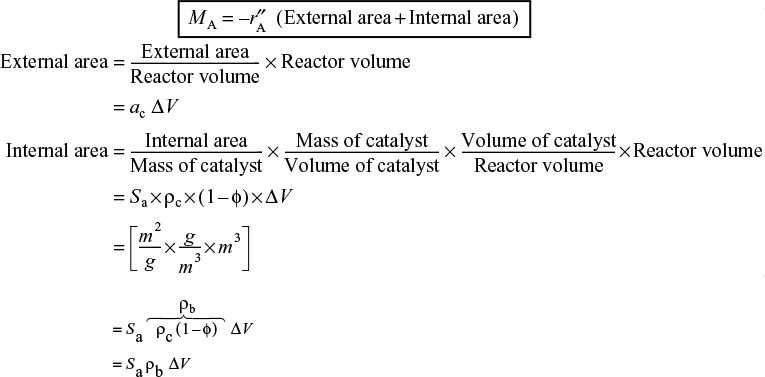
This molar rate of mass transfer to the surface, MA, is equal to the net (total) rate of reaction on and within the pellet
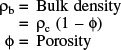
Recall that ρc is the density of catalyst pellet, kg per volume of pellet and ρB is the bulk density of catalyst, kg-cat per reactor volume.
We now combine the above equations, to obtain total molar flow into all the catalyst in volume ΔV
Combining Equations (15-47) and (15-48), and canceling the volume ΔV, we see the flux to the pellet surface, WAzac, is equal to the rate of consumption of A in and on the catalyst.
For most catalysts, the internal surface area is much greater than the external surface area (i.e., ![]() ), in which case we have
), in which case we have
Comparing units on the r.h.s. and l.h.s. of Equation (15-49), we find
where ![]() is the overall rate of reaction within and on the pellet per unit surface area,
is the overall rate of reaction within and on the pellet per unit surface area, ![]() is the rate of reaction per mass of catalyst
is the rate of reaction per mass of catalyst
and –rA is the overall rate per volume of reactor, i.e.,
then
with the corresponding units for each term in Equation (15-49) shown below.
The relationship for the rate of mass transport to the external catalyst surface is

Again, comparing units on the l.h.s. and r.h.s.
where kc is the external mass transfer coefficient (m/s). Because internal diffusion resistance is also significant, not all of the interior surface of the pellet is accessible to the concentration at the external surface of the pellet, CAs . We have already learned that the effectiveness factor is a measure of this surface accessibility [see Equation (15-41)]:
Assuming that the surface reaction is first order with respect to A, we can utilize the internal effectiveness factor to write
Recall that
We need to eliminate the surface concentration from any equation involving the rate of reaction or rate of mass transfer, because CAs cannot be measured by standard techniques. To accomplish this elimination, we use Equations (15-49), (15-50), and (15-51) in order to equate the mass transfer rate of A to the pellet surface, –WArac, to the rate of consumption of A within the pellet, ηk1CAs
WAr ac = ηk1CAs
Then substitute for WAr ac using Equation (15-50)
Solving for CAs, we obtain
Concentration at the pellet surface as a function of bulk gas concentration
Substituting for CAs in Equation (15-51) gives
In discussing the surface accessibility, we defined the internal effectiveness factor η with respect to the concentration at the external surface of the pellet, CAs, as
We now define an overall effectiveness factor that is based on the bulk concentration
Two different effectiveness factors
Dividing the numerator and denominator of Equation (15-54) by kc ac, we obtain the net rate of reaction, –rA, in terms of the bulk fluid concentration, which is a measurable quantity:

The actual rate of reaction is related to the reaction rate evaluated at the bulk concentration of A. Consequently, the overall rate of reaction in terms of the bulk concentration CAb is
where

Overall effectiveness factor for a first-order reaction
Note that the rates of reaction based on surface and bulk concentrations are related by
where
The actual rate can be expressed in terms of the rate per unit volume, –rA, the rate per unit mass, ![]() , and the rate per unit surface area,
, and the rate per unit surface area, ![]() , which are related by the equation
, which are related by the equation
Recall that ![]() is given in terms of the catalyst surface area (m3/m2 · s),
is given in terms of the catalyst surface area (m3/m2 · s), ![]() is given in terms of catalyst mass (m3/g-cat · s), and k1 is given in terms of reactor volume (1/s)
is given in terms of catalyst mass (m3/g-cat · s), and k1 is given in terms of reactor volume (1/s)
We saw in Chapter 14 that as the velocity of the fluid increases, the external mass transfer coefficient kc increases (cf. 14-49). Consequently, for large flow rates resulting in large values of the external mass transfer coefficient kc, we can neglect the ratio in the denominator
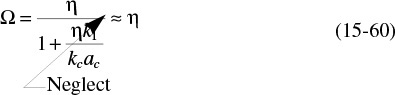
High flow rates of fluid
and the overall effectiveness factor approaches the internal effectiveness factor
15.6 Estimation of Diffusion- and Reaction-Limited Regimes
In many instances it is of interest to obtain “quick and dirty” estimates to learn which is the rate-limiting step in a heterogeneous reaction.
Dial soap
15.6.1 Mears Criterion for External Diffusion Limitations
The Mears criterion, like the Weisz–Prater criterion, uses the measured rate of reaction, ![]() , (kmol/kg-cat · s) to learn if external mass transfer from the bulk gas phase to the catalyst surface can be neglected.6 Mears proposed that when the Mears number is
, (kmol/kg-cat · s) to learn if external mass transfer from the bulk gas phase to the catalyst surface can be neglected.6 Mears proposed that when the Mears number is
6 D. E. Mears, Ind. Eng. Chem. Process Des. Dev., 10, 541 (1971). Other interphase transport-limiting criteria can be found in AIChE Symp. Ser. 143 (S. W. Weller, ed.), 70 (1974).
Is external diffusion limiting?
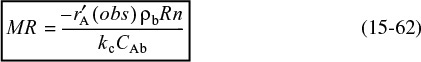
Here, we measure ![]() (obs), CAb, ρb, R and n, and then calculate kc to determine MR, where
(obs), CAb, ρb, R and n, and then calculate kc to determine MR, where
MR < 0.15
external mass transfer effects can be neglected and no concentration gradient exists between the bulk gas and external surface of the catalyst pellet. This proposal by Mears was endorsed unanimously by the Jofostan legislature. The mass transfer coefficient can be calculated from the appropriate correlation, such as that of Thoenes–Kramers, for the flow conditions through the bed.
Mears also proposed that the bulk fluid temperature, T, will be virtually the same as the temperature at the external surface of the pellet when
Tb ≅ Ts
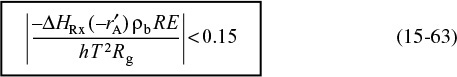
and the other symbols are as in Equation (15-62).
15.7 Mass Transfer and Reaction in a Packed Bed
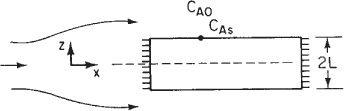
We now consider the same isomerization taking place in a packed bed of catalyst pellets rather than on one single pellet (see Figure 15-9). The concentration CAb is the bulk gas-phase concentration of A at any point along the length of the bed.

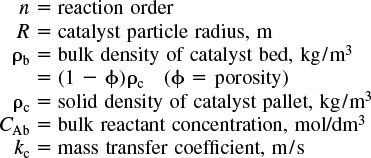
We shall perform a balance on species A over the volume element, ΔV, neglecting any radial variations in concentration and assuming that the bed is operated at steady state. The following symbols will be used in developing our model:

A mole balance on ΔV, the volume element (Ac Δz), yields
Mole Balance
Dividing by Ac Δz and taking the limit as Δz ![]() 0 yields
0 yields
Combining Equation (14-5) and (14-7), we get
Also, writing the bulk flow term in the form
BAz = yAb (WAz + WBz) = yAb cU = UCAb
Equation (15-64) can be written in the form
Now we will see how to use η and Ω to calculate conversion in a packed bed.
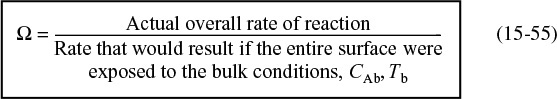
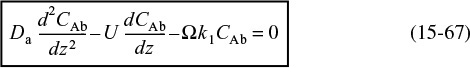
The term DAB (d2CAb/dz2) is used to represent either diffusion and/or dispersion in the axial direction. Consequently, we shall use the symbol Da for the dispersion coefficient to represent either or both of these cases. We will come back to this form of the diffusion equation when we discuss dispersion in Chapter 18. The overall reaction rate, –rA, is a function of the reactant concentration within the catalyst. This overall rate can be related to the rate of reaction of A that would exist if the entire surface were exposed to the bulk concentration CAb through the overall effectiveness factor Ω
For the first-order reaction considered here
Substituting this equation for –rA into Equation (15-65), we form the differential equation describing diffusion with a first-order reaction in a catalyst bed
Flow and first-order reaction in a packed bed
As an example, we shall solve this equation for the case in which the flow rate through the bed is very large and the axial diffusion can be neglected. Young and Finlayson have shown that axial dispersion can be neglected when7
7 L. C. Young and B. A. Finlayson, Ind. Eng. Chem. Fund., 12, 412.
Criterion for neglecting axial dispersion/diffusion
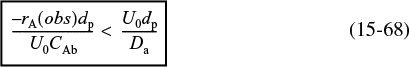
where U0 is the superficial velocity, dp the particle diameter, and Da is the effective axial dispersion coefficient. In Chapter 18 we will consider solutions to the complete form of Equation (15-67).
Neglecting axial dispersion with respect to forced axial convection
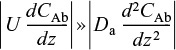
Equation (15-67) can be arranged in the form
With the aid of the boundary condition at the entrance of the reactor
CAb = CAb0 at z = 0
Equation (15-69) can be integrated to give
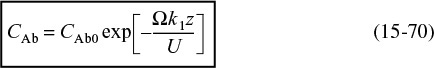
Conversion in a packed-bed reactor
The conversion at the reactor’s exit, z = L, is

Example 15–3 Reducing Nitrous Oxides in a Plant’s Effluent
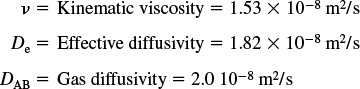
In Section 7.1.4 we saw that Nitric Oxide (NO) plays an important role in smog formation and there are great incentives for reducing its concentration in the atmosphere. It is proposed to reduce the concentration of NO in an effluent stream from a plant by passing it through a packed bed of spherical, porous carbonaceous solid pellets. A 2% NO and 98% air mixture flows at a rate of 1 × 10⁻⁶ m3/s (0.001 dm3/s) through a 2-in.-ID tube packed with porous solid pellets at a temperature of 1173 K and a pressure of 101.3 kPa. The reaction
Green chemical reaction engineering

is first order in NO; that is,
and occurs primarily in the pores inside the pellet, where
From those values of ![]() and
and ![]() we find
we find
k1 = ρbk ′ = (1.4 × 10 g / m3)(2.34 × 10⁻⁷m3 / g / s) = 0.328s–1

This example is long and detailed. Don’t fall asleep, as you need to know every detail of how to carry out these
1. Calculate the Weisz–Prater parameter, CWP. Is internal mass transfer limiting?
2. Calculate the Mears parameter, MR, for external diffusion limited. Is external mass transfer limiting?
3. Calculate the weight of solid porous catalyst necessary to reduce the NO concentration of 0.004%, which is below the Environmental Protection Agency’s limit.
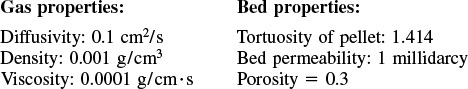
Additional information:
At 1173 K, the fluid properties are
The properties of the catalyst and bed are

Also see the Web site www.rowan.edu/greenengineering
Solution
It is desired to reduce the NO concentration from 2.0% to 0.004%. Neglecting any volume change at these low concentrations gives us
where A represents NO.
The variation of NO down the length of the reactor is given by Equation (15-69). Replacing k1 by ![]()
Multiplying the denominator on the right and left hand sides of Equation (15-69) by the cross-sectional area, Ac, and realizing that the weight of the catalyst up to a point z in the bed is
W = pb Ac z
the variation of NO concentration with solids is
(Mole balance) + (Rate law) + (Overall effectiveness factor)
Because NO is present in dilute concentrations (i.e., yA0 ![]() ), we shall take e
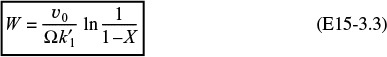
), we shall take e ![]() and set AcU = υ0 . We integrate Equation (E15-3.1) using the boundary condition that when W = 0, then CAb = CAb0
and set AcU = υ0 . We integrate Equation (E15-3.1) using the boundary condition that when W = 0, then CAb = CAb0

where
Rearranging, we have
4. Calculating the internal effectiveness factor for spherical pellets in which a first-order reaction is occurring, we obtained
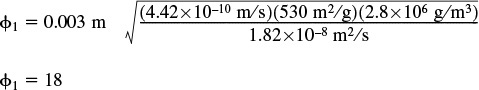
As a first approximation, we shall neglect any changes in the pellet size resulting from the reactions of NO with the porous carbon. The Thiele modulus for this system is8
8 L. K. Chan, A. F. Sarofim, and J. M. Beer, Combust. Flame, 52, 37.
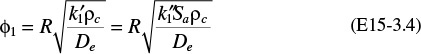
where

Substituting in Equation (E15-3.4)
1. Calculate CWP
2. To calculate the external mass transfer coefficient, the Thoenes–Kramers correlation is used. From Chapter 14 we recall
For a 2-in.-ID pipe, Ac = 2.03 × 10⁻³ m2 . The superficial velocity is
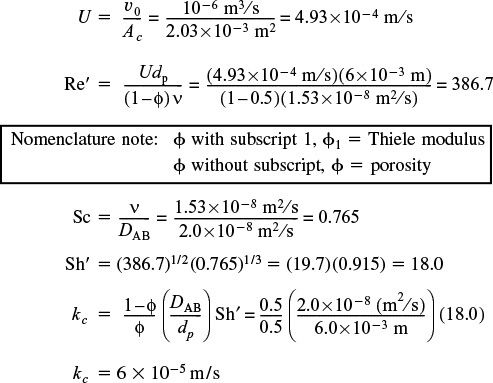
Procedure
Calculatem
Re’
Sc
Then
Sh’
Then
kc
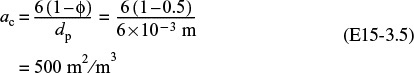
3. Calculating the external area per unit reactor volume, we obtain
4. Evaluating the overall effectiveness factor. Substituting into Equation (15-58), we have
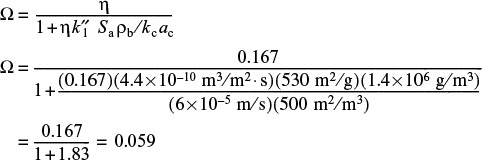
In this example we see that both the external and internal resistances to mass transfer are significant.
5. Calculate the Mears criterion, MR, to see if mass transfer limits the reaction.

MR (i.e., 0.97 > 0.15) and diffusion limits the reaction.
6. Calculating the weight of solid necessary to achieve 99.8% conversion. Substituting into Equation (E15-3.3), we obtain
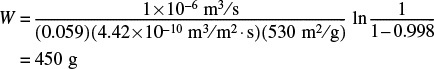
7. The reactor length is
This catalyst weight and corresponding reactor length are rather small and as such we could easily increase the feed rate to the reactor.
Analysis: One of the purposes of this example was to show how to carry out detailed calculations of the diffusion and reaction rate in order to size (i.e., calculate V or W) a reactor for a specified conversion, when both external and internal diffusion resistances affect the rate of reaction. These calculations are tedious and detailed, and it was my feeling that we should show and know all the intermediate calculations, e.g., ac, η and Ω, so that the reader will have a better understanding of how to make such calculations in the future.
15.8 Determination of Limiting Situations from Reaction-Rate Data
For external mass transfer-limited reactions in packed beds, the rate of reaction per unit mass of catalyst at a point in the bed is
Variation of reaction rate with system variables
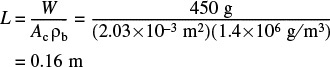
The correlation for the mass transfer coefficient, Equation (14-66), shows that kc is directly proportional to the square root of the velocity and inversely proportional to the square root of the particle diameter
We recall from Equation (E15-3.5), ac = 6(1 – ϕ)/dp, that the variation of external surface area with catalyst particle size is
We now combine Equations (15-72), (15-73), and (15-74) to obtain
Consequently, for external mass transfer–limited reactions, the rate proportional to the velocity to the one-half power is inversely proportional to the particle diameter to the three-halves power.
From Equation (14-72), we see that for gas-phase external mass transfer– limited reactions, the rate increases approximately linearly with temperature.
Many heterogeneous reactions are diffusion limited.
When internal diffusion limits the rate of reaction, we observe from Equation (15-42) that the rate of reaction varies inversely with particle diameter, is independent of velocity, and exhibits an exponential temperature dependence that is not as strong as that for surface-reaction-controlling reactions. For surface-reaction-limited reactions, the rate is independent of particle size and is a strong function of temperature (exponential). Table 15-1 summarizes the dependence of the rate of reaction on the velocity through the bed, particle diameter, and temperature for the three types of limitations that we have been discussing.

Very Important Table
The exponential temperature dependence for internal diffusion limitations is usually not as strong a function of temperature as is the dependence for surface reaction limitations (cf. Section 15.4). If we would calculate an activation energy between 8 and 24 kJ/mol, chances are that the reaction would be strongly diffusion-limited. An activation energy of 200 kJ/mol, however, suggests that the reaction is reaction rate–limited.
15.9 Multiphase Reactors in the Professional Reference Shelf
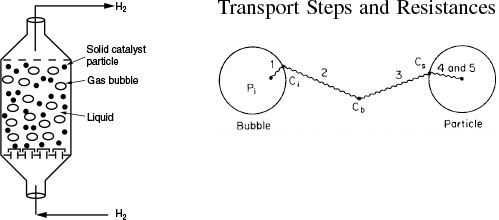
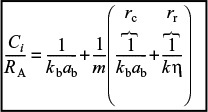
Multiphase reactors are reactors in which two or more phases are necessary to carry out the reaction. The majority of multiphase reactors involve gas and liquid phases that contact a solid. In the case of the slurry and trickle bed reactors, the reaction between the gas and the liquid takes place on a solid catalyst surface (see Table 15-2). However, in some reactors the liquid phase is an inert medium for the gas to contact the solid catalyst. The latter situation arises when a large heat sink is required for highly exothermic reactions. In many cases, the catalyst life is extended by these milder operating conditions.

A. Hydrogenation
1. of fatty acids over a supported nickel catalyst
2. of 2-butyne-1,4-diol over a Pd-CaCO3 catalyst
3. of glucose over a Raney nickel catalyst
B. Oxidation
1. of C2 H4 in an inert liquid over a PdCl2-carbon catalyst
2. of SO2 in inert water over an activated carbon catalyst
C. Hydroformation
of CO with high-molecular-weight olefins on either a cobalt or ruthenium complex bound to polymers
D. Ethynylation
Reaction of acetylene with formaldehyde over a CaCl2-supported catalyst

II. Trickle bed reactors
A. Hydrodesulfurization
Removal of sulfur compounds from crude oil by reaction with hydrogen on Co-Mo on alumina
B. Hydrogenation
1. of aniline over a Ni-clay catalyst
2. of 2-butyne-1,4-diol over a supported Cu-Ni catalyst
3. of benzene, a-CH3 styrene, and crotonaldehyde
4. of aromatics in napthenic lube oil distillate
C. Hydrodenitrogenation
1. of lube oil distillate
2. of cracked light furnace oil
D. Oxidation
1. of cumene over activated carbon
2. of SO2 over carbon
Source: Satterfield, C. N. AIChE Journal., 21, 209 (1975); P. A. Ramachandran and R. V. Chaudhari, Chem. Eng., 87(24), 74 (1980); R. V. Chaudhari and P. A. Ramachandran, AIChE Journal., 26, 177 (1980). With permission of the American Institute of Chemical Engineers. Copyright © 1980 AIChE. All rights reserved.
TABLE 15-2 APPLICATIONS OF THREE-PHASE REACTORS
The multiphase reactors discussed in this edition of the book are the slurry reactor, fluidized bed, and the trickle bed reactor. The trickle bed reactor, which has reaction and transport steps similar to the slurry reactor, is discussed in the first edition of this book and on the CRE Web site along with the bubbling fluidized bed. In slurry reactors, the catalyst is suspended in the liquid, and gas is bubbled through the liquid. A slurry reactor may be operated in either a semibatch or continuous mode.
15.9.1 Slurry Reactors
A complete description of the slurry reactor and the transport and reaction steps are given on the CRE Web site, along with the design equations and a number of examples. Methods to determine which of the transport and reaction steps are rate limiting are included. See Professional Reference Shelf R15.1.
15.9.2 Trickle Bed Reactors
The CRE Web site includes all the material on trickle bed reactors from the first edition of this book. A comprehensive example problem for trickle bed reactor design is included. See Professional Reference Shelf R15.2.
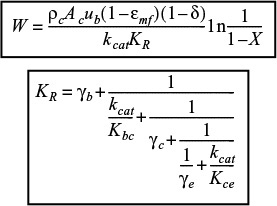
15.10 Fluidized Bed Reactors
The Kunii-Levenspiel model for fluidization is given on the CRE Web site along with a comprehensive example problem. The rate-limiting transport steps are also discussed. See Professional Reference Shelf R15.3.
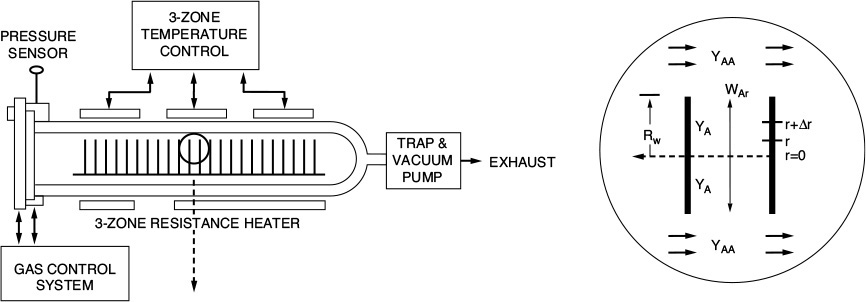
15.11 Chemical Vapor Deposition (CVD)
Chemical vapor deposition in boat reactors is discussed and modeled. The equations and parameters that affect wafer thickness and shape are derived and analyzed. This material is taken directly from the second edition of this book. See Professional Reference Shelf R15.4.
Summary
1. The concentration profile for a first-order reaction occurring in a spherical catalyst pellet is
where ϕ1 is the Thiele modulus. For a first-order reaction
2. The effectiveness factors are

3. For large values of the Thiele modulus for an nth order reaction

4. For internal diffusion control, the true reaction order is related to the measured reaction order by
The true and apparent activation energies are related by
5. A. The Weisz–Prater Parameter
The Weisz–Prater criterion dictates that
B. The Mears Criterion for Neglecting External Diffusion and Heat Transfer
There will be no external diffusion limitations if
And there will be no temperature gradients if
CRE Web Site Materials
• Extended Material on the Web Site
1. Web Example 15-1 Application of Diffusion and Reaction to Tissue Engineering (also see P15-15B)
From Prof. Kristi Anseth, University of Colorado.
Figure WE15-1.1 Damaged cartilage. (Newsweek, September 3, 2001.) Photo of “damaged cartilage” originally appeared in “21 Million Americans Suffer from Arthritis,” by Jerry Adler.
2. 15.3.3 Effectiveness Factor for Nonisothermal First-Order Catalytic Reactions
3. Problem 15-12C Diffusion and Reaction in Spherical Catalyst Pellets
4. Additional Homework Problems
• Learning Resources
1. Summary Notes
2. Solved Problems
• Professional Reference Shelf
R15.1. Slurry Reactors
A. Description of the Use of Slurry Reactors
Example R15-1 Industrial Slurry Reactor
B. Reaction and Transport Steps in a Slurry Reactor
C. Determining the Rate-Limiting Step
1. Effect of Loading, Particle Size, and Gas Adsorption
2. Effect of Shear
Example R15-2 Determining the Controlling Resistance
D. Slurry Reactor Design

Example R15-3 Slurry Reactor Design
A. Fundamentals

B. Limiting Situations
C. Evaluating the Transport Coefficients

R15.3. Fluidized Bed Reactors
A. Descriptive Behavior of the Kunii-Levenspiel Bubbling Bed Model

B. Mechanics of Fluidized Beds
Example R15-4 Maximum Solids Hold-Up
C. Mass Transfer in Fluidized Beds
D. Reaction in a Fluidized Bed
E. Solution to the Balance Equations for a First-Order Reaction
Example R15-5 Catalytic Oxidation of Ammonia
Example R15-6 Calculation of the Resistances
Example R15-7 Effect of Particle Size on Catalyst Weight for a Slow Reaction
Example R15-8 Effect of Catalyst Weight for a Rapid Reaction
R15.4. Chemical Vapor Deposition Reactors
A. Chemical Reaction Engineering in Microelectronic Processing
B. Fundamentals of CVD
C. Effectiveness Factors for Boat Reactors
Example R15-9 Diffusion Between Wafers
Example R15-10 CVD Boat Reactor

Questions and Problems
The subscript to each of the problem numbers indicates the level of difficulty: A, least difficult; D, most difficult.
Questions
Q15-1C Make up an original problem using the concepts presented in Section ___________ (your instructor will specify the section). Extra credit will be given if you obtain and use real data from the literature. (See Problem P5-1A for the guidelines.)
Q15-2 Suppose someone had used the false kinetics (i.e., wrong E, wrong n)? Would the catalyst weight be overdesigned or underdesigned? What are other positive or negative effects that occur?
(a) Example 15-1. Effective Diffusivity. Make a sketch of a diffusion path for which the tortuosity is 5. How would your effective gas-phase diffusivity change if the absolute pressure were tripled and the temperature were increased by 50%?
(b) Example 15-2. If possible, determine the percent of the total resistance for (1) internal diffusion and (2) for reaction rate for each of the three particles studied. Apply the Weisz-Prater criteria to a particle 0.005 m in diameter.
(c) Example 15-3. Overall Effectiveness Factor. (1) Calculate the percent of the total resistance for the resistance of external diffusion, internal diffusion, and surface reaction. Qualitatively, how would each of your percentages change (2) If the temperature were increased significantly? (3) If the gas velocity were tripled? (4) If the particle size were decreased by a factor of 2? How would the reactor length change in each case? (5) What length would be required to achieve 99.99% conversion of the pollutant NO?
What if...
(d) you applied the Mears and Weisz–Prater criteria to Examples 15-4 and 15-3? What would you find? What would you learn if ![]() kcal/mol, h = 100 Btu/h · ft2 · °F, and E = 20 kcal/mol?
kcal/mol, h = 100 Btu/h · ft2 · °F, and E = 20 kcal/mol?
(e) your internal surface area decreased with time because of sintering (see Section 10.7). Describe how your effectiveness factor would change and the rate of reaction change with time if kd = 0.01 h–1 and η = 0.01 at t = 0? Explain, being as quantitative as possible when you can.
(f) you were to assume that the resistance to gas absorption in the CRE Web site Professional Reference Shelf R15.1 was the same as in Professional Reference Shelf R15.3 and that the liquid-phase reactor volume in Professional Reference Shelf R15.3 was 50% of the total? Could you determine the limiting resistance? If so, what is it? What other things could you calculate in Professional Reference Shelf R15.1 (e.g., selectivity, conversion, molar flow rates in and out)? Hint: Some of the other reactions that occur include
(g) the temperature in the CRE Web site Example R15.2 were increased? How would the relative resistances in the slurry reactor change?
(h) you were asked for all the things that could go wrong in the operation of a slurry reactor? What would you say?
P15-2B Concept problem: The catalytic reaction
takes place within a fixed bed containing spherical porous catalyst X22. Figure P15-2B shows the overall rates of reaction at a point in the reactor as a function of temperature for various entering total molar flow rates, FT0 .
(a) Is the reaction limited by external diffusion?
(b) If your answer to part (a) was “yes,” under what conditions of those shown (i.e., T, FT0) is the reaction limited by external diffusion?
(c) Is the reaction “reaction-rate-limited”?
(d) If your answer to part (c) was “yes,” under what conditions of those shown (i.e., T, FT0) is the reaction limited by the rate of the surface reactions?
(e) Is the reaction limited by internal diffusion?
(f) If your answer to part (e) was “yes,” under what conditions of those shown (i.e., T, FT0) is the reaction limited by the rate of internal diffusion?
(g) For a flow rate of 10 g mol/h, determine (if possible) the overall effectiveness factor, Ω, at 360 K.
(h) Estimate (if possible) the internal effectiveness factor, η, at 367 K. (Ans.: η = 0.86)
(i) If the concentration at the external catalyst surface is 0.01 mol/dm3, calculate (if possible) the concentration at r = R/2 inside the porous catalyst at 367 K. (Assume a first-order reaction.)

Additional information:
P15-3B Concept problem: The reaction
is carried out in a differential packed-bed reactor at different temperatures, flow rates, and particle sizes. The results shown in Figure P15-3B were obtained.

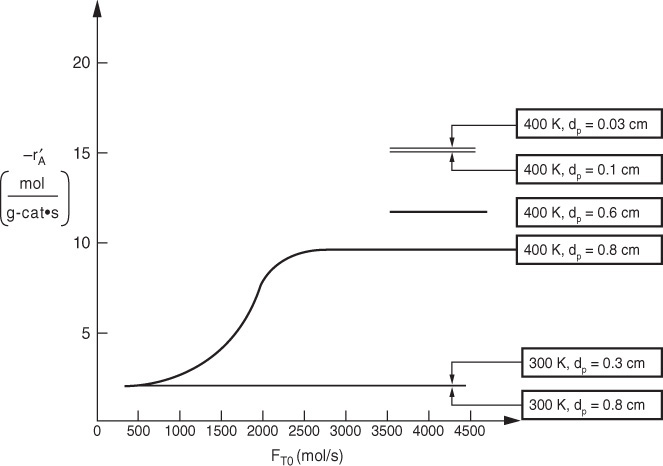
(a) What regions (i.e., conditions dp, T, FT0) are external mass transfer–limited?
(b) What regions are reaction rate–limited?
(c) What region is internal-diffusion-controlled?
(d) What is the internal effectiveness factor at T = 400 K and dp = 0.8 cm? (Ans.: η = 0.625)
P15-4A Concept problem: Curves A, B, and C in Figure P15-4A show the variations in reaction rate for three different reactions catalyzed by solid catalyst pellets. What can you say about each reaction?

P15-5B A first-order heterogeneous irreversible reaction is taking place within a spherical catalyst pellet that is plated with platinum throughout the pellet (see Figure 15-3). The reactant concentration halfway between the external surface and the center of the pellet (i.e., r = R/2) is equal to one-tenth the concentration of the pellet’s external surface. The concentration at the external surface is 0.001 g mol/dm3, the diameter (2R) is 2 × 10⁻³ cm, and the diffusion coefficient is 0.1 cm2/s.
(a) What is the concentration of reactant at a distance of 3 × 10⁻⁴ cm in from the external pellet surface? (Ans.: CA = 2.36 × 10⁻⁴ mol/dm3.)
(b) To what diameter should the pellet be reduced if the effectiveness factor is to be 0.8? (Ans.: dp = 6.8 × 10⁻⁴ cm. Critique this answer!)
(c) If the catalyst support were not yet plated with platinum, how would you suggest that the catalyst support be plated after it had been reduced by grinding?
P15-6B The swimming rate of a small organism [J. Theoret. Biol., 26, 11 (1970)] is related to the energy released by the hydrolysis of adenosine triphosphate (ATP) to adenosine diphosphate (ADP). The rate of hydrolysis is equal to the rate of diffusion of ATP from the midpiece to the tail (see Figure P15-6B). The diffusion coefficient of ATP in the midpiece and tail is 3.6 × 10⁻⁶ cm2/s. ADP is converted to ATP in the midsection, where its concentration is 4.36 × 10⁻⁵ mol/cm3. The cross-sectional area of the tail is 3 × 10⁻¹⁰ cm2.

(a) Derive an equation for diffusion and reaction in the tail.
(b) Derive an equation for the effectiveness factor in the tail.
(c) Taking the reaction in the tail to be of zero order, calculate the length of the tail. The rate of reaction in the tail is 23 × 10–18 mol/s.
(d) Compare your answer with the average tail length of 41 μm. What are possible sources of error?
P15-7B A first-order, heterogeneous, irreversible reaction is taking place within a catalyst pore that is plated with platinum entirely along the length of the pore (Figure P15-7B). The reactant concentration at the plane of symmetry (i.e., equal distance from the pore mouth) of the pore is equal to one-tenth the concentration at the pore mouth. The concentration at the pore mouth is 0.001 mol/dm3, the pore length (2L) is 2 × 10⁻³ cm, and the diffusion coefficient is 0.1 cm2/s.
(a) Derive an equation for the effectiveness factor.
(b) What is the concentration of reactant at L/2?

(c) To what length should the pore length be reduced if the effectiveness factor is to be 0.8?
(d) If the catalyst support were not yet plated with platinum, how would you suggest the catalyst support be plated after the pore length, L, had been reduced by grinding?
P15-8A A first-order reaction is taking place inside a porous catalyst. Assume dilute concentrations and neglect any variations in the axial (x) direction.
(a) Derive an equation for both the internal and overall effectiveness factors for the rectangular porous slab shown in Figure P15-8A.
(b) Repeat part (a) for a cylindrical catalyst pellet where the reactants diffuse inward in the radial direction. (C-level problem, i.e., P15-8C(b).)
P15-9B The irreversible reaction
is taking place in the same porous catalyst slab shown in Figure P15-8A. The reaction is zero order in A.
(a) Show that the concentration profile using the symmetry B.C. is
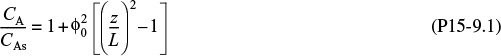
where
(b) For a Thiele modulus of 1.0, at what point in the slab is the concentration zero? For ϕ0 = 4?
(c) What is the concentration you calculate at z = 0.1 L and ϕ0 = 10 using Equation (P15-9.1)? What do you conclude about using this equation?
(d) Plot the dimensionless concentration profile ψ = CA/CAs as a function of λ = z/L for ϕ0 = 0.5, 1, 5, and 10. Hint: there are regions where the concentration is zero. Show that λC = (1 – 1/ϕ0) is the start of this region where the gradient and concentration are both zero. [L. K. Jang, R. L. York, J. Chin, and L. R. Hile, Inst. Chem. Engr., 34, 319 (2003).]
Show that ![]() for λC ≤ λ > 1.
for λC ≤ λ > 1.
(e) The effectiveness factor can be written as

where zC (λC) is the point at which both the concentration gradients and flux go to zero, and Ac is the cross-sectional area of the slab. Show for a zero-order reaction that

(f) Make a sketch for η versus ϕ0 similar to the one shown in Figure 15-5.
(g) Repeat parts (a) to (f) for a spherical catalyst pellet.
(h) What do you believe to be the point of this problem?
P15-10C The second-order decomposition reaction
is carried out in a tubular reactor packed with catalyst pellets 0.4 cm in diameter. The reaction is internal-diffusion-limited. Pure A enters the reactor at a superficial velocity of 3 m/s, a temperature of 250°C, and a pressure of 500 kPa. Experiments carried out on smaller pellets where surface reaction is limiting yielded a specific reaction rate of 0.05 m6/mol · g-cat · s. Calculate the length of bed necessary to achieve 80% conversion. Critique the numerical answer. (Ans.: L = 2.8 x 10⁻⁵ m)
Additional information:
P15-11C Derive the concentration profile and effectiveness factor for cylindrical pellets 0.2 cm in diameter and 1.5 cm in length. Neglect diffusion through the ends of the pellet.
(a) Assume that the reaction is a first-order isomerization. Hint: Look for a Bessel function.
(b) Rework Problem P15-10C for these pellets.
P15-12B Extension of Problem P15-7B. The elementary isomerization reaction
is taking place on the walls of a cylindrical catalyst pore (see Figure P15-7B.) In one run, a catalyst poison P entered the reactor together with the reactant A. To estimate the effect of poisoning, we assume that the poison renders the catalyst pore walls near the pore mouth ineffective up to a distance z1, so that no reaction takes place on the walls in this entry region.
(a) Show that before poisoning of the pore occurred, the effectiveness factor was given by
where
(b) Derive an expression for the concentration profile and also for the molar flux of A in the ineffective region, 0 < z < z1, in terms of z1, DAB, CA1, and CAs . Without solving any further differential equations, obtain the new effectiveness factor η’ for the poisoned pore.
P15-13B Falsified Kinetics. The irreversible gas-phase dimerization
is carried out at 8.2 atm in a stirred contained-solids reactor to which only pure A is fed. There are 40 g of catalyst in each of the four spinning baskets. The following runs were carried out at 227°C:

The following experiment was carried out at 237°C:
(a) What are the apparent reaction order and the apparent activation energy?
(b) Determine the true reaction order, specific reaction rate, and activation energy.
(c) Calculate the Thiele modulus and effectiveness factor.
(d) What pellet diameter should be used to make the catalyst more effective?
(e) Calculate the rate of reaction on a rotating disk made of the catalytic material when the gas-phase reactant concentration is 0.01 g mol/L and the temperature is 227°C. The disk is flat, nonporous, and 5 cm in diameter.
Additional information:
P15-14B Derive Equation (15-39). Hint: Multiply both sides of Equation (15-25) for nth order reaction; that is,
by 2dy/dλ, rearrange to get
and solve using the boundary conditions dy/dλ = 0 at λ = 0.
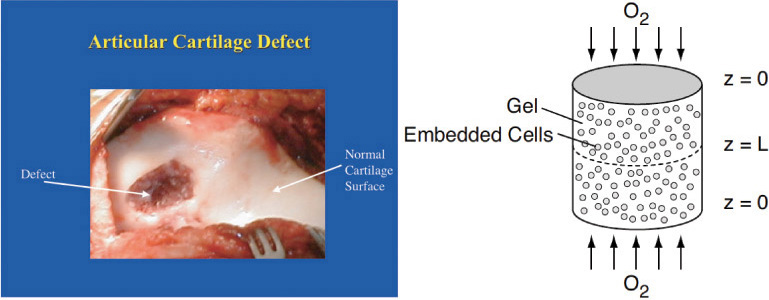
P15-15B Applications of Diffusion and Reaction to Tissue Engineering. The equations describing diffusion and reaction in porous catalysts also can be used to derive rates of tissue growth and have been studied by Professor Kristi Anseth and her students at the University of Colorado. One important area of tissue growth is in cartilage tissue in joints such as the knee. Over 200,000 patients per year receive knee joint replacements. Alternative strategies include the growth of cartilage to repair the damaged knee.
One approach is to deliver cartilage-forming cells in a hydrogel to the damaged area such as the one shown in Figure WP15-1.1 on the CRE Web site.
Here, the patient’s own cells are obtained from a biopsy and embedded in a hydrogel, which is a cross-linked polymer network that is swollen in water. In order for the cells to survive and grow new tissue, many properties of the gel must be tuned to allow diffusion of important species in and out (e.g., nutrients in and cell-secreted extracellular molecules such as collagen out). Because there is no blood flow through the cartilage, oxygen transport to the cartilage cells is primarily by diffusion. Consequently, the design must be such that the gel can maintain the necessary rates of diffusion of nutrients (e.g., O2) into the hydrogel. These rates of exchange in the gel depend on the geometry and the thickness of the gel. To illustrate the application of chemical reaction engineering principles to tissue engineering, we will examine the diffusion and consumption of one of the nutrients, oxygen.
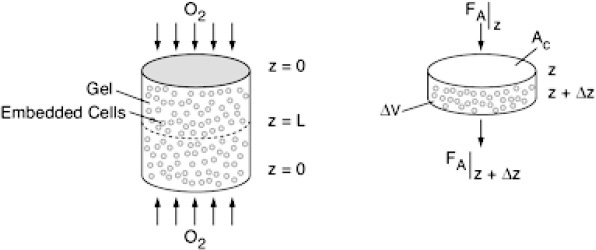
Our examination of diffusion and reaction in catalyst pellets showed that in many cases the reactant concentration near the center of the particle was virtually zero. If this condition were to occur in a hydrogel, the cells at the center would die. Consequently, the gel thickness needs to be designed to allow rapid transport of oxygen.
Let’s consider the simple gel geometry shown in Figure P15-15B. We want to find the gel thickness at which the minimum oxygen consumption rate is 10–13 mol/cell/h 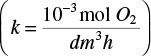 .
.
The cell density in the gel is 1010 cells/dm3, the bulk concentration of oxygen CA0 (z = 0) is 2 x 10⁻⁴ mol/dm3, and the diffusivity, DAB, is 10–5 cm2/s.
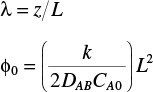
(a) Show that the dimensionless form of concentration and length, ψ = CA/CA0, and λ = z/L, differential mole balance on O2 gives
(b) Show the dimensionless O2 concentration profile in the gel is
where
(c) Solve the gel thickness when the concentration at z = 0 and CA = 0.1 mmole/dm3.
(d) How would your answers change if the reaction kinetics were (1) first order in the O2 concentration with k1 = 10–2 h–1?
(e) Carry out a quasi-steady-state analysis using Equation (E15-1.19) along with the overall balance
to predict the O2 flux and collagen build-up as a function of time.
(f) Sketch ψ versus λ at different times.
(g) Sketch λc as a function of time. Hint: V = AcL. Assume α = 10 and the stoichiometric coefficient for oxygen to collagen, υc, is 0.05 mass fraction of cell/mol O2. Ac = 2 cm2.
Journal Critique Problems
P15C-1 Use the Weisz–Prater criterion to determine if the reaction discussed in AIChE J., 10, 568 (1964) is diffusion-rate-limited.
P15C-2 Use the references given in Ind. Eng. Chem. Prod. Res. Dev., 14, 226 (1975) to define the iodine value, saponification number, acid number, and experimental setup. Use the slurry reactor analysis to evaluate the effects of mass transfer and determine if there are any mass transfer limitations.
Supplementary Reading
1. There are a number of books that discuss internal diffusion in catalyst pellets; however, one of the first books that should be consulted on this and other topics on heterogeneous catalysis is
LAPIDUS, L., AND N. R. AMUNDSON, Chemical Reactor Theory: A Review, Upper Saddle River, N.J.: Prentice Hall, 1977.
In addition, see
ARIS, R., Elementary Chemical Reactor Analysis. Upper Saddle River, NJ: Prentice Hall, 1989, Chap. 6. Old, but one should find the references listed at the end of this reading particularly useful.
FOGLER, JOSEPH J., AKA JOFO, A Chemical Reaction Engineers Guide to the Country of Jofostan. To be self published, hopefully by 2020.
LUSS, D., “Diffusion—Reaction Interactions in Catalyst Pellets,” p. 239 in Chemical Reaction and Reactor Engineering. New York: Marcel Dekker, 1987.
The effects of mass transfer on reactor performance are also discussed in
COLLINS, FRANK C., AND GEORGE E. KIMBALL, “Diffusion Controlled Reaction Rates,” Journal of Colloid Science, Vol. 4, Issue 4, August 1949, Pages 425-437.
SATTERFIELD, C. N., Heterogeneous Catalysis in Industrial Practice, 2nd ed. New York: McGraw-Hill, 1991.
2. Diffusion with homogeneous reaction is discussed in
ASTARITA, G., and R. OCONE, Special Topics in Transport Phenomena. New York: Elsevier, 2002.
Gas-liquid reactor design is also discussed in
BUTT, JOHN B., Reaction Kinetics and Reactor Design, 2nd ed. Boca Raton, FL: CRC Press, 2000.
SHAH, Y. T., Gas–Liquid–Solid Reactor Design. New York: McGraw-Hill, 1979.
3. Modeling of CVD reactors is discussed in
DOBKIN, DANIEL, AND M. K. ZUKRAW, Principles of Chemical Vapor Deposition. The Netherlands: Kluwer Academic Publishers, 2003.
HESS, D. W., K. F. JENSEN, and T. J. ANDERSON, “Chemical Vapor Deposition: A Chemical Engineering Perspective,” Rev. Chem. Eng., 3, 97, 1985.
4. Multiphase reactors are discussed in
RAMACHANDRAN, P. A., and R. V. CHAUDHARI, Three-Phase Catalytic Reactors. New York: Gordon and Breach, 1983.
RODRIGUES, A. E., J. M. COLO, and N. H. SWEED, eds., Multiphase Reactors, Vol. 1: Fundamentals. Alphen aan den Rijn, The Netherlands: Sitjhoff and Noordhoff, 1981.
RODRIGUES, A. E., J. M. COLO, and N. H. SWEED, eds., Multiphase Reactors, Vol. 2: Design Methods. Alphen aan den Rijn, The Netherlands: Sitjhoff and Noordhoff, 1981.
SHAH, Y. T., B. G. KELKAR, S. P. GODBOLE, and W. D. DECKWER, “Design Parameters Estimations for Bubble Column Reactors” (journal review), AIChE J., 28, 353 (1982).
The following Advances in Chemistry Series volume discusses a number of multiphase reactors:
FOGLER, H. S., ed., Chemical Reactors, ACS Symp. Ser. 168. Washington, DC: American Chemical Society, 1981, pp. 3–255.
5. Fluidization
KUNII, DAIZO, AND OCTAVE LEVENSPIEL, Fluidization Engineering, 2nd ed. (Butterworths Series in Chemical Engineering Deposition). Stoneham, MA: Butterworth-Heinemann, 1991.
In addition to Kunii and Levenspiel’s book, many correlations can be found in
DAVIDSON, J. F., R. CLIFF, and D. HARRISON, Fluidization, 2nd ed. Orlando: Academic Press, 1985.
YATES, J. G., Fundamentals of Fluidized-Bed Chemical Processes, 3rd ed. London: Butterworth, 1983.