Call Stack Window
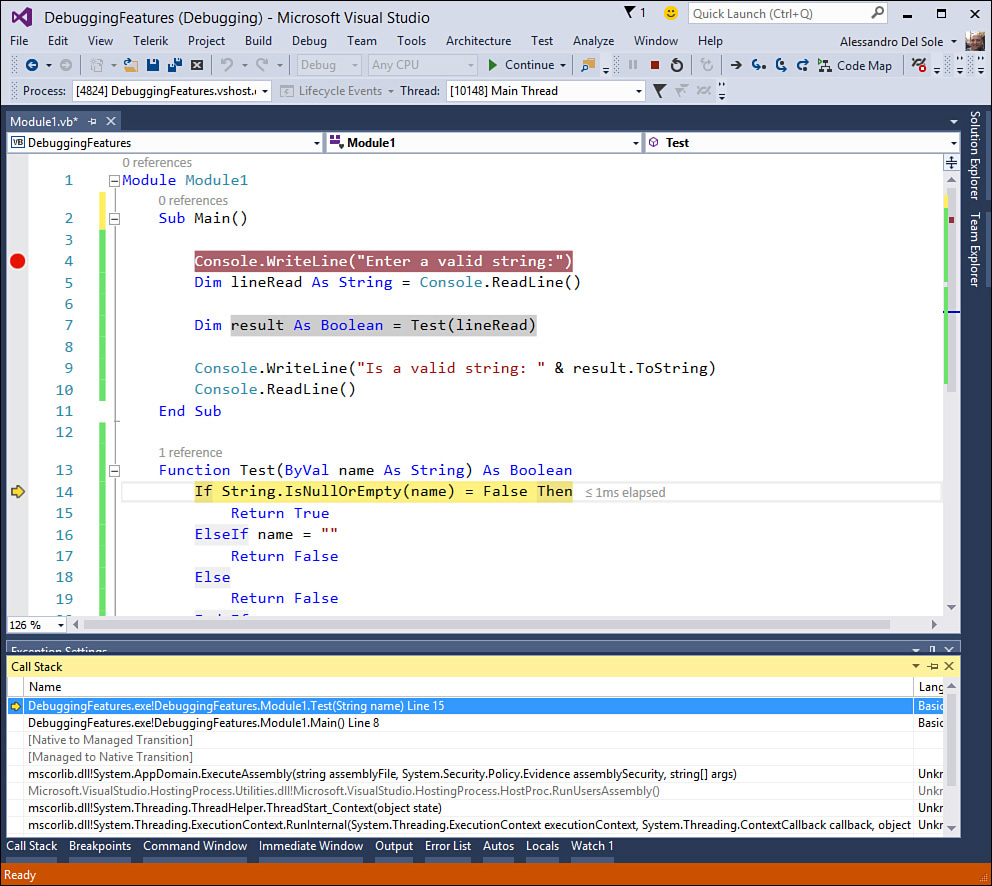
The Call Stack window shows the method calls stack frame. In other words, you can see how method calls run in the stack. The window can show the programming language that the method is written with and can display calls to external code. By default, the Call Stack window shows information about Just My Code. To understand method calls, press F11 to step into the code. Figure 5.12 shows the Call Stack window related to Listing 5.1.
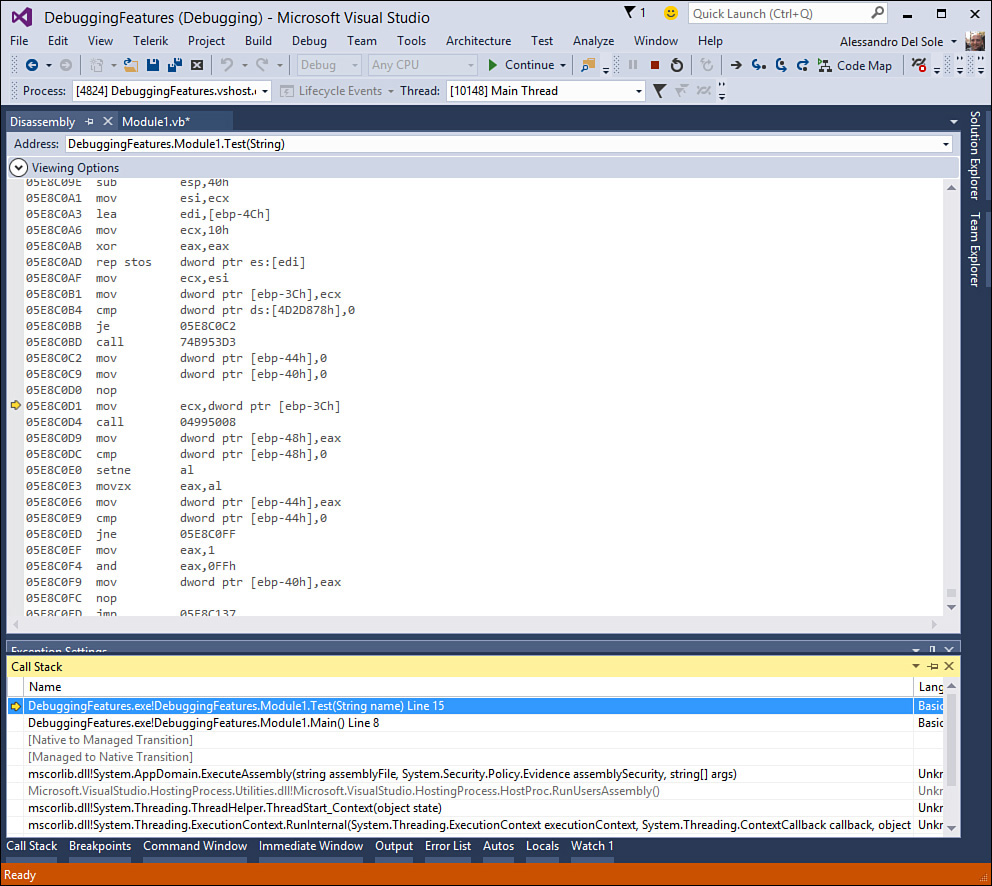
The window shows the names of methods being executed and the programming language with which they were written. Calls to .NET Framework system methods are also shown. Another interesting feature is that you can see the assembly code for code execution. Right-click the window and select the Go to Disassembly command from the pop-up menu. As shown in Figure 5.13, you can see Visual Basic lines of code and the related underlying assembly code that you can step into by pressing F11.
You can also customize the type of information you want to visualize by expanding the View Options control. This feature provides great granularity on what’s happening behind the scenes and allows understanding if method calls are executed correctly. You can invoke the Call Stack window by pressing Ctrl+Alt+C.
Threads and Call Stack
The Call Stack window can show information only on the current thread. Therefore, method calls on other threads are ignored by the window.