
Chapter 3. Using Troubleshooting and Monitoring Tools
Any system, whether or not it is a collaboration system, is only as good as the tools available to manage, monitor, and troubleshoot it. Cisco has built in a number of versatile tools for these purposes and more with Cisco Unified Communications Manager (CUCM). This chapter explores some of the more commonly utilized tools and capabilities, from everyday use tools to in-depth troubleshooting ones.
The Cisco-packaged monitoring and troubleshooting tools are in no way limited to CUCM alone. There are tools for every application in the Cisco Collaboration System solution. Many of these utilize a combination of common tools such as Cisco Unified Serviceability and the Real Time Monitoring Tool (RTMT). There are also extensions and devices specific to individual applications and external applications developed by both Cisco and third parties. This chapter covers a number of the available applications and tools specifically aimed at troubleshooting CUCM, Cisco Unity Connection (CUC), Cisco Video Communications Server (VCS), and Voice Gateways. For the core Cisco Collaboration System applications, which include CUCM, CUCM IM&P, and CUC, this chapter discusses the following:
• Cisco Unified Serviceability
• Cisco RTMT
• Cisco Command-Line Interface (CLI)
The tools available on VCS for video issues also are discussed and include the following:
• Maintenance Tools
• Logs
• System Info
Voice or video calls within the network are typically handled easily because the enterprise is in charge of the configuration, maintenance, and traffic patterns within its network bounds. After external calls are added to the mix, an additional facet must be taken into account—that is, the variables introduced by having to deal with calls inbound and outbound across networks over which the enterprise has no control. This includes public switched telephone network (PSTN) calls, business-to-business (B2B) calls, Internet-based calls, and more. To interface these external networks, gateways are required. These gateways provide a trunking interface to the external entity. Gateways handling calls between disparate networks are typically Integrated Services Routers (ISR) and Aggregation Services Routers (ASR) as discussed in Chapter 2, “Using Troubleshooting Methodology.” A number of access methodologies and protocols may potentially be required on these devices. As such, show and debug commands commonly used on ISR gateways for purposes of monitoring and troubleshooting are discussed in this chapter.
Finally, this chapter introduces the topic of additional tools commonly used, such as packet sniffers and the Cisco Prime Collaboration Standard Suite (formerly known as Cisco Operations Manager, Cisco Service Monitor, and Cisco Provisioning Manager), which is now included, at no cost, with CUCM 10.x and later.
Chapter Objectives
Upon completing this chapter, you will be able to
• Provide an overview of the different types of tools that are useful when troubleshooting a Cisco Collaboration Systems solution
• Describe the Cisco Unified Serviceability menus and the associated tools for troubleshooting Cisco Unified Communications Manager
• Use the Cisco Unified Serviceability Control Center to stop, start, restart, and view the status of services on the Cisco Unified Communications Manager server
• Define alarm destinations and levels, look up alarm definitions, and add user notes to alarm definitions
• Configure trace settings in Cisco Unified Serviceability and explain where the generated trace output can be read
• Use the Cisco Unified Communications Manager Dialed Number Analyzer tool and Route Plan report to troubleshoot dial plans in the Cisco Unified Communications Manager configuration
• Describe the functions of Cisco Unified RTMT and explain how it can be used to collect facts for troubleshooting
• Explain how to use Cisco Unified RTMT in Cisco Unified Communications Manager to aid in troubleshooting
• Understand, at a high level, how to use the CLI in Cisco Unified Communications Manager to aid in the troubleshooting process
• Describe the information that can be gathered from the Cisco VCS System Information page
• Describe the Cisco VCS Maintenance menu and the associated tools that you can use to troubleshoot Cisco TelePresence VCS
• Describe how to interpret Cisco VCS logs and explain the content of the information that is collected from the system
• Provide an overview of how to use Cisco IOS software to support troubleshooting
• Describe how to use a general network sniffer to troubleshoot protocol issues
Cisco Unified Serviceability
The first tool discussed in this chapter is the Cisco Unified Serviceability tool. It is available with CUCM, CUCM IM&P, Cisco Unity Connection, and other unified communications applications. This section focuses on the CUCM Cisco Unified Serviceability functionality. However, it is an equally useful tool with all the applications. It is the first go-to tool in a number of scenarios, whether or not they relate to troubleshooting. As a troubleshooting tool, it is the best when it comes to testing call flow and class of restriction from the perspective of a particular phone, gateway, or other endpoint. However, that is only one of its uses. This section explores the most useful aspects of the Serviceability tool.
You access the Cisco Unified Serviceability tool through the CUCM administrative web page. You can access this page directly at the following URL:
http://<cucm IP address>/ccmservice/
In the preceding URL, the <cucm IP address> is the IP address or hostname of the CUCM node in question. If you use the hostname or fully qualified domain name (FQDN), that name must be resolvable via DNS or the local hosts file.
The most common means of accessing the tool is through the CUCM main page. Simply enter the IP address of the CUCM Publisher in the browser URL field and the following links are displayed:
• Cisco Unified Communications Manager
• Cisco Unified Communications Self Care Portal
• Cisco Prime License Manager
Figure 3-1 shows the Installed Applications page presented in the browser window.
Figure 3-1. Cisco Installed Applications Page

To reach the Cisco Unified Serviceability page, click the CUCM link, click the drop-down box in the top-right corner, select Cisco Unified Serviceability, and then click Go. Figure 3-2 shows the Cisco Unified CM Administration page where you perform this task.
Figure 3-2. Cisco Unified CM Administration Page

In the Cisco Unified Serviceability page, you can enter the application login credentials. These are the same credentials used in logging in to the CUCM administration page.
Note
Alternatively, you can browse to the CUCM Administration GUI, authenticate with Administrator credentials, and then choose the option for Unified Serviceability from the CUCM Administration GUI.
After you log in, the page presents a number of options across the top of the screen:
• Alarm
• Trace
• Tools
• SNMP
• CallHome
• Help
Figure 3-3 shows the Cisco Unified Serviceability page and the available options.
Figure 3-3. Cisco Unified Serviceability Page

Alarm
On the Alarm menu, you define and configure troubleshooting alarms (and their thresholds). Alarms are predefined events with specific thresholds that inform administrators of events that have taken place within the collaboration system. Alarms contain information related to the event in question, system, cluster, node or endpoint(s) impacted, and the recommended action to be taken. Once defined, the alarms can be collected and viewed via the RTMT (discussed in the next section). It contains two options, Configuration and Definition, as shown in Figure 3-4.
Figure 3-4. Cisco Unified Serviceability Page Alarm Menu

Select the first option, Alarm -> Configuration. It enables you to select the server, service group, and individual service to be monitored. Figure 3-5 shows an example of monitoring the Cisco CallManager service on the CUCM Publisher.
Figure 3-5. Cisco Unified Serviceability Alarm Configuration Page
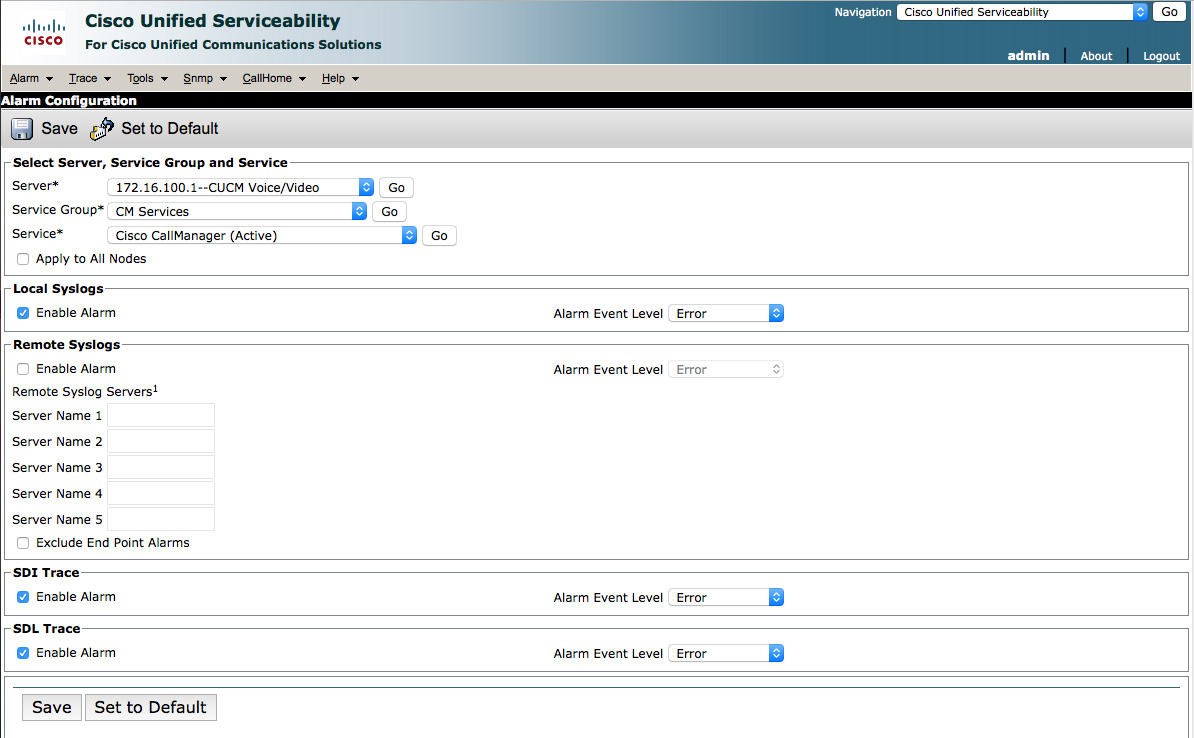
In Figure 3-5, the options are shown to apply the alarm configuration to all nodes. This enables you to monitor the selected service on all CUCM nodes based on the configuration options selected on this page. The page also allows for the configuration of destinations for the alarms. These can be local syslog servers (viewed in RTMT), remote syslog servers, system diagnostic interface (SDI) trace files, or signal distribution layer (SDL) trace files. If no syslog servers are selected, no alarms are sent. The alarms cannot be sent to CUCM nodes because they are incapable of processing the messages from another server. Additionally, there is a check box to exclude endpoint alarms. Selecting this box will route alarms to the local endpoint rather than the remote syslog server(s). When checking this box, you must also check the Apply to All Nodes box to ensure that the configuration is applied across all CUCM instances, especially those performing call control.
SDI and SDL traces are viewed and files collected via RTMT. These alarms will result in alarms logged to trace files only if the Trace On check box is selected in the Trace configuration page. This is discussed in the next section.
With the SDI and SDL trace enablement options are drop-down fields for selection of the alarm event level. These levels include
• Emergency: Indicates the level designating that the system is unusable
• Alert: Indicates that immediate action is needed
• Critical: Detects a critical condition
• Error: Notes than an error condition exists
• Warning: Indicates normal function, but attention is needed
• Notice: Indicates a significant event that is not impacting service
• Debug: Provides detailed event information used by Cisco TAC (use with caution)
SDI traces provide log files that contain run-time events occurring in the involved software routines. SDL traces offer call-processing information from CUCM and CUCM CTIManager services. A third option, Log4J, is used for Java application logging.
Selecting the second option, Alarm -> Definition, provides information on searching, viewing, and creating user information for alarm definitions displayed in the Cisco Unified Serviceability page.
When identifying a search for an alarm definition, select the alarm catalog and alarm definition desired. The alarms available include those for System, CUCM, and CUCM IM&P. There is also a field for the alarm name. If it is left blank, all alarm definitions in the selected catalog are listed. Figure 3-6 shows the Alarm Message Definition page.
Figure 3-6. Cisco Unified Serviceability Alarm Message Definition Page

Selecting an alarm definition shows the relevant information concerning the alarm. In the figure, the last alarm in the list is BChannelOOS, which is “B Channel Out of Service.” This means that a bearer channel on a digital circuit has gone out of service for some reason and needs to be investigated. For a Basic Rate Interface (BRI), these usually come in pairs because there are two bearer channels (B channels) in a BRI. For a T1 primary rate interface (PRI), there are 23 bearer channels. So, this may well generate a large number of alerts. For purposes of an example, Figure 3-7 shows the Alarm Information page for the CallManager BChannelOOS alarm.
Figure 3-7. Cisco Unified Serviceability Alarm Information Page

Trace
On the Cisco Unified Serviceability page, you can enable traces at various levels of output. It also allows the traces to be defined with varying levels of scope to limit output to the most relevant aspects required for a particular troubleshooting task. As mentioned previously, there are three types of traces:
• SDI Traces: The output of these traces populates local log files. Every CUCM service includes a default log trace log file. Log entries include the IP address, Transmission Control Protocol (TCP) handle, device name, time stamp, and more possible informational elements that provide information to be utilized in reviewing the SDI trace. SDI traces monitor run-time events occurring within selected software routines.
• SDL Traces: The output of these traces contain call-processing information from services, such as the Cisco CallManager service and the Cisco CTIManager service, to trace calls and log state transition information for each call.
• Log4J Traces: These are used in gathering specific levels of information related to Java application debugging and troubleshooting.
Note
Before contacting the Cisco Technical Assistance Center (TAC) for CUCM call, signaling, application, endpoint registration, and other issues, be sure to have the time stamp when a certain event happened and try to collect SDI and SDL traces that will help the TAC engineer hasten the resolution of the case.
Traces can be enabled in two ways. They can be enabled per server and per service with all possible options enabled, or they can be enabled per server, per service with filtering options. Table 3-1 shows the differences between the two ways of configuring traces.
Table 3-1. Trace Configuration Options

Note
The general rule in using troubleshooting traces is to enable them, gather the information required for troubleshooting, and then disable them. This is especially true for levels of logging that generate a high amount of output, specifically the debug level. It is not recommended to leave a debug level trace running for extended amounts of time. A Cisco TAC representative may ask you to enable a certain set of traces with a higher debug level (usually detailed) for a limited time during the troubleshooting process.
Figure 3-8 shows the options available under the Trace menu.
Figure 3-8. Cisco Unified Serviceability Trace Menu

Selecting Trace -> Configuration provides the opportunity to select the server in question, desired service group, and service desired for the trace. Figure 3-9 shows the Trace Configuration page after all these options have been selected. For purposes of this example, the CUCM publisher was chosen as the server, CM Services as the service group, and Cisco CallManager as the service to be monitored.
Figure 3-9. Cisco Unified Serviceability Trace Configuration Page

In Figure 3-9, you can see the option to apply the trace configuration to all nodes. This enables the trace with the chosen parameters on all CUCM nodes in the cluster. Additionally, the Trace On check box enables or disables the trace with the selected parameters.
The trace output can be filtered to limit the amount of information required for troubleshooting a specific type of event. Initially, it may be helpful to include a wide array of options and then use a text editor such as Notepad++ (PC) or TextWrangler (Mac) to color-code instances of specific recurrences of event-specific text (such as a unique call identifier, for example) while working with the file itself. Figure 3-10 shows an example of narrowing down the output associated with a phone’s device ID in an SDL trace.
Figure 3-10. TextWrangler Output from an SDL Trace

Note that the SDL trace contains device signaling and registration events. These events are specific to the device itself, with the Device Name and Device ID specified in the output of the file. Figure 3-11 shows a sampling of the output of the SDL file. Each line in the file contains a very long string of text with multiple columns delineated by a pipe ( | ). As such, text formatting on the page in nongraphic format would be exceedingly difficult. So, it has been taken as a screenshot. That said, even the screenshot encompasses only a subset of each line within the file.
Figure 3-11. Text Output from an SDL Trace

In Figure 3-11, a number of events are apparent, including Media Gateway Control Protocol (MGCP) events, Session Initiation Protocol (SIP) events, and so on. At the far right, the device name of the specific endpoint in question is noted. Each device name starts with “SEP” followed by the Media Access Control (MAC) address of the endpoint. By using an advanced text editor to track and color a specific device name or MAC address, events relevant to a specific endpoint can be tracked and filtered.
In troubleshooting, tracking and filtering help narrow the output to be parsed. This is especially true when using a particular device to replicate an error or quality issue to capture the event(s) in the log files for review and submission to Cisco TAC in association with an active case.
After the event(s) in question is narrowed down, the filter can be narrowed to squelch the volume of output that must be parsed in troubleshooting a given issue.
In the Trace Filter Settings, select the level of logging output along with the desired call-processing elements desired. The more boxes that are checked, the more voluminous the output contained within the file will be.
After the traces are enabled to the extent desired, the next step in troubleshooting is to recapture the event in question. That is, the issue you are troubleshooting must be replicated and captured. This is not always the easiest thing to do. Some errors, such as echo or one-way audio, may be easily replicated. Others may be transient and intermittent. The idea is to enable the traces, replicate the issue, and then harvest the log files. If the traces were enabled with a very high degree of logging, such as at the debug or detailed level, you might need to disable the traces prior to harvesting and parsing the log files.
Activating troubleshooting traces is the best way to avoid missing potentially relevant information; however, an immense amount of information is gathered. That translates not only to a large amount of irrelevant information to review but also to a significant performance impact on the servers against which the traces are run.
By using the Trace Configuration page, you can gather service-specific information. Activating the troubleshooting traces can be detrimental, however, especially when you are dealing with instability. Start with specifics and work outward as needed to gather the information required.
Figure 3-12 shows an example of trace output broken down into a slightly more digestible size. This is actually a subset of output from multiple calls with the relevant pieces extracted and highlighted for discussion.
Figure 3-12. Sample Trace Output (Truncated)

Figure 3-12 shows a new call. If you look closely, you can see that the New Call button was pushed rather than the phone handset being taken off hook. The beginning of the digit analysis can be seen with the fully qualified called number (FQCN) being 201-201-2001. Also visible is the list of partitions contained in the combined calling search space (CSS) available to both the device and line in use. This is known as a partition search space and is also commonly referred to as the class of restriction (in legacy PBX terminology).
Further down (remember, this output is truncated), the output shows that CUCM has matched a route pattern for another call that has been placed. In this case, the number dialed, 914087071222, matched the route pattern, 9.1408XXXXXXX. The route pattern 9.1[2-9]XX[2-9]XXXXXX would have also been a match. However, CUCM chooses the most explicit match for call routing. Because the 9.1408XXXXXXX pattern was an explicit match for more of the dialed digits, it was selected.
At the bottom of Figure 3-12, another call has been placed. The output shows the route list selection based on the route pattern selected for call routing. The route list contains one or more route groups that contain egress gateway trunk or interface selection information.
Customizing Traces
Much of the troubleshooting performed on a CUCM cluster is associated with the Cisco CallManager service. This is the place where you can find information regarding dial plan, digit analysis, and device issues. It is important to remember that CUCM traces, by default, do not include information about translation patterns and alternate matching patterns. Only the final matched pattern is shown in the logs, regardless of the level of trace performed. To get around this, you can create more detailed logging by changing the Cisco CallManager service parameter Digit Analysis Complexity from its default setting, StandardAnalysis, to TranslationAndAlternatePatternAnalysis. The trace output shows “dac=0” for StandardAnalysis and “dac=1” for TranslationAndAlternatePatternAnalysis.
To change that service parameter, open the CCMAdmin page and click System -> Service Parameters. Select the CUCM Server desired in the drop-down field and then select the Cisco CallManager service from the presented drop-down field. The screen shows the available options for the Cisco CallManager service. You don’t need to switch the view to advanced mode. Scroll down a short distance to the System section, in which you will find the Digit Analysis Complexity field. Click the drop-down field and select TranslationAndAlternatePatternAnalysis. Figure 3-13 shows the Cisco CallManager Service Parameters page.
Figure 3-13. Cisco CallManager Service Parameters Page

Another frequently utilized setting in larger environments is the enterprise parameter Max Number of Device Level Trace. It sets a hard limit on the number of devices that can be traced concurrently. This setting defaults to 12 and cannot exceed 256. You should take care in changing enterprise parameters. When the settings are saved and then applied, there is a clusterwide reconfiguration of devices. This may be a restart or a reset, depending on the device in question.
If you want to generate an alarm every time a specific search string shows up in a monitored trace file, the alert, LogFileSearchStringFound, can be enabled in RTMT. You can find this setting in the LpmTctCatalog alarm. In the Cisco Unified Serviceability tool, click Alarms -> Definitions. Then select System Alarm Catalog and LpmTctCatalog. You can leave the Alarm field blank or enter LogFileSearchStringFound and click Find. When the link to the LogFileSearchStringFound alarm is presented, click it and enter the desired text that should generate the alert. Figure 3-14 shows the Alarm Information page.
Figure 3-14. Cisco Unified Serviceability Alarm Information Page

CUCM Communication with SCCP IP Phones
The Skinny Client Control Protocol (SCCP) is proprietary to Cisco and has been the de facto standard for Cisco IP Phones for a long time. After a long wait, SIP has finally reached feature parity with SCCP. As such, SCCP will be slowly deprecated over the coming years in favor of SIP. SCCP will continue to be supported for existing handsets for a long time to come. However, the newer models of endpoints will be created and deployed with SIP in mind.
The vast majority of phones deployed in Cisco Collaboration Systems remain firmly on the side of SCCP. With that in mind, some discussion of CUCM communication with SCCP phones is warranted. A number of message types are used between the phone and CUCM. This part of the chapter examines some of the trace output that identifies those messages.
StationInit messages are sent from the IP phone to CUCM. These events include indicators such as
• Soft key presses (SoftKeyEvent)
• Keypad button presses (KeypadButton)
• Other phone button presses (Stimulus)
StationD messages are sent from CUCM to the IP Phone. These events include
• Phone Display Events
• SetLamp: Turn on or off lights on the phone
• CallState: Indicate on-hook, off-hook, ringing, connected, and so on
• SelectSoftKeys: Change softkey layout according to call state
• Phone Tones
• SetRinger: Tells the phone to ring
• StartTone: Tells the phone to play a dial tone or secondary dial tone
• StopTone: Tells the phone to stop playing a dial tone
• Call Information
• DialedNumber: Indicates the number to be shown on the display
• CallInfo: Includes callingParty, alternateCallingParty, and so on
• DisplayNotify: Show messages on the IP phone display (for example, Not Enough Bandwidth or Fallback Active)
• RTP Flows
• StartMediaTransmission: Begin RTP stream
• StopMediaTransmission: Stop RTP stream
• OpenReceiveChannel: Open UDP Port Number
• CloseReceiveChannel: Close UDP Port Number
During call setup, you can see another set of messaging types in the trace files. Each call begins with digit analysis on a digit-by-digit basis. This information is found in the CCM|Digit analysis trace. The most relevant information in these messages includes the following:
• Pss: Partition Search Space is a list of partitions to be searched for a route pattern match. It is a concatenation of the calling search spaces of both the line and device.
• ToDFilteredPss: Time of Day Filtered PSS is the same as the PSS but takes into account those partitions that may be active or inactive based on time of day routing configuration.
• cn: The calling number is the caller ID of the calling party before any configured external phone number mask is applied. This is also the directory number (DN).
• fqcn: The fully qualified calling number is the calling-party number of the IP phone after the external phone number mask is applied.
• dac: The digit analysis complexity indicated whether Standard Analysis (dac=0) is used or Translation and Alternate Pattern Analysis (dac=1) is used.
After the best matching route pattern is found, detailed information regarding the match is added to the trace file. This shows up as CCM||. The information includes
• PretransformCallingPartyNumber: The calling-party number prior to any digit manipulation
• CallingPartyNumber: The CN of the IP phone (also the DN)
• FullyQualifiedCallingPartyNumber: The FQCN of an IP phone after the external phone number mask has been applied
• DialingPattern: The route pattern that is matched
• PretransformDigitString: The called-party number prior to any digit manipulation
After CUCM makes the call-routing decision, the path selection begins. The path is specified by the route pattern that has been matched, so there’s not a great deal of actual selection going on at this point. What is provided in the trace file is a detailed accounting of the CCM|RouteList contents; this includes
• RouteListName: The name of the route list specified by the route pattern
• RouteGroup: The number of route groups contained within the selected route list
Within the trace file, you can monitor the gateway selection by looking at the RouteListCdrc entries. This shows the selection of the devices indicated within the route list. You may see skipToNextMember, which indicates that the next route group will be examined, or executeRouteAction, which indicates that the currently selected device will be attempted to initiate the call.
Now that the source and destination are both in place, the next step is to ensure that the call can set up without affecting other calls that may already be in place. This is the purpose behind the call admission control (CAC) functionality. If the act of setting up the current call exceeds the parameters specified in the location configuration, the call will not be allowed to proceed. The trace output for this is found in the CCM|Locations trace record and in the reserveBandwidth message. This includes the parameters for required bandwidth (bw), currently in use bandwidth (curr), and maximum bandwidth (max).
The bandwidth utilized by a given call depends on the codec selected for that call. The codec selection is handled by the Region configuration. In the Region configuration page, the codec to be utilized for both intraregion (within the region) calls and inter-region (between regions) calls is specified. The CCM|RegionsServer trace records include string match capabilities showing the maximum permitted bandwidth per call that can be consumed by the codec in use for the call. This refers solely to the voice bandwidth of the codec, without any regard for packetization overhead.
Media resources are an integral part of the overall collaboration system. They provide music on hold, conference bridging, transcoding, media termination points (MTP), and more. They are controlled in the CUCM configuration through Media Resource Groups (MRG) and Media Resource Group Lists (MRGL). In the CCM|MediaResourceManager trace records, you can find information regarding the required media resources invoked at various points throughout a call. The sendMTPXcoderAllocationRequest string shows that an MTP or transcoding resource has been requested. These records also provide information regarding the regions used by both endpoints (CapCount, Region) and the MRGL used for selection of the media resource. The selected device shows up by its name in the CCM|MediaTerminationPointControl trace records.
It is prudent to mention that, if the two endpoints do not have a codec in common in the Region configurations, the call will ring but will not actually begin sending audio. So, both ends hear only silence.
After the traces are captured, the RTMT’s Trace & Log Central option is used to collect, compress, and download the information so that it can be attached to a TAC case or reviewed internally.
Tools
The most commonly utilized aspects of Cisco Unified Serviceability exist under the Tools menu. These tools allow you to configure services, digit analysis, call detail recording, and more. Figure 3-15 shows the options available under the Tools menu.
Figure 3-15. Cisco Unified Serviceability Tools Menu

As shown in Figure 3-15, the following are available under the Tools menu:
• Service Activation
• Control Center – Feature Services
• Control Center – Network Services
• Serviceability Reports Archive
• Audit Log Configuration
• Locations
• Dialed Number Analyzer
• CDR Analysis and Reporting (CAR)
• CDR Management
Service Activation
On the Service Activation page, you can start and stop feature services. Until activated here, the services on a CUCM node are inactive. Any combination of services may be started and/or stopped. However, key services are required for individual roles that a CUCM node may play. For example, not every node runs the Cisco TFTP service. Only those nodes that provide TFTP services to IP phones run the service. Not every node runs the Cisco CallManager service. Only those nodes that provide call control services run that service. Dedicated TFTP servers and the CUCM Publisher (in a large cluster deployment) often do not run the Cisco CallManager service. Figure 3-16 shows the first half of the Service Activation page.
Figure 3-16. Service Activation Page

A number of additional services are available for activation/deactivation further down the Service Activation page. Services are activated or deactivated on a per-server basis. This also applies to CUCM as well as CUCM IM&P, Unity Connection, and other UC application server nodes.
Control Center – Feature Services
The Control Center allows the viewing of service status, status refresh, and the start/stop/restart of services. Only one service can be manipulated at a time. While the service is starting, stopping, or restarting, the page is unavailable. Figure 3-17 shows the Control Center – Feature Services page.
Figure 3-17. Control Center – Features Services Page

Like the Service Activation page, the Control Center – Feature Services page is not fully represented in the figure. A number of services are available further down the page. This page is primarily dedicated to services that relate directly to CUCM features and functionality. Next to each service is a radio button. Clicking the radio button selects the service for an action represented in the button bar at the top of the page: Start, Stop, Restart, Refresh Page. Refresh Page doesn’t actually do anything with the services; it merely refreshes the Up Time column and shows any state change in the services between the refresh and the last refresh interval.
Some system and configuration changes require services to be restarted. Some services can be restarted from this page, others from the Control Center – Network Services page, and other still, such as Cisco Tomcat, from the command-line interface (CLI) only.
To start a service, you must set the Activation Status to Activated. If it appears as Deactivated, the service must be activated in Service Activation before you can start it. You may stop or restart a running service by clicking the radio button next to it and clicking Stop or Restart, accordingly. The page refreshes after a short amount of time, now showing the updated status of the service.
Control Center – Network Services
The Control Center – Network Services page, shown in Figure 3-18, is virtually identical to its counterpart, the Control Center – Feature Services page.
Figure 3-18. Control Center – Network Services Page

This page deals primarily with services relating to the underlying platform of CUCM as well as its monitoring and management. It includes the services related to the RTMT, database management, database replication, and web services. It is worthy of restating a small tidbit of information here: although the services appear here, they cannot all necessarily be restarted from here. For example, as mentioned previously, you can restart Cisco Tomcat only from the CLI, but it is listed here. Additionally, there is a radio button next to it. So, by all accounts, it appears that it can be manipulated here. However, clicking the radio button next to Cisco Tomcat results in the pop-up shown in Figure 3-19.
Figure 3-19. Control Center – Network Services Cisco Tomcat Service Warning

The same pop-up occurs if A Cisco DB, Cisco CallManager Serviceability, or Cisco CAR DB are chosen. Selecting the Cisco License Manager service generates a pop-up which states that the service cannot be started or stopped.
Serviceability Reports Archive
The Serviceability Reporter service generates daily reports. Each report provides a summary of activity and statistics for a particular report. Figure 3-20 shows the Serviceability Reports Archive page.
Figure 3-20. Serviceability Reports Archive Page

To view the reports, you must activate the Cisco Serviceability Reporter service in Control Center – Feature Services. This service is quite CPU intensive. Cisco recommends that this service not be activated on non-call-processing nodes. Available reports include
• Alerts
• Call Activities
• Device Reports
• Performance Reports
• Server Reports
• Service Reports
Audit Log Configuration
The Audit Log tracks changes made to CUCM. To function, the Cisco Audit Event Service must be enabled in Control Center – Network Services. It monitors and logs any configuration changes made to CUCM as a result of a user action.
It is important to note that only a user with an audit role can change the audit log settings. By default, for CUCM, the CCMAdministrator possesses the audit role after fresh installs and upgrades. The audit role can be assigned to other users, as desired. Figure 3-21 shows the Audit Log Configuration page.
Figure 3-21. Audit Log Configuration Page

On this page, you can see and alter the Audit configuration parameters. There are two sections on the page: Application Audit Log Settings and Database Audit Log Filter Settings.
The Application Audit Log Settings include the enabling of audit logging, purging of logs, and log rotation. All these settings are enabled by default.
Also, in the settings are options to enter a syslog server (and logging level), output settings allowing the administrator to set the maximum number of log files that can be created and the maximum size of each. By default, 250 files of 2 MB each can be created.
The Database Audit Log Filter Settings allow you to enable auditing and the audit level. Note that Database Audit Logging is disabled by default. The reason is that it is exceedingly resource intensive and generates a large amount of data in a short period of time. This is especially true if the Debug Audit Level is set to a highly detailed level such as Database Updates or Database Reads. If the database must be debugged, it is recommended that it be done only for short periods of time using the Database Updates level. The available Debug Audit Levels are
• Schema: Tracks changes to the setup of the audit log database
• Administrative Tasks: Tracks all administrative changes to the CUCM and all schema changes
• Database Updates: Tracks all changes to the database plus all schema and all administrative tasks
• Database Reads: Tracks every read to the system, plus all schema changes, administrative tasks, and database updates
As mentioned, application auditing is enabled by default and is centralized. The logs are configured automatically to rotate as needed to avoid taking up large amounts of disk space. If the AuditLogAlarmMonitor cannot write an event, it logs a critical error in the syslog file. The Alert Manager reports this error as a part of a SeverityMatchFound alert and is visible in RTMT Trace & Log Central.
The Cisco Unified Serviceability, RTMT, CAR, and CCMAdmin components all generate audit events. Example 3-1 shows an audit event log entry.
Example 3-1. Audit Log Example
CCM_TOMCAT-GENERIC-3-AuditEventGenerated: Audit Event Generated
UserID:CCMAdministrator Client IP Address:172.19.240.207 Severity:3
EventType:ServiceStatusUpdated ResourceAccessed: CCMService EventStatus:

Successful Description: Call Manager Service status is stopped App ID:Cisco Tomcat
Cluster ID:StandAloneCluster Node ID:sa-cm1-3
Highlighted in Example 3-1 are the primary points of interest. The user, CCMAdministrator, stopped the Cisco CallManager service. Hopefully, this was a planned event because stopping that service ceases all call-processing activity on the impacted CUCM node.
Locations
The Locations feature enables you to view details of the configure locations in an enterprise. It also helps you understand the link and inter- and intralocation discrepancies by providing a view of the effective path between two locations and identifying disconnected groups of locations. In support of this, there are multiple views under the Locations tool:
• Topology: Refers to a modeled topology representing flow of media in a network
• Discrepancy: Displays conflicts in assertions for various location configurations
• Effective Path: Details the media path for audio, video, or immersive calls between two locations
• Disconnected Groups: Enables viewing and analysis of any disconnects between locations within the topology
Figure 3-22 shows an example of the output from the Locations Topology page.
Figure 3-22. Locations Topology Page

In Figure 3-22, the location hq is detailed out from a connectivity standpoint. Intralocation bandwidth for audio, video, and immersive media traffic is shown, followed by information on adjacent locations and the associated bandwidths.
Figure 3-23 shows the Locations Effective Path page for a path between the hq and remote-branch locations.
Figure 3-23. Locations Effective Path Page

In Figure 3-23, the path and bandwidth available between the two locations are examined, and the selected path is shown in bold type.
In the case of Discrepancy and Disconnected Groups, no figures have been attached. The reason is that the only output returned is a single line of text denoting that no discrepancies exist or that no disconnects exist.
Dialed Number Analyzer
One of the most useful tools available for configuration, troubleshooting, and analyzing call flow and/or dial plan is the Dialed Number Analyzer (DNA). To use the DNA, you must enable the DNA service in Control Center – Feature Services. Select Tools -> Dialed Number Analyzer in Cisco Unified Serviceability, and it launches another browser window specifically for the DNA tool. Figure 3-24 shows the home page of the Dialed Number Analyzer.
Figure 3-24. Dialed Number Analyzer Page

You can access the DNA main page directly by pointing a browser to the following URL:
http://<cucmpub>/dna
In the preceding URL, <cucmpub> is the IP address or hostname (DNS short name or FQDN) of the CUCM Publisher. The DNA offers three options: Analysis, Service, and Help. It uses a replica of the CUCM database configuration to analyze calls in a dial plan. With that in mind, it must be in sync with the CUCM database before you use the tool to perform any analysis. DNA database synchronization is enabled via the Service -> Control Center page in the DNA. Figure 3-25 shows the Service Control Center Page of the DNA.
Figure 3-25. Dialed Number Analyzer Service Control Center Page

In Figure 3-25, only two service options are shown. The first is enabling or disabling CUCM database synchronization. It’s enabled by default. The second deals with learned route patterns and whether they have been added to the DNA. These patterns come from the dynamic call control discovery features in CUCM.
After the services are enabled in Control Center – Feature Services and the DNA database is in sync with the CUCM database, the DNA will function properly.
All the magic of the DNA exists within the Analysis menu. The analysis can be used to test a calling search space, test call flow from a gateway perspective, or test it from the perspective of a particular line on a device. Under Analysis, the following options are presented:
• Analyzer
• Gateways
• Phones
• Trunks
• Multiple Analyzer
• View File
Analyzer facilitates simple analysis of a dial string between two endpoints. Figure 3-26 shows the Analyzer page.

The simple analysis enabled by the Analyzer can test calling between a source and a destination based on a particular calling search space at a particular date and time. When these options are provided, you can test features such as class of restriction or time of day routing prior to deployment. Example 3-2 shows the output returned from the analysis.
Example 3-2. Simple Analysis Using the DNA
  Results Summary
Calling Party Information
Calling Party = 2001
Partition = Directory URI:pt-all-phones:pt-blocked:pt-no-local:pt-no-ld:pt-no-intl
Device CSS =
Line CSS = lcss-internal
AAR Group Name =
AAR CSS =
Dialed Digits = 2005
Match Result = RouteThisPattern
Matched Pattern Information
Pattern = 2005
Partition = pt-all-phones
Time Schedule = All the time
Called Party Number = 2005
Time Zone = CST6CDT
Call Classification = OnNet
InterDigit Timeout = NO
Device Override = Disabled
Outside Dial Tone = NO
  Call Flow
Directory Number :DN= 2005
Partition = pt-all-phones
TypeCFACSSPolicy = Use System Default
Call Classification = Unknown
Forwarding Information
Forward All : DN = VoiceMail = No CSS =
Forward Busy
Internal : DN = VoiceMail = Yes VoiceMailBoxNumber = 2005 CSS =
External : DN = VoiceMail = Yes VoiceMailBoxNumber = 2005 CSS =
Forward No Answer
Internal : DN = VoiceMail = Yes VoiceMailBoxNumber = 2005 CSS =
External : DN = VoiceMail = Yes VoiceMailBoxNumber = 2005 CSS =
Forward No Coverage
Internal : DN = VoiceMail = Yes VoiceMailBoxNumber = 2005 CSS =
External : DN = VoiceMail = Yes VoiceMailBoxNumber = 2005 CSS =
Forward Unregistered
Internal : DN = VoiceMail = Yes VoiceMailBoxNumber = 2005 CSS =
External : DN = VoiceMail = Yes VoiceMailBoxNumber = 2005 CSS =
CFDF : DN = VoiceMail = Yes VoiceMailBoxNumber = 2005 CSS =
Pickup Group Number =
Device :Type= Cisco 8865
Device Status = Registered
Device Name = SEP74A02FC0A5B5
Ignore Presentation Indicators = Disabled
Logged Into Hunt Groups = Enabled
Alerting Name = Brian Morgan
Dual Mode = Disabled
Do Not Disturb(DND)
DND Status = Disabled
DND Option =
DND Incoming Call Alert =
Automated Alternate Routing (AAR)
AAR Group Name =
AAR Calling Search Space =
AAR VoiceMail Status = Disabled
AAR Destination Mask =
AAR Prefix Digits =
  Alternate Matches
Note: Information Not Available
In Example 3-2, some salient aspects of the analysis are highlighted. The first is the PSS of the originating line and device. The second highlight is the match result and the action to be taken, RouteThisPattern. Finally, the destination device is detailed, including the alerting name and other information such as the phone device type, its registration status, and its device name.
The Analyzer allows the same analysis to be performed using any valid dialing mechanism, including phone number, directory number, SIP route pattern, or URI. If the test call is subject to time of day routing rules, alter the date/time settings accordingly based on whether you wish to test the open times or closed times. When the analysis is complete, you can download and save it for future reference.
The DNA enables you to find and list gateways to test inbound calling capabilities and flow. It is a test of the gateway’s inbound calling search space. The function is similar to the Analyzer in that a source and destination are selected. However, this time, the source is an inbound interface on a gateway such as a T1 PRI. Figure 3-27 shows the DNA Gateway Configuration page.
Figure 3-27. DNA Gateway Configuration Page

When you select Gateways in the Analysis menu, you must follow it with the selection of the ingress interface. In Figure 3-27, the gateway and ingress PRI interface have been selected. The inbound calling-party number and called-party numbers have been specified. Example 3-3 shows the output of the DNA results.
Example 3-3. DNA Gateway Analysis Results
Results Summary
Calling Party Information
Calling Party = 8175551212
Partition =
Device CSS = css-gateways
Line CSS =
AAR Group Name =
AAR CSS =
Dialed Digits = 2005
Match Result = RouteThisPattern
Matched Pattern Information
Pattern = 2005
Partition = pt-all-phones
Time Schedule = All the time
Called Party Number = 2005
Time Zone = CST6CDT
Call Classification = OnNet
InterDigit Timeout = NO
Device Override = Disabled
Outside Dial Tone = NO
Call Flow
Directory Number :DN= 2005
Partition = pt-all-phones
TypeCFACSSPolicy = Use System Default
Call Classification = Unknown
Forwarding Information
Forward All : DN = VoiceMail = No CSS =
Forward Busy
Internal : DN = VoiceMail = Yes VoiceMailBoxNumber = 2005 CSS =
External : DN = VoiceMail = Yes VoiceMailBoxNumber = 2005 CSS =
Forward No Answer
Internal : DN = VoiceMail = Yes VoiceMailBoxNumber = 2005 CSS =
External : DN = VoiceMail = Yes VoiceMailBoxNumber = 2005 CSS =
Forward No Coverage
Internal : DN = VoiceMail = Yes VoiceMailBoxNumber = 2005 CSS =
External : DN = VoiceMail = Yes VoiceMailBoxNumber = 2005 CSS =
Forward Unregistered
Internal : DN = VoiceMail = Yes VoiceMailBoxNumber = 2005 CSS =
External : DN = VoiceMail = Yes VoiceMailBoxNumber = 2005 CSS =
CFDF : DN = VoiceMail = Yes VoiceMailBoxNumber = 2005 CSS =
Pickup Group Number =
Device :Type= Cisco 8865
Device Status = Registered
Device Name = SEP74A02FC0A5B5
Ignore Presentation Indicators = Disabled
Logged Into Hunt Groups = Enabled
Alerting Name = Brian Morgan
Dual Mode = Disabled
Do Not Disturb(DND)
DND Status = Disabled
DND Option =
DND Incoming Call Alert =
Automated Alternate Routing (AAR)
AAR Group Name =
AAR Calling Search Space =
AAR VoiceMail Status = Disabled
AAR Destination Mask =
AAR Prefix Digits =
Alternate Matches
Note: Information Not Available
In this example, the called-party number was shortened to 2005. The resulting information shows the inbound call flow and successful completion of the call. You can test the inbound CSS of a configured trunk by selecting Analysis -> Trunks rather than Gateways. Otherwise, the general idea is the same. An inbound call is simulated hitting the trunk, at which time the inbound CSS is parsed to find a match and decide whether to forward the call.
You can test phones in a similar manner. The class of restriction or PSS of a specific line on a specific phone can be tested using the Phones option in the DNA Analysis. Figure 3-28 shows an example of an 8865 phone dialing a 900 number from its primary line.
Figure 3-28. DNA Phone Configuration Page

In Figure 3-28, the specific phone had to be found and selected. Then the line on the phone was chosen to test the dial-out capabilities. Finally, the dialed digits were entered along with a time of day, if relevant. Example 3-4 shows the resulting output from the DNA.
Example 3-4. DNA Phone Analysis Output
  Results Summary
Calling Party Information
Calling Party = 2005
Partition = pt-all-phones
Device CSS = dcss-hq
Line CSS = lcss-intl
AAR Group Name =
AAR CSS =
Dialed Digits = 919005551212
Match Result = BlockThisPattern
Route Block Cause = Call Rejected
Matched Pattern Information
Pattern = 9.1900XXXXXXX
Partition = pt-blocked
Time Schedule =
Called Party Number = 919005551212
Time Zone = CST6CDT
Call Classification =
InterDigit Timeout = NO
Device Override = Disabled
Outside Dial Tone = NO
  Call Flow
Note: Information Not Available
  Alternate Matches
Partition :Name= pt-hq-pstn
Pattern
Pattern = 9.1[2-9]XX[2-9]XXXXXX
Pattern Type = Enterprise
Call Classification = OffNet
CallManager Device Type = AccessDevice
PatternPrecedenceLevel = PlDefault
PatternRouteClass = RouteClassDefault
In this case, a blocking translation pattern was being tested. When the DNA simulation dialed the 900 number from the phone, it was blocked by the translation pattern with a call-rejected message. The alternate match is listed, but it does not change the route selection or the blocking of the call.
The Multiple Dial Plan support feature performs multiple analyses and bulk testing of dial plans. The DNA Multiple Analysis function allows you to choose a comma-separated value (CSV) file containing a list of data required for analysis. After it is analyzed, the bulk results are displayed. A sample CSV template file, called DNATemplate.xlt, is stored on the server during installation. It can be downloaded to the desktop and populated accordingly. The dialing destinations in the file will be simulated against the calling party specified in the file. The DNATemplate.xlt file is a spreadsheet with macros (need to enable macros) broken into sections.
Section 1 contains the capability to specify the calling-party number and dialed digits, or perform an SIP analysis. So, if you enter a URI as the calling-party number, that URI is populated as the calling-party number in all the patterns to be test dialed.
Section 2 is a Multiple Analyzer Query table in which additional information can be added if desired (for example, a calling search space). Each row in the spreadsheet represents a separate DNA query. The maximum number of queries is 500.
SNMP
Simple Network Management Protocol (SNMP) is an application layer protocol that facilitates the management of network entities via information exchange. SNMP is part of the TCP/IP suite. It enables administrators to remotely manage network performance, find and solve network issues, and plan for network growth.
The SNMP settings within the Cisco Unified Serviceability tool allow the configuration of community strings, users, and notification destinations for version 1, 2c, and 3 SNMP services. The SNMP settings within Serviceability are per-node settings. However, they can be applied to all nodes in the cluster. For it to function, you must activate and run the Cisco CallManager SNMP service. Figure 3-29 shows the SNMP Configuration options within Serviceability.
Figure 3-29. Cisco Unified Serviceability SNMP Menu Options

Figure 3-29 shows the three options: V1/V2, V3, and System Group. V1/V2 allows for configuration of community strings and notification destinations. V3 adds the functionality of allowing configuration for users and notification destinations. The System Group option allows configuration of a system contact for the management information base 2 (MIB2) system group.
Call Home
The Call Home feature allows the cluster to communicate with and send diagnostic alerts, inventory, and other messages to the Smart Call Home back-end server. Smart Call Home provides proactive diagnostics, real-time alerting, and remediation for Cisco devices to facilitate higher network resource availability. In other words, when a problem begins with the cluster, or has occurred, the Call Home function can already be in the process of troubleshooting and engaging resources to mitigate the impact.
You can configure the Call Home feature to maintain anonymity of the entity on which it is configured. Inventory, messages, alerts, and other telemetry information are kept entirely anonymous within the Call Home back-end infrastructure. Figure 3-30 shows the Call Home Configuration page.
Figure 3-30. Call Home Configuration Page

In Figure 3-30, the first setting is the Call Home field. It allows the service to be disabled (default), enabled for Smart Call Home, or enabled for anonymous Call Home. Additionally, contact information fields are provided, in addition to options to send data to TAC, along with e-mail cc fields and the option to include trace files and diagnostic info. If these settings are enabled, all this information is sent automatically.
Cisco RTMT
The Cisco Real Time Monitoring Tool is a Java-based graphical tool specifically built to assist in the monitoring and management of Cisco Collaboration System applications. It provides real-time performance counters and enables collection of traces. The performance counters can be node specific, cluster specific, or system specific (for example, CUCM counters versus IM&P counters). Objects comprise logical groups of similar counters for specific devices or features. Counters measure a wide array of metrics concerning overall system performance. These counters provide numerical information such as number of phones registered, number of calls in progress, and so on.
For CUCM, you install the tool by choosing Application -> Plugins on the CCMAdmin page. Quite a few plugin applications exist within the list provided, so it may help to set a query along the lines of Name contains Real-Time and then click Find. Figure 3-31 shows the list returned with this query in place.
Figure 3-31. CUCM Find and List Plugins Page

The tool can be installed on workstations with either Windows- or Linux-based operating systems. This chapter focuses on the Windows version. To install the application, download the plugin and launch the executable installer. Be sure to click the Download link rather than the text of the plugin name itself. If you click the name of the plugin, you are presented with an opportunity to provide a custom URL pointer for the executable file. Generally, this is not the desired action.
RTMT utilizes Hypertext Transfer Protocol Secure (HTTPS) and TCP to monitor device status, measure system performance, discover devices, and make use of CTI applications related to CUCM. A single instance of RTMT is needed to monitor CUCM, Cisco Intercompany Media Engine (IME), CUCM IM&P, and overall cluster health. Cisco Unity Connection also uses RTMT, but it will need to install its own instance.
After the tool is installed and launched, it prompts for a username and password to authenticate to the CUCM node and get logged in. When you’re logged in to the application, notice that along the left-hand column of the screen is a navigation bar. The four sections within the column are
• System: Monitors overall system health, server resources, performance counters, alerts, trace collection, and syslog messages
• Voice/Video: Provides CUCM node information regarding call processing, media flow, device-level activities/monitoring, service monitoring, and CTI counters
• Analysis Manager: Allows collection of traces and log files from pre-identified collaboration system applications, including CUCM, Cisco Unified Contact Center Enterprise (UCCE), Cisco Unified Contact Center Express (UCCX), Cisco IOS Gateways, Cisco Unity Connection, and CUCM IM&P
• IM and Presence: Allows monitoring of IM&P Summary information regarding active Jabber sessions, active calendar subscriptions, SIP subscriptions, chat room counters, Jabber login failures, currently connected Jabber/XMPP clients, and IM packet flow
Each of these sections contains a differing toolset specific to the features to be managed or monitored. Each of these sections also exists across the top menu bar for the application itself. This placement allows for easy access regardless of which tool is in use.
System
Most of the activity within RTMT takes place within the System section: System Summary, Server, Performance, and Tools. The System Summary screen, shown in Figure 3-32, is always the first view presented upon login, by default.
Figure 3-32. RTMT System Summary Screen

Visible in Figure 3-32 is a graphical representation of the general health of the cluster. This includes three autorefreshing graphs depicting Virtual Memory Usage, CPU Usage, and Common Partition Usage (disk space). Below the graphs is a summary of alarms currently being experienced by the cluster and the node reporting each alarm. Severity of the alarm is also shown there.
Server
Selecting the CPU and Memory option on the left column opens a graphical representation of CUCM and CUCM IM&P nodes in the cluster. It also shows types of functions using CPU resources as well as memory utilization statistics. Figure 3-33 shows the RTMT CPU and Memory screen.
Figure 3-33. RTMT CPU and Memory Screen

Selecting the Process option on the left column opens a table view with details of all processes currently running on the selected server. This information includes the process name, process ID, percentage of the CPU used by each process, the process status, and other information relevant to each process. Figure 3-34 shows the RTMT Process screen.
Figure 3-34. RTMT Process Screen

Selecting the Disk Usage option on the left column opens a graphical representation of the disk usage in the common partition, swap partition, and spare partition for each CUCM node as well as each CUCM IM&P node. The statistics for each server are shown in a different color on the line graph. Disk Usage details are available by the server at the bottom of the page. To see them, simply select the server name or IP address in the drop-down field. Figure 3-35 shows the RTMT Disk Usage screen.
Figure 3-35. RTMT Disk Usage Screen

Selecting the Critical Services option on the left column opens a new screen requiring server selection. When the server is selected, a list of services on the selected node is shown, along with the status of each. The status is indicated by a status-specific icon:
• An arrow in a circular shape indicates a service starting.
• A black box with a green line, reminiscent of a heart monitor in a hospital room, indicates a service that has started and is up.
• A red triangle with a black exclamation point in the middle indicates a service stopping. A red circle with a white “X” indicates a service down.
• A red octagon with a white exclamation point in the middle indicates a service stopped by the administrator.
• A white page next to a blue can resembling a hydrant indicates a service not activated.
• A clipboard with a green checkmark next to it indicates a service in unknown status.
Figure 3-36 shows the RTMT Critical Services screen.
Figure 3-36. RTMT Critical Services Screen

Performance
There are counters for virtually every object in CUCM. The Performance Monitor, known as perfmon, can log information locally on the user workstation and use this tool in RTMT to display the resulting files. You can enable troubleshooting of perfmon information to collect specific statistics needed by administrators and/or Cisco TAC. As mentioned, enabling troubleshooting logging can be exceedingly resource intensive and should be done with great care and consideration of potential for service impact.
Performance data logging is enabled, by default, in the Cisco RIS Data Collector service parameters from the CCMAdmin utility. The polling rate defaults to 15 seconds but can be set to as high as 300 seconds. You can specify the maximum number of files that can be created. This setting defaults to 50 but can be set as high as 100. You also can configure the maximum file size. It defaults to 5 but can be set as high as 500. Cisco recommends that a value of 100 MB be used as a rule deciding the balance between number of files and maximum file size per file. That is, when you multiply the maximum number of files by the maximum file size, the total size should not exceed 100 MB generally.
The Performance section holds two options: Performance and Performance Log Viewer. The Performance screen begins by allowing the selection of a specific node, whether it is CUCM or CUCM IM&P. Clicking the node drops down a large list of available selections for which to monitor performance metrics. Figure 3-37 shows an example of performance counters selected for the CUCM Publisher node.
Figure 3-37. RTMT Performance Screen

Figure 3-37 shows six panes that can be selected from among the performance counter options in the left column. In this case, the number of SIP devices by name is selected and added to the first pane. This represents the number of currently registered SIP devices. The remaining five panes have calls completed, calls in progress, video calls active, video calls completed, and LDAP accounts synchronized. Double-clicking any one of the panes will pop it out of the RTMT window into its own window for further monitoring.
The Performance Log Viewer enables you to select a log file to view. The log files are comma-separated value files collected by the system over some amount of time. Each log file is named with the IP address of the node from which the counters were collected along with the time and date of the file’s creation.
Once selected, the file is processed, and you can select the options you want to view within the file’s contents. Check the boxes next to each counter you want to be shown on the map. Figure 3-38 shows a log file with a number of options selected. Note that the figure doesn’t show nearly all the available options.
Figure 3-38. RTMT Performance Log Viewer

At any given time, you can click the Select Counters button to add or remove performance counters. Additionally, you can select a section within the graph with the mouse to zoom into it. It is worth pointing out that there is such a thing as trying to view too much information. If you want to track counters related to packets transmitted and received on the Ethernet interface, it may be prudent to do so when not trying to view other counters, such as TFTP File requests, and so on. The number of file requests may be in the thousands, but the packets transmitted/received numbers are large enough to require expression in scientific notation. Such large numbers will render the graphic representation of the lines for TFTP file requests to a flat line by comparison. In other words, the visual data will be meaningless. Getting the Performance Log Viewer to present just the relevant information you seek takes a bit of practice and patience.
Tools
RTMT supports the definition, setting, and viewing of alerts. It contains predefined and preconfigured alerts but also allows for the creation of custom alerts. The preconfigured alerts cannot be deleted, though it is possible to alter their configuration.
The Alert menu, available under Tools either in the left column or by clicking System -> Tools -> Alert in the application menu bar at the top, contains options on alert manipulation, acknowledgment, definition, and so on. Figure 3-39 shows the Alert Central screen with the Alert menu options expanded.
Figure 3-39. RTMT Alert Central Screen

The Alert Central screen is a snapshot of the current state of the overall system. It has a row of tabs across the top that correspond with the other selection options within the left column of the RTMT, System, Voice/Video, IM and Presence, as well as a Custom tab.
The System tab shows the currently configured alerts, their status, whether or not they are in safe range, alert action, last occurrence of each alert, and when the alert was cleared. Any time an alert is out of safe range, the text of the alert is changed to red and an entry logged at the bottom of the screen in the Alert History pane.
Similar event/alert information is available for each of the tabs presented at the top of the Alert Central pane. For each alert, there are actionable items, usually within the Alert menu. The Alert menu contains the following options:
• Set alert properties
• Remove alerts
• Enable alerts
• Disable alerts
• Suspend alerts (per cluster or per node)
• Clear alerts
• Clear all alerts
• Reset alerts to default configuration
• View alert details
• Configure an e-mail server to which alerts can be sent/distributed to administrative personnel
• Configure alert actions to be taken when certain alerts occur (such as emailing an administrator)
These settings are available for every alert generated by the system.
To build a custom alert against a counter, select the counter in the Performance screen. When it is visible on the perfmon counters pane in the Performance tool, right-click the counter. A menu is presented with a few available options. Click Set Alert/Properties. Follow the steps presented to enable the alert, add a description, set thresholds and alert frequency, and define an alert action. Figure 3-40 shows the Performance screen when defining an alert.
Figure 3-40. RTMT Custom Alert Definition

Figure 3-40 represents the progression of the custom alert definition. After you right-click the performance counter, the menu shown in the figure pops up. After you click Set Alert/Properties, the first configuration window appears (just right of the counter). Enable the alert using the check box and then provide a description and recommended action. Click Next to bring up the Threshold & Duration configuration (lower left). Set the trigger value, calculation method, and duration. Click Next to bring up the Frequency & Schedule window (lower center). Click the radio button corresponding to frequency of sending of alerts; then choose when the alerts will be generated. Click Next to bring up the Email Notification window. Check the box to enable e-mail; then select the trigger alert action. If one has not yet been configured, click Configure and add the action as well as associated e-mail addresses of users to receive the e-mail. Finally, click Save. The alert and its associated action are now active. However, it is necessary to define an e-mail server in the System -> Tools -> Alerts menu. Until this is done, no e-mail notifications can be sent.
The Trace & Log Central option provides a means of collecting, viewing, and compressing (.zip format) CUCM traces and other log files. This facilitates the sending of these files to Cisco TAC or attaching them to TAC cases. You can collect both SDL and SDI traces using this tool, as well as bulk administration tool (BAT) logs, system logs, and crash dump files.
As mentioned, you can view or collect log files from traces already captured. However, you also can view real-time information. To view real-time data, double-click the View Real Time Data option in the column on the left side of the Trace & Log Central pane. It will open a window requesting that you select a node to view. Choose the node and then click Next. The next set of options allows you to set the trace category (UCM, PLM, or System), service to be traced (category-specific), and the type of trace file, (for example, SDL). Fill in the selections you want and click Finish. Figure 3-41 shows the View Real Time Data screen in the Trace & Log Central interface.
Figure 3-41. RTMT Trace & Log Central View Real Time Data Screen

After you click Finish, a new window opens. Be patient because this can take some time to populate. At the bottom of the window is a check box to enable automatic scrolling. This setting will scroll the text as new events are populated into the screen’s buffer. Also at the bottom of the screen are buttons to clear and close the current window.
Other options for working with trace files within Trace & Log Central include
• Remote Browse: After trace files have been captured, you can view them on the server using this option. You also can view crash dumps here. The files viewed may also allow you to download the files to the local desktop.
• Collect Files: This option collects and downloads trace files for services, applications, and system logs on one or more nodes within the cluster, whether it is CUCM or CUCM IM&P. When these files are downloaded, a date and time range is set to narrow the scope of the information collected. Rather than defining an absolute date/time range, you can select a time frame, such as “within the last 30 minutes.”
• Query Wizard: This option allows you to specify text search strings for the logs collected as well as the relative or absolute time/date range. As with the other options, you can view and/or download files using this tool. You can save trace collection query criteria for later use. If defined as a generic query, it can be run against any node in any cluster.
• Schedule Collection: This option allows the scheduling of a regular, recurring trace collection interval. It also permits queries to be run, syslog generation, or trace file transfer to a Secure File Transfer Protocol (SFTP) server.
• Local Browse: After trace files are collected and downloaded to the local workstation, you can viewed them with a text editor that can manage UNIX variant line terminators, such as WordPad, Notepad++, TextWrangler, and others. Or, you can view these files using the viewer available within the RTMT.
• Real Time Trace: This option allows viewing of log information in real time as well as monitoring of user events. These options allow the viewing of the log files as they’re being written to disk.
• Collect Crash Dump: This option collects crash dump files for one or more nodes.
• Collect Install Logs: You can collect logs created by installation/upgrade scripts using this option.
• Audit Logs: You can collect audit logs relating to CUCM configuration changes using this option.
Remote Browse offers a wide array of options in deciding what information to view. Typically, the maze of information available is best navigated with someone who is well versed in what information is relevant for a given type of situation. Most often, this will be a member of the Cisco TAC team. After the services, nodes, and types of traces for various services are selected within the remote browse window, it processes for a moment and then informs you that the remote browse is ready. Figure 3-42 shows an example of a Remote Browse session.
Figure 3-42. RTMT Trace & Log Central Remote Browse Screen

In Figure 3-42, a CUCM SDL trace has been selected. The other options shown in the list to the right of the Trace & Log Central column are there as a result of checking boxes relevant to those nodes and services. After the service and type of log are selected—in this case, Cisco CallManager and sdl—the pane to the right populates with an appropriate file listing. Double-clicking a file will open a pop-up window that asks which viewer you want to use to see the output. After you select a viewer, a view similar to that in the figure is presented. You can search for specific strings of text, such as phone numbers, device names, or any other string of information relevant to the type of file being presented.
At the bottom of the screen, options are presented to download, delete, refresh, or refresh all files. In this way, the files can be downloaded for later viewing, deleted, or refreshed. Note that there is no way to undelete the files.
The Job Status option in the Tools section of the RTMT System tab shows scheduled trace collection event status and scheduled deletion of traces. Job types shown include Scheduled Jobs, OnDemand Jobs, RealTimeFileMon, and RealTimeFileSearch. The status of each job shows as pending, terminated, running, or canceled. You can delete jobs from this interface, but only if they are in pending or running status. Additionally, they must be jobs with a type of ScheduledTask.
The Syslog Viewer provides a description of alarms and recommended actions. Three types of logs are available for viewing in the Syslog Viewer: System Logs, Application Logs, and Security Logs. Figure 3-43 shows the information available for each entry in the Syslog Viewer.
Figure 3-43. RTMT Syslog Viewer

In Figure 3-43, the log entry shown has a date/time stamp as well as the node on which it was recorded. It also includes severity and application identification for the offending service or process. Further information includes a description of the alert as well as the recommended course of action in dealing with the alert.
The Audit Log Viewer provides a detailed listing of the changes made to the system by applications and administrators. Figure 3-44 shows a view of the Audit Log Viewer tool.
Figure 3-44. RTMT Audit Log Viewer

Figure 3-44 shows an example of the AuditApp Log. Each entry in the viewer is time/date stamped along with the user ID of whoever made the change. Also provided are severity, type of event, and resource accessed. This view also shows success or failure of the attempted change.
Voice/Video
The Voice/Video menu contains a number of options dealing specifically with voice and video calls. These six sections are available under the Voice/Video menu options in RTMT:
• Voice and Video Summary
• CallProcess
• Device
• Service
• CTI
• Report
Voice and Video Summary
The Voice and Video Summary section has only one suboption, Voice and Video Summary, which illustrates three graphs. The first graph shows Registered Phones. The second graph shows Calls in Progress. The third graph shows Active MGCP Ports and Channels. Each graph has a line charting on a per-node basis, and one for the overall cluster. Each is represented by a different color line on the graph. It refreshes by default. So, the graphs will represent a running total over time in one-minute intervals. Figure 3-45 shows the Voice and Video Summary screen.
Figure 3-45. RTMT Voice and Video Summary Screen

Call Process
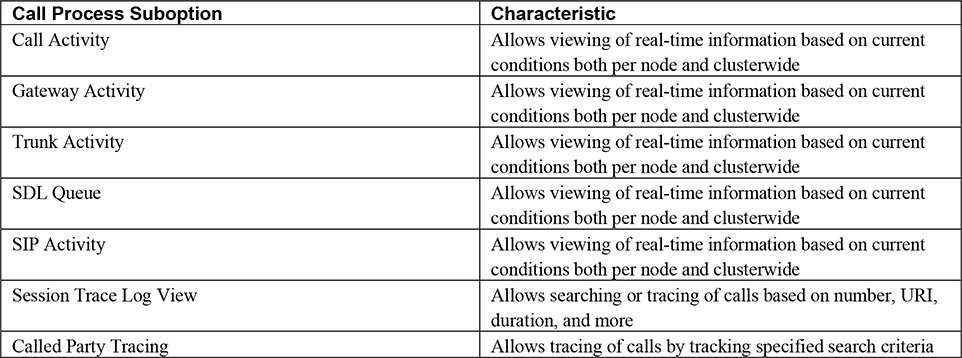
The Call Process section has seven suboptions: Call Activity, Gateway Activity, Trunk Activity, SDL Queue, SIP Activity, Session Trace Log View, and Called Party Tracing. Table 3-2 illustrates these suboptions and characteristics.
Table 3-2. Call Process Suboptions
The Call Activity screen shows four graphs: Calls Completed (Delta), Calls Attempted (Delta), Calls In Progress, and Logical Partition Failures. Figure 3-46 shows this screen.
Figure 3-46. RTMT Call Activity Screen

In Figure 3-46, you can see numerical readouts at the bottom of the screen for the current values represented by the latest information on the graph. The Calls Completed and Calls Attempted numbers are shown as a delta from interval to interval (15 seconds). Delta represents a change. In this case:
delta = <current value> – <the previous value>
As mentioned, each graph shows a different color line with values per node, and one representing the entire cluster.
The Gateway Activity screen shows activity on MGCP Gateways by port type for each CUCM node and the overall cluster. The Gateway Type drop-down menu allows you to select the following:
• MGCP FXS: MGCP-controlled foreign exchange station (FXS) ports (analog end stations such as phones and fax machines)
• MGCP FXO: MGCP-controlled foreign exchange office (FXO) ports (analog connection to PSTN provider similar to a traditional home telephone line)
• MGCP T1: MGCP-controlled channel associated signaling (CAS) T1 (24 time slots) or E1 (30 time slots) connections
• MGCP PRI: MGCP-controlled primary rate interface (PRI) T1 (23B+D) or E1 (30B+D) connections
• H323: H.323-compliant connection over an IP network
Each of these interface types can be selected for tracking in the three graphs represented in the pane below. Figure 3-47 shows the Gateway Activity screen.
Figure 3-47. RTMT Gateway Activity Screen

The three graphs shown in Figure 3-47 show numbers for active calls. For MGCP FXS and MGCP FXO, the graphs show Ports Active, Ports In Service, and Calls Completed. An alert is generated by the system if there is a Route-List Exhausted event. The MGCP T1 and MGCP PRI views show Channels Active, Spans In Service, and Calls Completed. The system generates an alert if there is either a Route-List Exhausted or a D-Channel out of service (PRI Only) event. The H323 view shows only two graphs: Calls In Progress and Calls Completed. An overall view of all port types is maintained at the bottom of the screen.
The Trunk Activity page, shown in Figure 3-48, shows Calls In Progress and Calls Completed for H.323 and SIP Trunk connections. The protocol selection is done via the Trunk Type drop-down menu at the top of the screen. Like the other options within this tool, they are tracked per node and for the overall cluster.
Figure 3-48. RTMT Trunk Activity Screen

As you can see in Figure 3-49, the SDL Queue page shows SDL activity per node and for the cluster. Two graphs are presented: one for Number of Signals In Queue and a second for Number of Processed Signals. The graphs update on 15-second intervals. There are multiple queues available for viewing in the SDL Queue screen: High Queue, Normal Queue, Low Queue, and Lowest Queue.
Figure 3-49. RTMT SDL Queue Screen

The SIP Activity screen is a graphical view of SIP requests, responses, and failures. The screen, shown in Figure 3-50, consists of six graphs and a numerical summary. The graphs shown keep track of counters per node and per cluster. They include Summary Requests, Summary Responses, Summary Failure Responses In (4xx, 5xx, 6xx SIP Responses), Summary Failure Responses Out (4xx, 5xx, 6xx SIP Responses), Retry Requests Out, Retry Responses Out. As with the other screens in the Call Process menu, these graphs update at 15-second intervals.
Figure 3-50. RTMT SIP Activity Screen

The Session Trace Log View enables you to search or trace calls based on calling-party number, called-party number, calling-party URI, called-party URI, start time, and duration. This is accomplished through the RTMT downloading the call log files, which include start time, duration, and so on, enabling you to search for matching calls and call records and create call flow diagrams.
When the screen is launched, the system collects information from available nodes. Once complete, it presents fields for calling number/URI, called number/URI, start time, duration, and time zone. Figure 3-51 shows an example of the Session Trace Log View parameter page.
Figure 3-51. RTMT Session Trace Log Parameter Page

Fill in the parameters or simply leave them at their default * and click Run. The results (all calls, if you used *) populate the pane below. Click one of the calls and then click the Trace Call button. A new window pops up with actionable links for each step in the call. Figure 3-52 shows an example of the resulting window.
Figure 3-52. RTMT Session Trace Log Output

Figure 3-52 shows an example of a call from a Cisco IP Phone with extension number 2009 (IP address 172.16.3.23) to another Cisco IP Phone with extension number 2005 (IP address 172.16.3.24). CUCM is the intermediary step between the two at IP address 172.16.100.1. Each step of the way is detailed by the SIP messaging in use for the particular function in question. Each step in the process shown by the output is a hyperlink; additional information is available with just a click. Example 3-5 shows the output associated with link (1): INVITE in the figure.
Example 3-5. SIP INVITE Trace Output
Message Details

SENDER: [SEP08CC68E86293] 172.16.3.23
GUID: [email protected]
MSG_LABEL: INVITE
RECEIVER: 172.16.100.1
MAC_ADDRESS: SEP08CC68E86293
MSGTAG: 62403
MSG_TYPE: UCM_CTRACE
CORRELATIONID: 1,100,14,22.6880^172.16.3.23^*
TIMESTAMP: 2015/12/26 19:17:08.530

Detailed Sip Message

INVITE sip:[email protected];user=phone SIP/2.0
Via: SIP/2.0/TCP 172.16.3.23:57299;branch=z9hG4bK33f92a7a
From: " Test DX650" < sip:[email protected]> ;tag=08cc68e862931ae36320b0e8-70343639
To: < sip:[email protected]>
Call-ID: [email protected]
Session-ID: 418a009200105000a00008cc68e86293;remote=00000000000000000000000000000000
Max-Forwards: 70
Date: Sun, 6 Dec 2015 01:17:03 GMT
CSeq: 101 INVITE
User-Agent: Cisco-CP-DX650/10.2.4
Contact: < sip:[email protected]:57299;transport=tcp> ;+u.sip!devicename.ccm.cisco.com=" SEP08CC68E86293" ;video;bfcp
Expires: 180
Accept: application/sdp
Allow: ACK,BYE,CANCEL,INVITE,NOTIFY,OPTIONS,REFER,REGISTER,UPDATE,SUBSCRIBE,INFO
Remote-Party-ID: " Test DX650" < sip:[email protected]> ;party=calling;id-type=subscriber;privacy=off;screen=yes
Supported: replaces,join,sdp-anat,norefersub,resource-priority,extended-refer,X-cisco-callinfo,X-cisco-serviceuri,X-cisco-escapecodes,X-cisco-service-control,X-cisco-srtp-fallback,X-cisco-monrec,X-cisco-config,X-cisco-sis-7.0.0,X-cisco-xsi-8.5.1
Allow-Events: kpml,dialog
Recv-Info: conference
Recv-Info: x-cisco-conference
Content-Length: 2585
Content-Type: application/sdp
Content-Disposition: session;handling=optional
v=0
o=Cisco-SIPUA 9280 0 IN IP4 172.16.3.23
s=SIP Call
b=AS:4064
t=0 0
m=audio 26038 RTP/AVP 108 9 124 0 8 116 18 101
c=IN IP4 172.16.3.23
b=TIAS:64000
a=trafficclass:conversational.audio.avconf.aq:admitted
a=rtpmap:108 MP4A-LATM/90000
a=fmtp:108 bitrate=64000;profile-level-id=24;object=23
a=rtpmap:9 G722/8000
a=rtpmap:124 ISAC/16000
a=rtpmap:0 PCMU/8000
a=rtpmap:8 PCMA/8000
a=rtpmap:116 iLBC/8000
a=fmtp:116 mode=20
a=rtpmap:18 G729/8000
a=fmtp:18 annexb=yes
a=rtpmap:101 telephone-event/8000
a=fmtp:101 0-15
a=sendrecv
m=video 32720 RTP/AVP 100 126 97
c=IN IP4 172.16.3.23
b=TIAS:4000000
a=trafficclass:conversational.video.avconf.aq:admitted
a=rtpmap:100 H264/90000
a=fmtp:100 profile-level-id=640016;packetization-mode=1;level-asymmetry-allowed=1;max-mbps=267300;max-fs=8910;max-fps=6000;max-rcmd-nalu-size=256000
a=imageattr:* recv [x=1024,y=600,q=0.60] [x=1280,y=720,q=0.50]
a=rtpmap:126 H264/90000
a=fmtp:126 profile-level-id=428016;packetization-mode=1;level-asymmetry-allowed=1;max-mbps=267300;max-fs=8910;max-fps=6000;max-rcmd-nalu-size=256000
a=imageattr:* recv [x=1024,y=600,q=0.60] [x=1280,y=720,q=0.50]
a=rtpmap:97 H264/90000
a=fmtp:97 profile-level-id=428016;packetization-mode=0;level-asymmetry-allowed=1;max-mbps=267300;max-fs=8910;max-fps=6000;max-rcmd-nalu-size=256000
a=imageattr:* recv [x=1024,y=600,q=0.60] [x=1280,y=720,q=0.50]
a=rtcp-fb:* nack pli
a=rtcp-fb:* ccm fir
a=rtcp-fb:* ccm tmmbr
a=content:main
a=label:11
a=sendrecv
m=video 25984 RTP/AVP 100 126 97
c=IN IP4 172.16.3.23
b=TIAS:4000000
a=trafficclass:conversational.video.avconf.aq:admitted
a=rtpmap:100 H264/90000
a=fmtp:100 profile-level-id=640016;packetization-mode=1;level-asymmetry-allowed=1;max-mbps=267300;max-fs=8910;max-fps=6000;max-rcmd-nalu-size=256000
a=imageattr:* recv [x=1024,y=600,q=0.60] [x=1280,y=720,q=0.50]
a=rtpmap:126 H264/90000
a=fmtp:126 profile-level-id=428016;packetization-mode=1;level-asymmetry-allowed=1;max-mbps=267300;max-fs=8910;max-fps=6000;max-rcmd-nalu-size=256000
a=imageattr:* recv [x=1024,y=600,q=0.60] [x=1280,y=720,q=0.50]
a=rtpmap:97 H264/90000
a=fmtp:97 profile-level-id=428016;packetization-mode=0;level-asymmetry-allowed=1;max-mbps=267300;max-fs=8910;max-fps=6000;max-rcmd-nalu-size=256000
a=imageattr:* recv [x=1024,y=600,q=0.60] [x=1280,y=720,q=0.50]
a=rtcp-fb:* nack pli
a=rtcp-fb:* ccm fir
a=rtcp-fb:* ccm tmmbr
a=content:slides
a=label:12
a=sendrecv
m=application 28088 UDP/BFCP *
c=IN IP4 172.16.3.23
a=floorctrl:s-only c-only
a=confid:1
a=floorid:3 mstrm:12
a=userid:2
a=sendrecv

Message In Log File

2015/12/26 19:17:08.530|SIPL|0|TCP|IN|172.16.100.1|5060|SEP08CC68E86293|172.16.3.23|57299|1,100,14,22.6880^172.16.3.23^*|62403|[email protected]|INVITE
2015/12/26 19:17:08.932|SIPL|0|TCP|OUT|172.16.100.1|5060|SEP08CC68E86293|172.16.3.23|57299|1,100,14,22.6880^172.16.3.23^*|62405|[email protected]|100 Trying
2015/12/26 19:17:10.465|CC|SETUP|30191589|30191590|2009|[email protected]|[email protected]
2015/12/26 19:17:11.712|SIPL|30191590|TCP|OUT|172.16.100.1|5060|SEP74A02FC0A5B5|172.16.3.24|49801|1,100,14,1.13^*^*|62406|[email protected]|INVITE
2015/12/26 19:17:11.714|CC|OFFERED|30191589|30191590|2009|2005|2005|SEP08CC68E86293|SEP74A02FC0A5B5
2015/12/26 19:17:11.785|SIPL|30191590|TCP|IN|172.16.100.1|5060|SEP74A02FC0A5B5|172.16.3.24|49801|1,100,14,34.6891^172.16.3.24^*|62407|[email protected]|100 Trying
2015/12/26 19:17:11.785|SIPL|30191590|TCP|IN|172.16.100.1|5060|SEP74A02FC0A5B5|172.16.3.24|49801|1,100,14,34.6892^172.16.3.24^*|62408|[email protected]|180 Ringing
2015/12/26 19:17:11.903|SIPL|30191589|TCP|OUT|172.16.100.1|5060|SEP08CC68E86293|172.16.3.23|57299|1,100,14,34.6892^172.16.3.24^*|62409|[email protected]|180 Ringing
2015/12/26 19:17:14.145|SIPL|30191590|TCP|IN|172.16.100.1|5060|SEP74A02FC0A5B5|172.16.3.24|49801|1,100,14,34.6893^172.16.3.24^*|62410|[email protected]|200 OK
2015/12/26 19:17:14.811|SIPL|30191590|TCP|OUT|172.16.100.1|5060|SEP74A02FC0A5B5|172.16.3.24|49801|1,100,14,34.6893^172.16.3.24^*|62415|[email protected]|ACK
2015/12/26 19:17:14.824|SIPL|30191589|TCP|OUT|172.16.100.1|5060|SEP08CC68E86293|172.16.3.23|57299|1,100,14,34.6893^172.16.3.24^*|62416|[email protected]|200 OK
2015/12/26 19:17:14.869|SIPL|30191589|TCP|IN|172.16.100.1|5060|SEP08CC68E86293|172.16.3.23|57299|1,100,14,22.6882^172.16.3.23^*|62417|[email protected]|ACK
2015/12/26 19:20:38.420|SIPL|30191590|TCP|IN|172.16.100.1|5060|SEP74A02FC0A5B5|172.16.3.24|49801|1,100,14,34.6896^172.16.3.24^*|62436|[email protected]|BYE
2015/12/26 19:20:38.548|SIPL|30191589|TCP|OUT|172.16.100.1|5060|SEP08CC68E86293|172.16.3.23|57299|1,100,14,34.6896^172.16.3.24^*|62437|[email protected]|BYE
2015/12/26 19:20:38.549|SIPL|30191590|TCP|OUT|172.16.100.1|5060|SEP74A02FC0A5B5|172.16.3.24|49801|1,100,14,34.6896^172.16.3.24^*|62438|[email protected]|200 OK
2015/12/26 19:20:38.704|SIPL|30191589|TCP|IN|172.16.100.1|5060|SEP08CC68E86293|172.16.3.23|57299|1,100,14,22.6887^172.16.3.23^*|62445|[email protected]|200 OK
2015/12/26 19:20:38.706|CC|RELEASE|30191589|30191590|16
Highlighted in the example are the sender and receiver information, SIP Message type, and the media negotiation. The lines beginning with m= are media-related messages. There are lines requesting audio, video, and content share capability via Binary Floor Control Protocol (BFCP).
The call flow shows the following events:
1. Calling-party phone signals to CUCM.
2. CUCM acknowledges the request and performs a lookup for DN 2005.
3. CUCM signals to the called-party phone.
4. Called-party phone acknowledges the request.
5. Called-party phone signals 180 ringing and begins ringing the handset.
6. CUCM sends the 180 signaling to the calling-party phone, which begins playing a ringback tone to the caller.
7. When the called-party phone answers, it sends a 200 OK to CUCM.
8. CUCM acknowledges the 200 OK.
9. CUCM sends the 200 OK to the calling-party phone, indicating that the call has been set up.
10. Calling-party phone acknowledges the 200 OK to CUCM.
11. The called-party phone hangs up, sending a BYE to CUCM.
12. CUCM sends a BYE to the calling-party phone to indicate a call disconnect.
13. CUCM sends 200 OK to the called-party phone.
14. Calling-party phone sends 200 OK to CUCM to complete normal call teardown.
The Called Party Tracing screen enables you to trace calls based on start time. The start time must be within five years from the current date. The report shows the following call information:
• Start time
• Calling directory number
• Original called directory number
• Called directory number
• Calling device name
• Called device name
When five megabytes of trace file entries have been written to the log files, the oldest information is overwritten by new trace entries as they’re recorded. The RTMT lists a maximum of 500 entries per search.
Device
The Device monitoring options enable you to view devices, both registered and unregistered. The three options for device monitoring are Device Summary, Device Search, and Phone Summary.
The Device Summary provides a graphical view (four graphs) of Registered Phone Devices, Registered Gateway Devices, Registered Media Resource Devices, and Registered Other Station Devices. Figure 3-53 shows the Device Summary page
Figure 3-53. RTMT Device Summary Page

The graphs show the devices per node and per cluster. At the bottom of the output information is a summary, by node, of the types and counts of devices registered.
The Device Search option enables you to query phones, gateways, H.323 devices, CTI devices, voice-mail devices, media resources, hunt lists, and SIP trunks. Figure 3-54 shows an example of the output from the phone search.
Figure 3-54. RTMT Phone Device Search Page
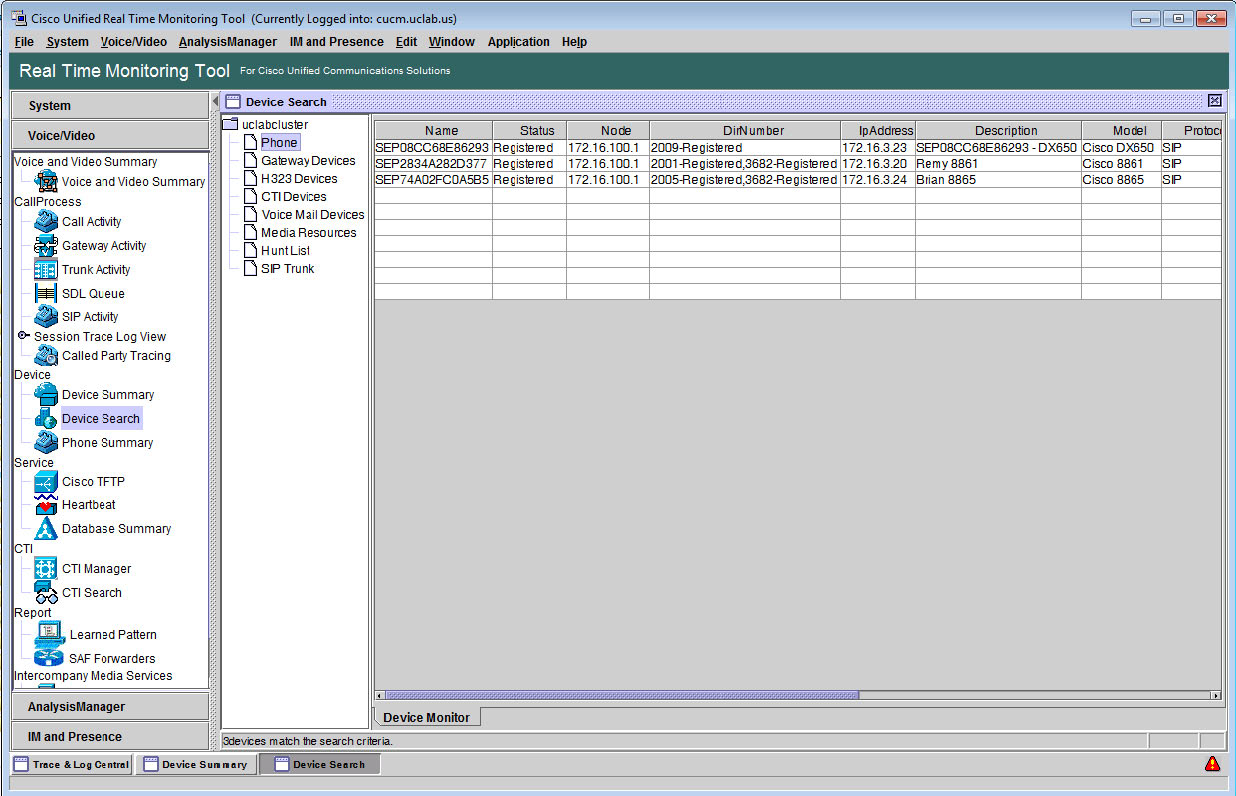
The Phone Summary page shows five graphs indicating Registered Phones, Registered SIP Phones, Registered SCCP Phones, Partially Registered Phones, and Failed Registration Attempts, as illustrated in Figure 3-55. Like other tools, this one too shows a line on the graph per node and one for the cluster overall. The bottom of the page contains a table with a per node summary of the graphical information presented in the graphs.
Figure 3-55. RTMT Phone Summary Page

Service
The Service monitoring section contains three options: Cisco TFTP, Heartbeat, and Database Summary. These options are used in monitoring activities associated with TFTP requests, database read/write/replication activity, and the heartbeat of the servers in the cluster.
The Cisco TFTP screen shows two graphs (see Figure 3-56). One is a line graph of Total TFTP Requests. The other is a graph of Total TFTP Requests Aborted. Below the graphs is a summary table showing counters for both graphs.
Figure 3-56. RTMT Cisco TFTP Page
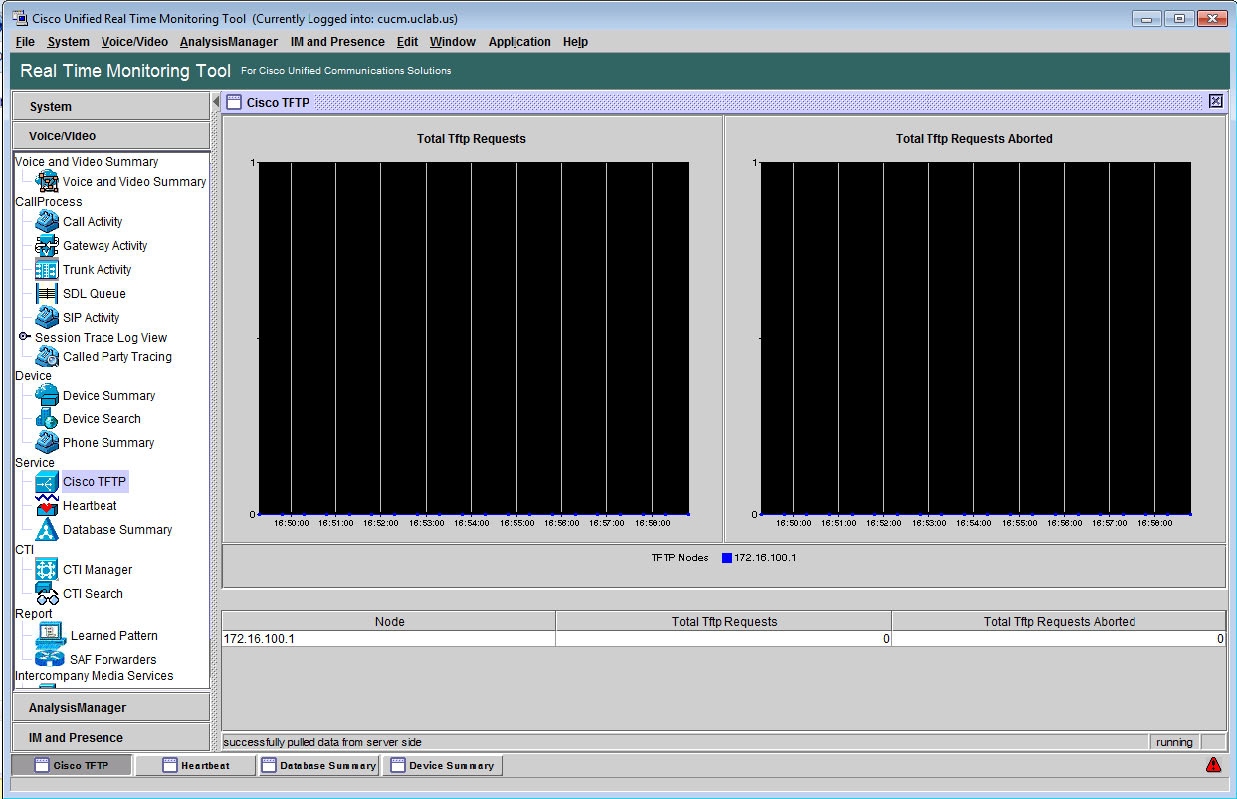
RTMT monitors the heartbeat of each CUCM node and Cisco TFTP Service. It serves as an indicator of reachability and functionality of the respective services. When the heartbeat is lost, a blinking icon occurs in the bottom-right corner of the RTMT window. The icon is actionable. Clicking it launches a window describing the event that caused its appearance. An alert e-mail can be generated and sent, if RTMT has been configured to do so. Figure 3-57 shows the RTMT Heartbeat page.
Figure 3-57. RTMT Heartbeat Page
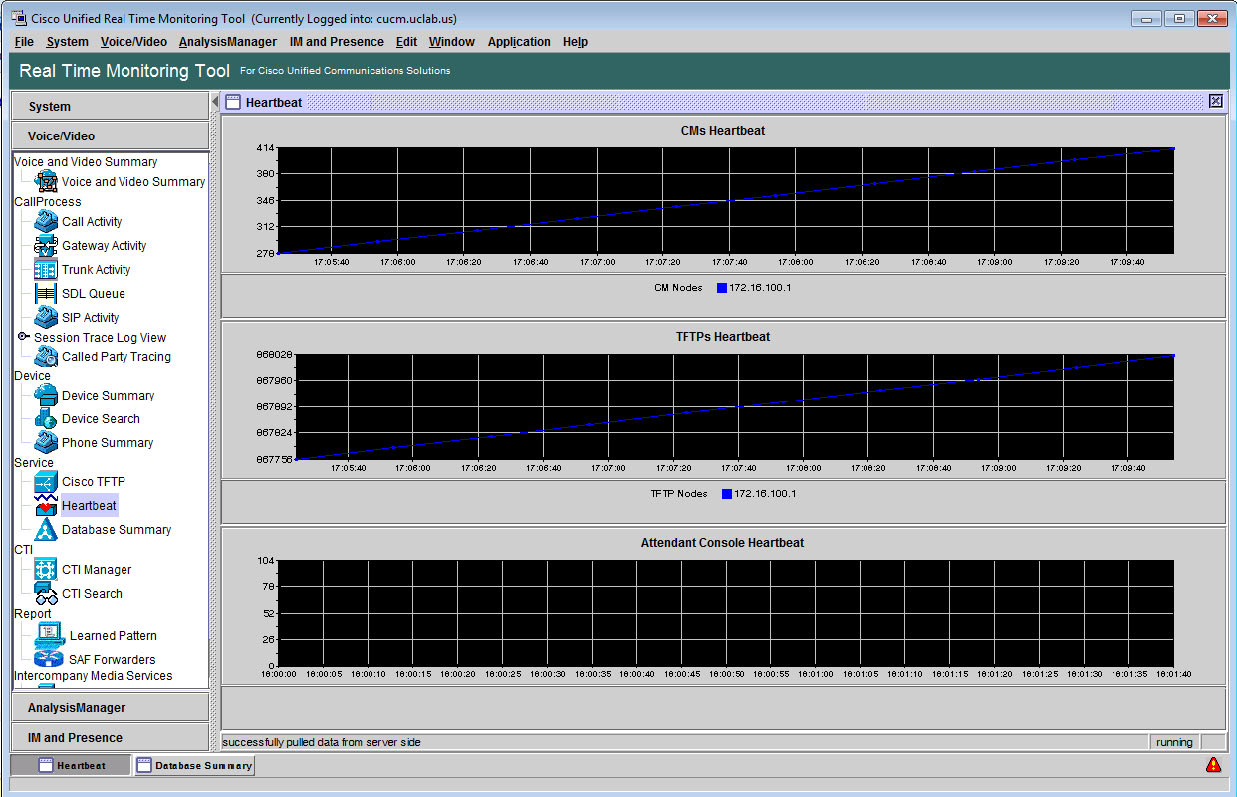
The Database Summary page shows the connection information for one or all of the nodes in the cluster. The data shown includes queued database change counts, change notification requests queued in memory, total number of client connections, number of devices queued for a device reset, database replications created, and replication status.
High numbers of queued requests for changes, notifications, and/or resets may be indicative of a pending fault or crash if excessive resources are being consumed that are keeping these changes and resets from being processed in a timely manner. Figure 3-58 shows the Database Summary page.
Figure 3-58. RTMT Database Summary Page

As with other tools mentioned in RTMT, this page has a table summary of the counts represented by the five graphs in the Database Summary page.
CTI
The CTI section in Voice/Video monitors CTI Manager activities and provides CTI search capabilities. Under the CTI section, there are two options: CTI Manager and CTI Search.
With CTI Manager, you can monitor the number of open devices, lines, and CTI connections. On the screen, you see three graphs: Number of Open Devices, Number of Open Lines, and Number of CTI Connections. Graph lines represent each CUCM node in the cluster. Below the graphs is a table summary of the counters for each CUCM node. Figure 3-59 shows the RTMT CTI Manager page.
Figure 3-59. RTMT CTI Manager Page

The CTI Search page, shown in Figure 3-60, enables you to search applications, devices, and lines associated with CTI activities. This includes CTI Ports, CTI Route Points, and so on.
Figure 3-60. RTMT CTI Search Page

Figure 3-60 shows a listing of running CTI applications. This includes the application ID, application IP address, CTI Manager address, user ID of the person associated with the application, application status, and its uptime.
Report
Under the Report section of RTMT Voice/Video, two sections are available: Learned Patterns and Service Advertising Framework (SAF) Forwarders. These functions were added to support the call control discovery functionality recently added to CUCM. When configured, the call control discovery features allow CUCM to advertise itself and its hosted directory number patterns to other remote call control entities capable of using the service advertisement framework (SAF) network.
Note
To learn more about SAF and its implementation in the Cisco collaboration network, refer to Implementing Cisco IP Telephony and Video, Part 2, by Cisco Press.
The Learned Patterns page shows the names, time stamps, and reachability status for those patterns. The reports contain additional detail, including protocol used for outgoing calls, name and IP address of the remote call control entity advertising the learned pattern, learned PSTN failover information, and the local CUCM node ID.
The SAF Forwarder page shows information that includes the authentication status and registration status of known SAF Forwarders. The SAF Forwarder report includes the name, description, IP address, port (default = 5050), type (primary or backup), connection status, authentication type, registration status, time last registered, number of registration applications, and number of connection re-attempts.
If you want to view any of the information regarding Learned Patterns or SAF Forwarders, the CCD requesting service must be activated and running.
Analysis Manager
The Analysis Manager is a tool dedicated to gathering troubleshooting information from Cisco Collaboration System applications and servers. The application traces calls using a more holistic view of the applications and servers, aside from merely call control, involved in call routing and media flow. The three sections in the Analysis Manager are Inventory, Tools, and Administration.
The Inventory section includes
• Nodes: Server nodes of supported applications in the Cisco Collaboration System.
• Node Groups: A logical grouping of nodes against which functions can be executed (such as trace collection for all members of the group).
• Call Record Repositories: Databases containing call data and detail records.
• Trace File Repositories: Storage nodes for collected trace and log files.
• Trace Templates: Template definitions for selection of services and components for which trace level changes are to be made. These are shortcuts for trace/log collection on large numbers of nodes or simply a means of quickly reconfiguring trace and log collection parameters.
Figure 3-61 shows the Analysis Manager Trace Templates page.
Figure 3-61. RTMT Analysis Manager Trace Templates Page

In Figure 3-61, a cloned template is visible. By default, only one template is defined for Call Failure. The services and traces that need to be tracked in troubleshooting such failures are predefined. They can be applied to the nodes in the node group. When nodes are added to the nodes page, a node group, All Nodes, is defined automatically. In the template, the services and trace levels are selected and applied to selected nodes in the node group.
The Analyze Call Path tool traces the call through the nodes configured in the Node Group selected. Search criteria for calling-party number/URI, called-party number/URI, duration, start time, node or node group, and so on, are selected. The call path is then traced through all the nodes in the node group.
The Collect Traces Now option allows trace collection for the node group. When this option launched, the template and node or node group can be specified, along with a date range to be collected. Figure 3-62 shows the result of a node group collection for a node group consisting of CUCM, CUCM IM&P, and Unity Connection. The collection was launched using the CallFailure template.
Figure 3-62. RTMT Collect Traces Now Page

The Schedule Trace Collection page enables you to collect traces on a regular schedule. Like the Collect Traces Now page, the Schedule Trace Collection enables you to select the node or node group, trace template, start time, end time, and trace collection interval. Figure 3-63 shows an example of a scheduled trace collection.
Figure 3-63. RTMT Schedule Trace Collection Page

In Figure 3-63, e-mail notifications were configured. The e-mail server settings must be configured in System -> Tools -> Alert -> Configure Email Server for this to work properly.
Administration
The Administration section contains three options: Import, Job Status, and Upload Files.
The Import section enables you to upload .csv files to import device and group configuration information into the Analysis Manager.
The Job Status section allows display of scheduled trace and log collection state and status. Once a node or device is added to a node group, trace and log collection may be performed regarding that device. A job may have the following states:
• Scheduled
• Running
• Completed
• Pending
• Aborted
• Canceled
The Job Status screen in Analysis Manager enables you to view job details by simply selecting the job and clicking the View Details button. The job can be aborted, cloned, or have the trace levels restored (if altered for a particular job). If jobs are added but not showing yet, there is also a Refresh button.
The Upload Files section enables you to upload collected trace files to Cisco and attach them to a specific TAC case. Notes for the files and e-mail notifications can be added to the upload also. After you specify the folder containing the collected traces, click the OK button and the job will execute. Figure 3-64 shows the Upload Files page.
Figure 3-64. RTMT Upload Files Page

IM and Presence
The IM and Presence tab provides a simplified interface to view information related to IM&P as well as Jabber clients throughout the network. There are two options: IM and Presence Summary and Cisco Jabber Summary.
The IM and Presence Summary has six graphs with a different colored line for each CUCM IM&P node in the cluster. Figure 3-65 shows the IM and Presence Summary page.
Figure 3-65. RTMT IM and Presence Summary Page

Figure 3-65 shows graphs for PE Active JSM Sessions (Presence Engine and Jabber Session Manager, respectively), Active Calendar Subscriptions, Incoming SIP Subscriptions, Outgoing SIP Subscriptions, Total Ad Hoc Chat Rooms, and Total Persistent Chat Rooms.
The Cisco Jabber Summary, in Figure 3-66, shows per IM&P node statistics on a four-graph display. The graphs include Jabber Login Failures, Current Connected Jabber/XMPP Clients, IM Packets Since Last Restart, and IM Packets in Last 60 Seconds.
Figure 3-66. RTMT Cisco Jabber Summary Page

Cisco CLI
The most common troubleshooting, installation, and upgrade tasks take place from the command-line interface. The CLI is accessible via VMware vCenter or vSphere (you can open a console from the virtual machine inventory) or Secure Shell (SSH). When you are working with commands that generate multiple pages of output, it is more advantageous to be working from an SSH client because the VMware console doesn’t allow for paging up or down to view output that has scrolled off the screen.
The CLI is used for basic maintenance procedures and for failure recovery as well as checking replication, changing network interface parameters, reviewing log file output, and performing other tasks. Also, as discussed previously, some services, such as Cisco Tomcat, can only be restarted from the CLI.
Logging in to the CLI requires platform user credentials. As with any other CLI, you can issue commands as a single word, or you can add additional parameters, whether optional or mandatory. When you are unsure of a command’s full syntax or if additional parameters are available, you can use the ? character to display available options after entering each unique piece of the command. This is known as context-sensitive help, as shown in Example 3-6.
Example 3-6. Context-Sensitive Help
admin:
admin:show version ?
      show version active
      show version inactive

admin:show version act <tab>
admin:show version active
Active Master Version: 11.0.1.20000-2
Active Version Installed Software Options:
ciscocm.free_common_space_v1.3.k3.cop
cmterm-s52010tc7_3_3.k3.cop
ciscocm.version3-keys.cop
cmterm-devicepack10.5.2.12020-1.cop
cmterm-s52030tc7_3_3.k3.cop
cmterm-devicepack11.0.1.21002-1.cop
cmterm-s52000tc7_3_3.k3.cop
cmterm-dxseries.10-2-4-46.k3.cop
cmterm-8845_65-sip.10-3-2-16.k3.cop
admin:
admin:
In Example 3-6, the highlighted text was typed but does not show in the actual output. For the first command, show version ? was entered. There is no need to press Enter or Return. The system automatically interprets the ? character as a help request and shows available options. The second command that was entered was actually just the follow-up command parameter, act, because show version was still there when the options for active and inactive were returned. Pressing the Tab key completes the command, as long as it is unique. To view other available command options, simply enter help at the command line and press Return or Enter. Example 3-7 shows the additional help available at the CLI.
Example 3-7. Additional Help Options
admin:help

Welcome to the Platform Command Line Interface (version 1.1)

Special Key Strokes

 ?             : list of available commands
 <command> ?   : syntax help for command
 <tab>         : command completion
 help <command>: help for command
 quit          : exit CLI

Additional Help

 To use question mark (?) as a parameter enclose it quotes ("")
  Example: "abc?def"

 Backslash () can be used as a line continuation character
  Note: the <tab> and ? (command completion) keys will
        not function on the second input line

 To use a parameter that contains a space enclose it in quotes ("")
  Example: "abc def"

admin:
Some other common commands used both in day-to-day and troubleshooting functions include utils commands. Example 3-8 shows available utils commands.
Example 3-8. CLI utils Commands
admin:utils
      utils auditd*
      utils capf*
      utils core*
      utils create*
      utils ctl*
      utils dbreplication*
      utils diagnose*
      utils disaster_recovery*
      utils fior*
      utils fips*
      utils firewall*
      utils ha*
      utils ils*
      utils import*
      utils iostat
      utils iothrottle*
      utils itl*
      utils ldap*
      utils netdump*
      utils network*
      utils ntp*
      utils os*
      utils process*
      utils remote_account*
      utils reset_application_ui_administrator_name
      utils reset_application_ui_administrator_password
      utils restore_application_ui_administrator_account
      utils service*
      utils set*
      utils snmp*
      utils soap*
      utils sso*
      utils system*
      utils trace*
      utils update*
      utils vmtools*
An asterisk (*) following the command indicates a requirement for additional parameters. The most commonly used commands include utils service and utils system. Some utils service commands of note are shown in Example 3-9.
Example 3-9. Commonly Used utils service Commands
admin:utils service list

Requesting service status, please wait...
System SSH [STARTED]
Cluster Manager [STARTED]
Name Service Cache [STOPPED] Service Not Activated
Entropy Monitoring Daemon [STARTED]
Cisco SCSI Watchdog [STARTED]
Service Manager [STARTED]
HTTPS Configuration Download [STARTED]
Service Manager is running
Getting list of all services
>> Return code = 0
A Cisco DB[STARTED]
A Cisco DB Replicator[STARTED]
Cisco AMC Service[STARTED]
Cisco AXL Web Service[STARTED]
Cisco Audit Event Service[STARTED]
Cisco Bulk Provisioning Service[STARTED]
Cisco CAR DB[STARTED]
Cisco CAR Scheduler[STARTED]
Cisco CAR Web Service[STARTED]
Cisco CDP[STARTED]
Cisco CDP Agent[STARTED]
Cisco CDR Agent[STARTED]
Cisco CDR Repository Manager[STARTED]
Cisco CTIManager[STARTED]
Cisco CallManager[STARTED]
Cisco CallManager Admin[STARTED]
Cisco CallManager SNMP Service[STARTED]
Cisco CallManager Serviceability[STARTED]
Cisco CallManager Serviceability RTMT[STARTED]
Cisco Certificate Change Notification[STARTED]
Cisco Certificate Expiry Monitor[STARTED]
Cisco Change Credential Application[STARTED]
Cisco DRF Local[STARTED]
Cisco DRF Master[STARTED]
Cisco Database Layer Monitor[STARTED]
Cisco Dialed Number Analyzer[STARTED]
Cisco Dialed Number Analyzer Server[STARTED]
Cisco DirSync[STARTED]
Cisco Directory Number Alias Lookup[STARTED]
Cisco Directory Number Alias Sync[STARTED]
Cisco E911[STARTED]
Cisco ELM Client Service[STARTED]
Cisco Extended Functions[STARTED]
Cisco Extension Mobility[STARTED]
Cisco Extension Mobility Application[STARTED]
Cisco IP Voice Media Streaming App[STARTED]
Cisco Intercluster Lookup Service[STARTED]
Cisco License Manager[STARTED]
Cisco Location Bandwidth Manager[STARTED]
Cisco Log Partition Monitoring Tool[STARTED]
Cisco Prime LM Admin[STARTED]
Cisco Prime LM DB[STARTED]
Cisco Prime LM Server[STARTED]
Cisco RIS Data Collector[STARTED]
Cisco RTMT Reporter Servlet[STARTED]
Cisco SOAP - CDRonDemand Service[STARTED]
Cisco SOAP - CallRecord Service[STARTED]
Cisco Serviceability Reporter[STARTED]
Cisco Syslog Agent[STARTED]
Cisco TAPS Service[STARTED]
Cisco Tftp[STARTED]
Cisco Tomcat[STARTED]
Cisco Tomcat Stats Servlet[STARTED]
Cisco Trace Collection Service[STARTED]
Cisco Trace Collection Servlet[STARTED]
Cisco Trust Verification Service[STARTED]
Cisco UXL Web Service[STARTED]
Cisco Unified Mobile Voice Access Service[STARTED]
Cisco User Data Services[STARTED]
Cisco WebDialer Web Service[STARTED]
Host Resources Agent[STARTED]
MIB2 Agent[STARTED]
Platform Administrative Web Service[STARTED]
SNMP Master Agent[STARTED]
SOAP - Diagnostic Portal Database Service[STARTED]
SOAP -Log Collection APIs[STARTED]
SOAP -Performance Monitoring APIs[STARTED]
SOAP -Real-Time Service APIs[STARTED]
Self Provisioning IVR[STARTED]
System Application Agent[STARTED]
Cisco CTL Provider[STOPPED]  Service Not Activated
Cisco Certificate Authority Proxy Function[STOPPED]  Service Not Activated
Cisco DHCP Monitor Service[STOPPED]  Service Not Activated
Cisco IP Manager Assistant[STOPPED]  Service Not Activated
Cisco Prime LM Resource API[STOPPED]  Service Not Activated
Cisco Prime LM Resource Legacy API[STOPPED]  Service Not Activated
Primary Node =true

admin:
admin:
admin:utils service restart Cisco Tomcat
Do not press Ctrl+C while the service is restarting. If the service has not restarted properly, execute the same command again.
Service Manager is running
Cisco Tomcat[STOPPING]
Cisco Tomcat[STOPPING]
Cisco Tomcat[STOPPING]
Cisco Tomcat[STOPPING]
Cisco Tomcat[STOPPING]
Cisco Tomcat[STOPPING]
Cisco Tomcat[STOPPING]
Cisco Tomcat[STOPPING]
Cisco Tomcat[STOPPING]
Cisco Tomcat[STOPPING]
Cisco Tomcat[STARTING]
Cisco Tomcat[STARTING]
Cisco Tomcat[STARTING]
Cisco Tomcat[STARTING]
Cisco Tomcat[STARTED]
admin:
Visible in the preceding example are the services on the CUCM node and the current status of each. Services can be started, stopped, or restarted from the CLI as shown. Note that the service names are case sensitive. In Example 3-9, the Tomcat service was restarted. Note that the output shows a periodic status update while the service is stopping and starting. It ends with the message that the service has started.
Other common tasks performed at the CLI are system restarts, shutdowns, and similar operations. Example 3-10 shows the available utils system commands.
Example 3-10. CLI utils system Commands
admin:
admin:utils system
      utils system boot*
      utils system restart
      utils system shutdown
      utils system switch-version
      utils system upgrade*

admin:utils system restart

Do you really want to restart ?

Enter (yes/no)? no


Restart Aborted !

admin:
Database replication status across the cluster is of key concern when any troubleshooting activity is underway. The utils dbreplication command is exceedingly useful in any operations dealing with the database replication and viewing its status. Example 3-11 shows some of the utils dbreplication command options.
Example 3-11. CLI utils dbreplication Commands
admin:utils dbreplication
      utils dbreplication clusterreset
      utils dbreplication dropadmindb
      utils dbreplication dropadmindbforce
      utils dbreplication forcedatasyncsub
      utils dbreplication quickaudit
      utils dbreplication rebuild
      utils dbreplication repair
      utils dbreplication repairreplicate
      utils dbreplication repairtable
      utils dbreplication reset
      utils dbreplication runtimestate
      utils dbreplication setprocess
      utils dbreplication setrepltimeout
      utils dbreplication status
      utils dbreplication stop

admin:utils dbreplication status

——————– utils dbreplication status ——————–
Output is in file cm/trace/dbl/sdi/ReplicationStatus.2015_12_18_18_24_51.out
Please use "file view activelog cm/trace/dbl/sdi/ReplicationStatus.2015_12_18_18_24_51.out " command to see the output
Control-C pressed

admin:file view activelog cm/trace/dbl/sdi/ReplicationStatus.2015_12_18_18_24_51.out
SERVER                 ID STATE    STATUS     QUEUE  CONNECTION CHANGED
———————————————————————–
g_ucmpub_ccm11_0_1_20000_2    2 Active   Local           0
g_ucmsub_ccm11_0_1_20000_2    3 Active   Connected       0 Dec 18 17:27:04
————————————————-
No Errors or Mismatches found.
Replication status is good on all available servers.
The output in Example 3-11 shows the status of cluster replication. Replication can be reset, restarted, stopped, and more. Obviously, these commands have a high possibility to be service impacting. If you’re not working on a lab system, exercise extreme caution when browsing command-line options.
Often, you need to utilize network tools, such as ping, traceroute, and others, to troubleshoot issues. These options are also available from the CLI. Example 3-12 shows the CLI utils network commands.
Example 3-12. CLI utils network Commands
admin:utils network
      utils network arp*
      utils network capture
      utils network capture-rotate
      utils network connectivity
      utils network host
      utils network ipv6*
      utils network name-service*
      utils network ping
      utils network traceroute

admin:utils network ping ?
Syntax:
ping dest [count VALUE] [size VALUE]
dest    mandatory   dotted IP or host name
count   optional    count value (default is 4)
size    optional    size of ping packet in bytes (default is 56)

admin:utils network ping 172.16.1.1
PING 172.16.1.1 (172.16.1.1) 56(84) bytes of data.
64 bytes from 172.16.1.1: icmp_seq=1 ttl=255 time=2.95 ms
64 bytes from 172.16.1.1: icmp_seq=2 ttl=255 time=0.951 ms
64 bytes from 172.16.1.1: icmp_seq=3 ttl=255 time=0.900 ms
64 bytes from 172.16.1.1: icmp_seq=4 ttl=255 time=2.50 ms

--- 172.16.1.1 ping statistics ---
4 packets transmitted, 4 received, 0% packet loss, time 3014ms
rtt min/avg/max/mdev = 0.900/1.826/2.954/0.916 ms


admin:
The CLI is one of the most useful tools in daily administrative tasks, status verification, troubleshooting, and other functions. You should take extreme care when utilizing CLI commands because they are operating-system-level commands. It is exceedingly beneficial to be familiar with the most useful commands and their functions.
VCS Maintenance Tools
The Cisco Video Communications Server (VCS) is fairly static from a maintenance standpoint, when configured and in an operational state. New releases of code may require new release keys to be installed. Expansions or additions to the system functionality may require option keys. However, after the base system is configured, very little will change.
The System Information page provides details on what is installed on the VCS. Many of these items are configurable. There are links associated with the configurable items that navigate the browser to the appropriate page. To get to the System Information page shown in Figure 3-67, click Status -> System -> Information.
Figure 3-67. VCS System Information Page

Many of the tools used in troubleshooting issues with VCS are under the Maintenance menu. When you are performing upgrades, logging, adding option and release keys, performing backup and restore operations, diagnostics, and security certificates, use this page. You can also place the VCS into maintenance mode here.
Often, the issues associated with VCS failures are related to firewall configuration issues. The correct port ranges, protocols, and hosts must be configured before any signaling or media passes properly through the VCS firewall traversal architecture. The ports utilized by VCS are shown in Maintenance -> Tools -> Port Usage. You can view port usage for Local Inbound Ports, Local Outbound Ports, and Remote Listening Ports. Figure 3-68 shows the VCS Inbound Ports usage page.
Figure 3-68. VCS Local Inbound Ports Page

As with other network-related aspects, connectivity verification is a key part of the troubleshooting process. Tools such as ping, traceroute, tracepath, and DNS lookup capabilities must be included in any troubleshooting effort. These tools are available under the Maintenance menu. To locate them, select Maintenance -> Tools -> Network Tools. Figure 3-69 shows the DNS Lookup page.
Figure 3-69. VCS DNS Lookup Page
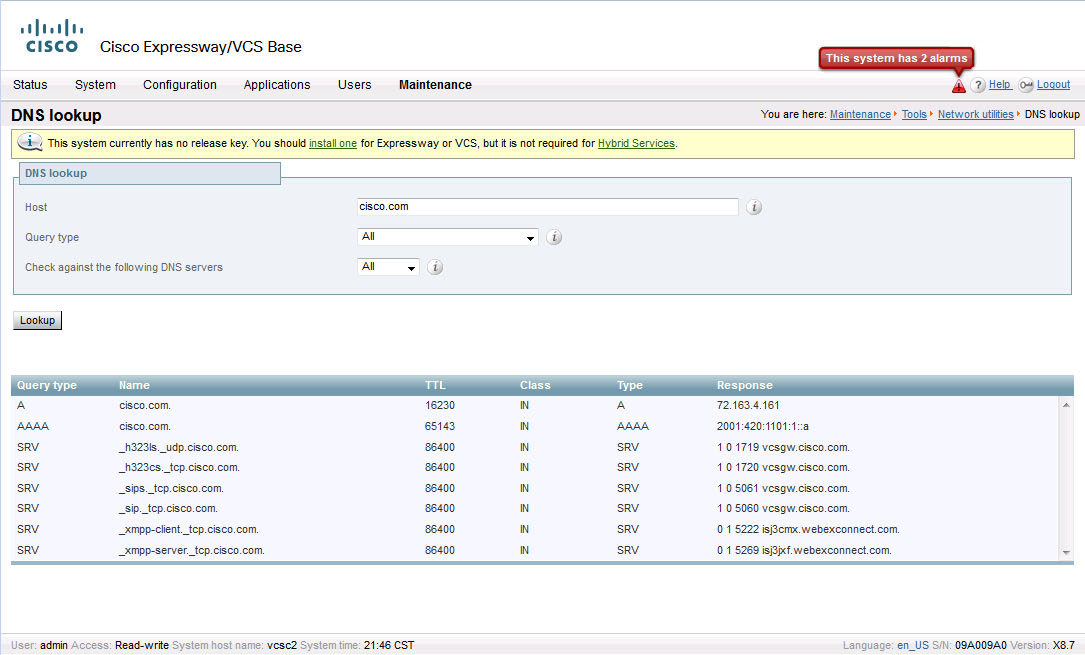
DNS is particularly important with VCS. DNS A records and Service (SRV) records are what makes it possible for VCS to function properly. Video endpoints calling into and out of the network require DNS to find the proper destination information for both registration services and called-party URIs. Ensuring DNS functionality is critical to the success of the VCS deployment.
Table 3-3 details the items available under the Maintenance menu.
Table 3-3. VCS Maintenance Menu


VCS Logs
The three logs within VCS are the Event Log, Configuration Log, and Network Log. These events can be viewed and filtered but cannot be altered or otherwise interacted with. You reach them by clicking Status -> Logs.
The Event Log shows call events, login events, and alarm events. Figure 3-70 shows an example.

The Configuration Log is exactly what the name implies. It logs time, date, user ID, and change information for VCS configuration changes and updates. Changes logged include those made via the web interface, CLI, and system changes. The CLI is accessed via console cable connection or SSH. It shows the IP address of the workstation from which the user making the changes logged in as well as what changes were made. This information is useful if the changes create instability and need to be undone. Figure 3-71 shows some of the VCS Configuration Log output.
Figure 3-71. VCS Configuration Log

The Network Logs show network traffic to and from the VCS related to SIP, H.323, HTTP/HTTPS, and more. The Network Logs also show call-routing information regarding path selection decisions made by VCS as calls are processed. These logs are useful in determining whether the correct call-routing decisions are being made during call setup.
Troubleshooting Cisco ISR Voice Gateways
The Cisco Internetwork Operating System (IOS) provides numerous means of troubleshooting issues. Most of these methods are performed using show and debug commands of various sorts, depending on the gateway configuration, technologies, and protocols in use on the gateway.
Show commands generally provide a static view of information as it existed on the router when the show command was executed. Show commands can help isolate issues, such as routing loops, interface issues, routing and routed protocol issues, and more. Many show commands are available in user mode in the Cisco IOS.
Debug commands enable error message and event collection. These are generally protocol- and process-specific monitoring functions. Debug commands can generate a great deal of output and should be used carefully. In fact, the debugging operations can impact traffic flow through a router by consuming available resources. It is best to perform debugs with significant amounts of output during nonbusiness hours to minimize service impact potential. If debugs must be collected during working hours, in a production environment, issue the no logging console and logging buffered commands. To collect the debug information, use the show log command and capture the output using the features of your terminal emulator software or simply copy/paste the output into a text file on the local workstation.
To disable all debug options currently running, use either the no debug all or undebug all command. Debug commands are available only in privileged EXEC mode in the Cisco IOS. Verify that all debugs have been turned off by using the show debug command.
When you are troubleshooting call flow issues, it is imperative that time stamps match across the network. With that in mind, it is crucial to ensure that the time synchronization with the local NTP server is current and that the time zone is correct. When comparing debug output and CUCM logs, timing of call setup, media flow, and other relevant events are most efficiently tracked by time stamp. In support of this, ensure that the timestamps debug datetime msec command has been entered in the gateway’s global configuration.
Gateway common issues and troubleshooting are discussed in more depth in Chapter 7, “Troubleshooting Common Gateway and Endpoint Registration Issues.”
Other Troubleshooting Tools
A number of additional tools are used regularly in troubleshooting voice and video calling issues. Among these are Route Plan Reports, the Cisco Unified Reporting Tool, and Packet Sniffers. There are many other possible tools, both within Cisco’s repertoire and constructed by third parties. For purposes of discussion, the focus here is on the three mentioned.
Route Plan Report
The Route Plan Report is a listing of all route patterns and URIs within CUCM. You access it through the CUCM Administrative web interface by clicking Call Routing -> Route Plan Report. To view the available route patterns and URIs, you must issue a query. Leaving the query blank and clicking Find returns all route patterns and URIs. Figure 3-72 shows an example of a Route Plan Report.
Figure 3-72. CUCM Route Plan Report

In Figure 3-72, two directory numbers are indicated by boxes. The first box, encompassing 2002, shows a typical DN and URI assigned to a phone. The second box, encompassing 2004, shows the DN and URI assigned to a phone. However, there is another entry for 2004 that has no information or route detail associated. This is known as an orphan DN. Orphan DNs tend to cause call-routing issues, at times. So, it is best to remove them. They are typically created when a device and/or DN is deleted.
The Route Plan Report also shows route patterns that have been added to the system. The details of those patterns show additional information, such as route list/route group information or hunt list/line group information as is appropriate. Figure 3-73 shows a Hunt List and Route Pattern with appropriate route detail.
Figure 3-73. CUCM Route Plan Report Continued

In Figure 3-73, the Route Detail for the Hunt List (Pattern 1100) shows the hunt list (hl-vm) as well as the hunt group and line group information. In this case, 1100 is the voice-mail pilot number. Pattern 1199 shows a route pattern that exits a gateway port. The Route Detail shows that the pattern is to be routed via the analog voice-port 0/0/0 on the BE6000S.domain.com gateway.
The Route Plan Report provides an all-encompassing view of the dial plan. It is useful as both a maintenance tool and troubleshooting tool. Duplicate route patterns within the system are fairly common issues. In many cases, the Route Plan Report is not one of the first tools to come to mind when you’re trying to track down the issue at hand.
Cisco Unified Reporting
The Cisco Unified Reporting tool is a terrific source of information regarding the cluster, devices registered, types and quantities of devices registered, cluster replication status, and more. To access the Cisco Unified Reporting tool, you use the CUCM Admin web interface. In the top-right corner of the screen, click the drop-down list and then click Cisco Unified Reporting. Figure 3-74 shows the Cisco Unified Reporting tool.
Figure 3-74. Cisco Unified Reporting Tool

The tool contains only two menu items: System Reports and Help. System Reports is the place where you access all the reports. The available reports include
• Unified CM Cluster Overview
• Unified CM Data Summary
• Unified CM Database Replication Debug
• Unified CM Database Status
• Unified CM Device Counts Summary
• Unified CM Device Distribution Summary
• Unified CM Directory URI and GDPR Duplicates
• Unified CM Extension Mobility
• Unified CM Geolocation Policy
• Unified CM Geolocation Policy with Filter
• Unified CM Lines Without Phones
• Unified CM Multi-Line Devices
• Unified CM Phone Category
• Unified CM Phone Feature List
• Unified CM Phone Locale Installers
• Unified CM Phones With Mismatched Load
• Unified CM Phones Without Lines
• Unified CM Shared Lines
• Unified CM Table Count Summary
• Unified CM User Device Count
• Unified CM Users Sharing Primary Extensions
• Unified CM VG2XX Gateway
• Unified CM Voice Mail
• Unified Confidential Access Level Matrix
Every report has two icons available within it. After the report is generated, a third icon is added. One icon looks like a sheet of paper with an arrow at the bottom-right corner, pointing up toward the top-left corner. This icon enables you to upload files to the reporting system. The second icon looks like a sheet of paper with a bar graph in the lower-right corner. This is the generate report icon. You use it to generate or regenerate reports in each of the available report screens. The third icon, which is added after the report is generated, looks like a piece of paper with a downward-pointing arrow in the bottom-right corner. This is the download report icon. Click it to download the report you’ve just generated. Figure 3-75 shows an example of the Unified CM Device Counts Summary report.
Figure 3-75. Unified CM Device Counts Summary Report

The three icons referenced previously are visible in the top-right corner of the report. The report itself consists of cluster information and a per-device-type breakdown of the devices registered to CUCM and quantity of each. It also includes the protocol in use with each type of device.
Another useful report in troubleshooting is the Unified CM Device Distribution Summary. It shows the device distribution for each CUCM node. If particular phones are having issues, this report shows device class (for example, CTI Route Point, Conference Bridge, MoH, Trunk) and quantities of devices registered to each CUCM node for primary, secondary, and tertiary call control. Figure 3-76 shows the Unified CM Device Distribution Summary.
Figure 3-76. Unified CM Device Distribution Summary Report

Spend some time with the Cisco Unified Reporting tool. Familiarize yourself with the reports and information available therein. There are reports regarding replication status and debug for the cluster, reports for phones with firmware loads that are not in compliance with the loads specified in the Device settings, and many more. This is an excellent tool for gathering information regarding the cluster and its status before, during, and after any troubleshooting operation.
Packet Sniffer
The Packet Sniffer, or Protocol Analyzer, has long been one of the de facto tools required in any network-related troubleshooting toolbox. The sniffer captures and records traffic seen on the network for later analysis. Capture files can grow to very large size in very short order, depending on the amount of traffic on the network, while the capture is running. As with the trace and log file captures, you should start the sniffer capture, follow it as quickly as possible by duplicating the problem or issue at hand, and then stop it. This limits the amount of total information that must be parsed in looking for answers.
Wireshark is just one example of the many protocol analyzers available for Mac and/or PC. The Wireshark dashboard is shown in Figure 3-77.
Figure 3-77. Wireshark Dashboard

In Figure 3-77, you can see a Start button along with interface selection and other options. Select the interface on which you wish to capture traffic and then click Start. The capture will begin. As packets are captured, they will appear in a scrolling list in the bottom pane of the software user interface. There are also options to open past captures and online guides for help and reference. Figure 3-78 shows a sampling of network traffic recorded by the capture.
Figure 3-78. Wireshark Capture

The protocol analyzer sorts various protocols by color. You can use additional filters to isolate source IP address, destination IP address, protocol, port, and so on. If you’re troubleshooting call quality between two endpoints or between an endpoint and a gateway, this is a great way to isolate the media flow. If it’s a signaling issue, you can specify the endpoint and CUCM as the source/destination. The captured packets can easily be sorted by conversation, enabling you to see all traffic between two specific hosts.
For purposes of troubleshooting collaboration-related traffic, you can narrow down the captures to encompass H.323, SIP, SCCP, MGCP, and other voice/video-related protocols.
Chapter Summary
There are many ways to troubleshoot. It is crucial to have the correct information from users who are facing issues. System, network, network design, and other sources help a lot. Analyze the issue, replicate it, and figure out where the failure (whether it is quality, dialing, one-way audio, or any other issue) is occurring. Record your observations to narrow down the root of the issue. Every piece of information from the end user(s) reporting the issue may be relevant. Did the user have an issue dialing a particular number? Where in the dialing process did it fail? Did it fail while numbers were still being dialed? Or, did it fail after the entire number was entered? That seemingly simple delineation in details greatly influences where and how troubleshooting activity is focused. If the failure occurs while the number is being dialed, it generally points to a dial-plan or user dialing issue. If the failure occurs after the entire number is dialed, it may be a class of restriction issue. Check the calling search space of the users’ phones.
Information gathering is largely performed with the tools discussed in this chapter. When things are outside your comfort zone, engage Cisco TAC. The TAC engineers will ask for traces, logs, DNA output, and more in trying to recognize and remedy the issue in a rapid fashion.
Regardless of the chosen methodology, don’t limit yourself to a single tool when there are so many available both within the collaboration system and from third parties.
References
For additional information, refer to the following:
• Cisco Unified Serviceability Administration Guide
• Dialed Number Analyzer for Cisco Unified Communications Manager
• Command Line Interface Guide for Cisco Unified Communications Solutions
• Cisco Unified Real-Time Monitoring Tool Administration Guide, Release 11.0(1)
Review Questions
Use these questions to review what you’ve learned in this chapter. The answers appear in Appendix A, “Answers to Chapter Review Questions.”
1. Which tool provides access to functions such as Service Activation, Dialed Number Analyzer, Trace Configuration, and SNMP configuration?
a. Cisco Unified Serviceability
b. Real Time Monitoring Tool
c. Cisco Unified CM Administration
d. Cisco Prime License Manager
2. When you are working with SDI and SDL traces, which tool enables you to view and collect the resulting log files?
a. Cisco Unified Serviceability
b. Real Time Monitoring Tool
c. Cisco Unified CM Administration
d. Cisco Unified CM Self Care Portal
3. Which traces contain service-level call processing information used in tracing calls and logging call state transition?
a. SDI
b. SDL
c. Log4J
d. Syslog
4. Which traces monitor run-time events and include information such as device names and IP addresses?
a. SDI
b. SDL
c. Log4J
d. Syslog
5. Which traces contain information related to Java application debugging and troubleshooting?
a. SDI
b. SDL
c. Log4J
d. Syslog
6. Which line-side call control protocol is Cisco proprietary?
a. SCCP
b. SIP
c. MGCP
d. Analog
7. Which type of message indicates an event sent from an IP phone to CUCM?
a. StationInit
b. StationD
c. StartTone
d. CallState
8. Which type of message indicates an event sent from CUCM to an IP phone?
a. StationInit
b. StationD
c. SoftKeyEvent
d. KeypadButton
9. Which tool, within Cisco Unified Serviceability, is primarily dedicated to services relating to CUCM features and functions (that is, not OS or platform related)?
a. Control Center – Feature Services
b. Control Center – Network Services
c. Service Activation
d. Dialed Number Analyzer
10. Which tool, within Cisco Unified Serviceability, is primarily dedicated to CUCM platform and underlying services?
a. Control Center – Feature Services
b. Control Center – Network Services
c. Service Activation
d. Dialed Number Analyzer
11. Which CUCM service can only be activated, deactivated, or restarted via the command-line interface?
a. Cisco Tomcat
b. Cisco CallManager
c. Cisco RIS Data Collector
d. Cisco CallManager Serviceability RTMT
12. Which tool enables you to view topology and effective path between defined locations?
a. Unified Serviceability Locations Tool
b. Unified CM Administration Locations
c. Device Pools
d. RTMT
13. The Dialed Number Analyzer enables you to show call path information from the perspective of which of the following devices?
a. Phones
b. Trunks
c. Gateways
d. All are correct
14. Which tool provides a graphical interface for monitoring overall system health, server resources, performance counters, alerts, and syslog messages and provides an easy means of collecting trace files for use in troubleshooting?
a. Unified Serviceability
b. Dialed Number Analyzer
c. RTMT
d. SNMP
15. In the CUCM CLI, which option can you add to any command to view available options and/or parameters?
a. ?
b. /help
c. help <command>
d. *
16. In viewing a CUCM CLI command listing, which character indicates that there is a requirement for additional command options or parameters?
a. ?
b. *
c. !
d. #
17. Which CUCM CLI command shows the status of individual services?
a. show services
b. show service list
c. utils service list
d. utils show service
18. Which CUCM CLI command reboots the node?
a. utils service restart
b. utils system restart
c. utils system reboot
d. utils system shutdown
19. Which CUCM CLI command enables you to issue a ping to 172.16.1.1 from a CUCM node?
a. utils system ping 172.16.1.1
b. ping 172.16.1.1
c. utils network ping 172.16.1.1
d. network ping 172.16.1.1
20. Which of the following provides a listing of all route patterns and URIs within CUCM?
a. Route Plan Report
b. Route Pattern List
c. DN Report
d. Device List