8
Release Management
QUIZ
To set the stage for this chapter, try answering each of the following statements with Agree or Disagree. Answers appear at the end of the chapter.
Statement |
Agree |
Disagree |
With Scrum, you need to release at the end of each Sprint. |
|
|
You cannot provide release dates with Scrum. |
|
|
You can release multiple times within a Sprint. |
|
|
Not allowing teams to release during important business periods (code freezes) reduces agility. |
|
|
With Scrum, Product Backlog items must be sized using relative points. |
|
|
A good release plan should include a buffer time period just before a release to stabilize the product (fix defects, regression test, document, etc.). |
|
|
Customer collaboration over contract negotiation.
—Agile Manifesto
As Product Owner, you will undoubtedly have pressure from stakeholders (executives, managers, paying customers) for schedules and budget.
This is when you need to shift your stance to one of customer collaboration and partnership over contract negotiation and vendorship.
Easier said than done, right?
Instead, consider responding with “Based on historical data, this is when we forecast we can ‘finish.’ But as you know, these initiatives are complex and things will change. We will let you know as soon as they do. We also do not know how much our team can do until we try. How about we get a Sprint or two under our belts and revisit this plan when we have actual data?”
Otherwise, you are implying certainty at the moment you and your team know the least. An inflexible plan (scope, schedule, budget) at this early stage is doomed for failure and your ‘real’ stakeholders know this. Ultimately, it is your stakeholders who have the most to lose in this situation, and taking this more realistic stance is to look out for their best interests. Remember the product over project mindset from Chapter 1.
This chapter provides you with tools to help you convey this message more effectively.
REASONS TO RELEASE
By now it should be clear that the only way to create value is to release. Testing your products against the marketplace is crucial for the agility of your organization. However, not all releases are created equal. Releasing every day may sound great, but if all you are doing is making emergency maintenance patches, then it is not so great. Figure 8-1 lists a number of reasons for making a release. Ideally, you are responding to customer requests. These types of releases are the closest thing you have to guaranteed value since the customer is saying they will pay for them. The next most important reason to release is to take advantage of a market opportunity. There is no guarantee of value, but there is a big upside if your hypothesis is correct and you are first to market.
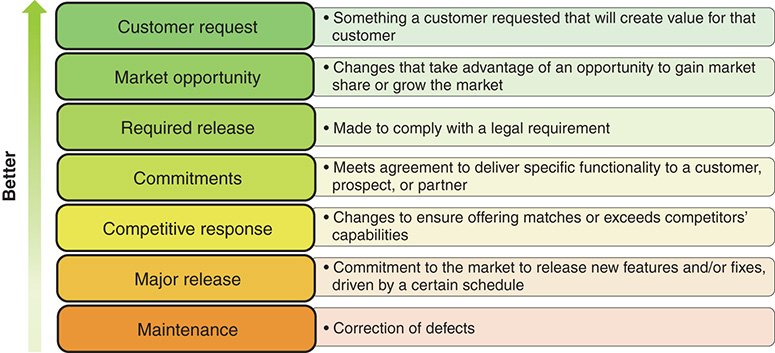
Figure 8-1 Some release reasons are better than others
The further down the list you go, the less agile you are in terms of time to market, innovation, and customer satisfaction.
Major releases are determined, often arbitrarily, by reasons that are in opposition to a product mindset. Maybe the act of releasing is long and expensive. Maybe you do not want to risk releasing during busy and crucial business operations. Maybe you are just following the terms of some contract.
Let’s look at this in more detail.
RELEASE STRATEGY
How often should you release? The answer to this is often determined by reasons seemingly out of your control (e.g., process, technology, regulations, business needs).
Table 8-1 shows how the approach determines the type of release. The subsequent sections will expand on them.
Table 8-1 Mapping Approaches to Release Types
Approach |
Commonly Used Process Term |
Release |
Validation |
Phased |
Waterfall |
Major (every 6–12 months) |
Once at the very end |
Phased with agile development |
Water-Scrum-Fall (or Hybrid) |
Major (every 6–12 months) |
Once at the very end |
Scrum without releasing the increment until set release dates |
Scrum |
Major (every 6–12 months) |
Once after the release date |
Scrum with a release at the end of a Sprint |
Scrum |
Minor (every 1–3 months) |
At Sprint boundaries |
Scrum with multiple releases within a Sprint |
Scrum |
Functional (on demand) |
As features are complete |
MAJOR RELEASES
The waterfall model is obviously conducive to major releases. However, Scrum is not immune either. Many Scrum teams can go six months or more without an actual release to production. Likely these teams are using Scrum with more of a project mindset over a product mindset.
Major releases (see Figure 8-2) are still prominent within today’s enterprises. With waterfall, a major release is the result of a long sequential phased approach. Each phase describes certain project activities like planning, analyzing, and designing. This is defined, linear thinking that may work when building simple and understood products. However, with complex products you do not know the solution, so batching up all your work and investing so much into each phase that culminates in a big release (big assumption) is tremendously risky.

Figure 8-2 Major release because of sequential phase-driven development
Some teams set up what they believe is an agile approach by grouping the more technical phases into iterations (they may even call them Sprints: e.g., Analysis Sprint, Design Sprint, Test Sprint). Usually there is a prescribed planning and approval process, and then Scrum is used to implement the preset requirements, followed by some testing before finally releasing. This is nothing more than waterfall with some Scrum practices in between—in other words, Water-Scrum-Fall (see Figure 8-3).

Figure 8-3 Water-Scrum-Fall
Using Scrum properly, you have a potentially releasable Increment each Sprint. You can minimize assumptions by showing the Increment to stakeholders in the Sprint Review. However, if you hold that increment back from a release to production until a much later date, you still have not eliminated the risk of building the wrong product.
 I am going to repeat a story from Chapter 4 as it is very relevant to this section: I worked on a year-long initiative to create a first-of-its-kind online document printing product. Five months in, we had the ability to upload a file and set some minimal printing options, without the ability to pay or add more complex finishing options (tabs, inserts, bindings, etc.). At the time, management did not want to hear about going to production early as we were not yet “finished.” Seven months later, after going to production, we realized that few customers actually used all the extra finishing options we painfully added to the product. Through a Special Instructions text area, we found out what customers really wanted: oddly sized posters and banners. Looking back, the ideal MVP would have been a simple upload with minimal printing options and an instructions text field. We could have then guided product development based on what our actual retail users were asking for – speeding up the feedback loop and generating real value more often.
What is holding teams back from releasing? This is an important question to ask. The answer should reveal some crucial strategic areas that need to be addressed.
Is it the technology? Consider investing in technology more conducive to releasing such as test automation, continuous integration, and virtualization.
Is it the internal processes? Consider streamlining these to get to “Done” more often.
Is it compliance? Consider making the governance people true stakeholders and find ways to meet compliance within each Sprint.
Is it customer absorption? Consider making it easier for your customers to consume the release. Sometimes this is a technical solution; sometimes it is through better communication and training.
Many times, it is the customers who do not want a release. Examining the reason behind this is important. If it is based out of fear because previous major releases were so painful, then you need to take the steps to make this less painful rather than just avoiding the pain. You need to work that muscle until it doesn’t hurt anymore.
Scrum does not solve your problems, it reveals them.
Consider these other reasons that may increase the cost (and pain) of a release:
![]() Additional hardware and environments needed for production
Additional hardware and environments needed for production
![]() Pilots to test the release in production before rolling it out to customers
Pilots to test the release in production before rolling it out to customers
![]() Data Migration to update production databases
Data Migration to update production databases
![]() Training for users on the latest features
Training for users on the latest features
![]() Installation that could be quite complex for some environments
Installation that could be quite complex for some environments
![]() Configuration specific to different environments
Configuration specific to different environments
Are major releases always bad? When you consider costs of a release and determine that those costs outweigh the value (negative ROI), then it may be justified.
Think about it long and hard, and do the work to justify and measure, before making the decision to use a major release strategy. If there is a way to instead reduce the cost of releasing, then that should be your focus.
 During my time at a life-science company where we developed DNA sequencers, we had two types of customers: research institutions like universities and pharmaceutical companies as well as hospitals and validated laboratories.
The former couldn’t get a fix or new feature fast enough because they were living on the edge. In contrast, the hospitals and laboratories did their DNA analysis to help people, and since people were involved the product had to be FDA compliant and validated. Any change, even the smallest one, required a full-scale revalidation. This was time consuming and expensive.
Since we could deliver on an as-needed basis, we could cater to either customer: major releases for the hospitals, and functional or minor releases for the universities.
MINOR RELEASES
Organizations that are set on major releases quickly find that they need to make smaller releases for items that cannot wait until the next major release. These can be bug fixes and patches or stand-alone functionality that augments the major release.
Minor releases are likely aligned to Sprint boundaries when using Scrum. They have a smaller absorption cost and less risk for the customer, but are still somewhat arbitrary in terms of when value is delivered.
Major and minor releases are often distinguished by their version numbers: for example, v4.1, v8.3.2.
Many Scrum Teams consider releasing at the end of each Sprint as the ultimate goal. But can they do better?
FUNCTIONAL RELEASES
How do the big dot-com companies manage to move so fast? They are not phase-driven, they are value-driven. They are not smarter, they are faster. Delivery beats strategy every time. Whenever a feature is done, meaning releasable, it is released. Once the feature is live, the team can immediately start to measure and validate their assumptions. This is validated learning at its best. Amazon makes a release every 11.6 seconds. You read that right—seconds.1 Think about it: A project is nothing more than a big bag of features to process and deliver. Why wait until some arbitrary date?
A Product Backlog is organized into independent valuable features. Once a feature is complete, why wait? Why grow your inventory? Why delay learning? You do not have to ship 7,500 times a day like Amazon, but being capable of releasing within a Sprint is a big leap forward, a graduation to the major leagues (see Figure 8-4).
A popular misconception with Scrum is that releases happen only at the end of a Sprint. However, no Scrum rule bars getting an individual Product Backlog item to “Done” and releasing it within a Sprint. Effectively, this means adding “released” to the definition of “Done.” The Sprint Review then becomes about inspecting an Increment that is already in production. Imagine the trust needed between the stakeholders, the Product Owner, and the Development Team to make that happen.
Functional releases have lower absorption costs and are often expected through explicit customer demands—the ultimate validation feedback loop—and equate to continuous delivery of value.

Figure 8-4 Continuous learning and improving through fast feedback loops
Keep in mind that any work you do before the customer actually receives the feature is considered inventory, a form of waste that needs to be maintained and managed (a cost).
Customer delight = Providing a continuous stream of additional value to customers and delivering it sooner
—Stephen Denning
Functional releases are an example of applying the three Vs (vision, value, validation) continuously.
In fact, the more often you release, the easier many of the decisions you need to make become.
When releasing every six months, logically it may make sense (at least on paper) that an organization could reserve the last month or so to decide to:
![]() have a separate group run all manual tests;
have a separate group run all manual tests;
![]() fix all outstanding bugs;
fix all outstanding bugs;
![]() write up documentation;
write up documentation;
![]() hand off to an operations team; and
hand off to an operations team; and
![]() train the users.
train the users.
Obviously these are all risky to leave to the very end. But risk aside, if that same company simply decides that it would like to deliver value to its customers more often, many of the above-mentioned decisions become harder or even impossible to stick with.
The further an organization moves from major releases toward functional releases (see Table 8-2), the more essential the following agile capabilities become:
![]() Bring testing into the Development Team
Bring testing into the Development Team
![]() Bring operations into the Development Team (DevOps)
Bring operations into the Development Team (DevOps)
![]() Automate tests
Automate tests
![]() Automate deployment
Automate deployment
![]() Create cross-functional teams
Create cross-functional teams
![]() Create self-organized teams
Create self-organized teams
![]() Engage stakeholders and users more often
Engage stakeholders and users more often
![]() Do many of the other activities referenced in this book
Do many of the other activities referenced in this book
Table 8-2 Comparison of Different Release Strategies
Major |
Minor |
Functional |
|
|
|
|
|
|
|
|
|
|
|
|
|
|
|
→ The closer you get to functional releases, the more agile capabilities are needed. |
||
Increasing the release cadence even further to at least once per Sprint sets the stage for a more agile business, a business that runs experiments based on high-quality, self-testing code. The feedback loop of the three Vs tightens.
Notice that this approach also makes release planning easier. Customers tend not to ask for dates as often when you are constantly providing them valuable features. Budgets also become easier to acquire when customers are seeing a continuous return on their investments. We will cover more about budgeting later in this chapter.
ESTIMATION AND VELOCITY
If you were asked “How long does it take you to get from Zürich to Hamburg where the distance is 867 km (539 miles)?” your first question would likely be “What means of transportation can I use?” Good question. If the answer is a Porsche 911, your reply would be different than if you only had a bicycle. The distance remains exactly the same, but your velocity will vary.
Velocity represents your capability to make progress. This velocity is the determining factor for how long something will take. The Development Team’s velocity will always vary: people fall ill, solutions change, conflict happens, hardware fails. This is the complex world you live in. If you had to make a forecast based on a Development Team’s velocity, which would you choose? The velocity from a stable team, which has been working together for six months or more, or a newly formed group of people? The answer should be obvious: the stable team. A team that has been working together with minimal distractions will have a more consistent velocity and therefore predictability. This is the reason the on-product index introduced in Chapter 3 is so important for you as a Product Owner.
Which vacuum cleaner salesperson can give you a more reliable estimate on how many vacuums he will sell next month? The guy who has been doing the job consistently for ten years? Or that other guy who just transferred in from another region and sells vacuums cleaners part time? The senior guy will have a much easier time predicting next month’s sales. He has empirical evidence that will allow him to make predictions well beyond the month. If he averages 20 vacuum sales a month, he can tell, with a fair amount of certainty, how many vacuums he will sell for the year.
20 vacuums per month (velocity) × 12 months = 240 vacuums (total sales)
What if you took the same approach?
Your stable Development Team has a history of producing eight Product Backlog items per two-week Sprint (velocity). The customer wants to know how much she will get for the release six months from now.
8 PBIs per Sprint (velocity) × 12 Sprints = 96 items off the Product Backlog
Conversely, if the customer wants to know how long it will take to get 50 items done, you can switch up the simple formula this way:
50 PBIs (total) / 8 PBIs per Sprint (velocity) × 2-week Sprints = 12.5 weeks
Just that easy, right?
While it would be nice to keep all your release plans this simple, there are three caveats:
1. False sense of security: Be careful showing any type of formula. It may give stakeholders the sense that there is precision and certainty when there certainly isn’t any. Always remember that this is the complex world of product development, and anything can happen.
2. Lack of empirical data: If you hired a team yesterday and put a formula like this to use, you better not be implying any kind of certainty in the plan. In fact, there is no (honest) way to create certainty in that situation.
3. Varying sizes: What if there is a huge variance in size between the different Product Backlog items? A team may have achieved a velocity of 8 Product Backlog items in that last Sprint, but were they small items? Huge items? A combination?
All three of these concerns are ultimately about transparency. It is important to set the expectation that this formula will be run over and over as you gather more data. Things will change, and your forecast and plan should adjust accordingly. It is an ongoing calculation.
When it comes to dealing with the varying sizes of your Product Backlog items, there are more options.
You could take the time to break everything down into similar sizes, or you could weight them differently from one another.
A simple weighting mechanism is to assign t-shirt sizes (XXS, XS, S, M, L, XL, XXL) to each item. If you then equate each t-shirt size with a numerical value (points), you could use points instead of simply counting Product Backlog items. A popular number sequence in the agile community is Fibonacci (see Table 8-3).
Table 8-3 Mapping T-Shirt Sizes to Points
T-Shirt Size |
Points |
XXS |
1 |
XS |
2 |
S |
3 |
M |
5 |
L |
8 |
XL |
13 |
XXL |
21 |
Ultimately, the number sequence used is somewhat arbitrary. The Fibonacci sequence has emerged as a favorite because the difference between numbers gradually increases. This works well as the bigger the estimate, the less accurate your estimate will be.
Revisiting the formula that ignored size variance:
50 PBIs (total) / 8 PBIs per Sprint (velocity) 3 2-week Sprints 5 12.5 weeks
When you take into account the size variance of the Product Backlog items by applying points, you end up with a revised end date:
160 points (total) / 19 points per Sprint (velocity) 3 2-week Sprints 5 16.8 weeks
Obviously, if the size variance between Product Backlog items is not that large, then the act of sizing each individual item could seem wasteful. You may want to ask yourself (and your Development Team) which activity will take more time: breaking all the Product Backlog items down to roughly even sizes or going through each item and applying points.
I was working with a Development Team that had been together fairly consistently for at least six months. During a planning poker2 sizing meeting I heard one team member say to another, “I don’t know why I bring my whole deck of planning cards with me, everything is just a 3 or a 5.” Although it sounded like that team member was complaining, what he was unknowingly conveying was that the Scrum Team (including the Product Owner) had achieved consistency in how they were creating Product Backlog items. At some point, they stopped creating large Product Backlog items because they knew that they would need to break it down later anyway. It was then that I recommended doing away with point sizing altogether. Couldn’t they save some time and just make everything a 1?
Notice that using these techniques, you can create release plans (with dates) without ever needing to estimate Product Backlog items in time units like weeks, days, or hours.
Studies have shown that human beings are pretty good at comparing things. For example, they do a good job at comparing building heights. However, they are not so good when asked to estimate how tall a building is with a unit like meters or feet.
By leveraging this skill and by harnessing past experiences, you can improve accuracy. Do not forget, it is still an estimate and not a 100 percent precise science. A study done by Rally,3 where they analyzed more than 70,000 Scrum teams, found that by far the worst performing teams estimated in hours followed by the ones using no estimates at all. The best performing teams used relative point estimation. Based on that, you could conclude that doing no estimations at all is better than estimating with days or hours.
A final warning about using points for velocity: Recall from Chapter 3 that velocity is still a circumstantial representation of value and is prone to Goodhart’s law: “When a measure becomes a target, it ceases to be a good measure.”
Velocity must be considered a value-neutral metric, and the Scrum Team should be the main audience for it. They should use it to bring awareness to their release plan so that they can inspect and adapt along the way. While being transparent on overall progress is important, the point values themselves should be considered meaningless to outside stakeholders such as management and customers. Chapter 3 provides many other options for metrics that can be used as a better indication of value delivered.
MANAGING MULTIPLE TEAMS
Assume that you have multiple stable Development Teams, each with an established velocity. The sum of all the resulting Increments is what your organization is capable of delivering each Sprint. This history of delivering “Done” Increments is your main determining factor for the future. You can plan for more, you can hope for more, but the chances that the velocity will increase on its own are slim to none.
Organizations often try to get more out of their Development Teams by throwing multiple projects at them, resulting in the problem described by Johanna Rothman in Manage Your Project Portfolio.4

Figure 8-5 Low On-Product Index through multitasking or full-time equivalents (FTE)
Figure 8-5 shows that the number of active projects increases the competition for people’s time. This reduces the ability to finish projects quickly, which lowers the number of completed projects. But all the projects are planned for the whole fiscal year, and you now need to start other projects. That is usually the moment when working on multiple simultaneous projects seems to make a lot of sense. In this complex adaptive system, this is called a positive reinforcement loop. This loop feeds on itself and worsens the situation with every revolution. Eventually you are so busy and so overloaded and doing so many things in parallel that nothing can be shipped.
The all-too-common fix? Instantiate an emergency project. Often they get fancy names like “Task Force,” “Tiger Team,” or “Alpha Team.” These teams have to “just make it happen” and therefore have lots of freedom and are exempt from the normally enforced company governance. This, in turn, makes it harder to manage the company’s portfolio. However, the people placed on the task force team do not appear out of thin air. They get pulled from other ongoing projects and are likely the higher performing team members. Now you have two closed loops speeding each other up. It is a vicious cycle.
The solution here is to stop thinking about long projects and start thinking instead about shipping value through products.
Then, the $64,000 question is:
How many concurrent products in your portfolio can your development organization’s capacity support?
If that number is larger than the number of Development Teams, you are beyond your capacity (WIP limit), and everything and everyone slows down, as described above. A good practice is to work your portfolio backlog the same as you do your Product Backlog: ongoing refinement of value, size, risk (see Figure 8-6)

Figure 8-6 Products in a portfolio lead to Product Backlogs for Scrum Teams
Having an idea of the size of your portfolio backlog compared to the size of your capacity is crucial. As described earlier in the book, Development Teams cannot effectively support multiple products. So a development organization made up of ten Development Teams can support only ten or fewer products.
Having multiple teams work on a product is certainly an option for increasing velocity. However, throwing more people onto products is not always the answer. There is overhead to scale. As shown in Figure 8-7, if you are not careful, adding people can actually slow down progress (velocity).
Adding manpower to a late software project makes it later.5
—Frederick Brooks

Figure 8-7 The cost of scaling
SCALING PRODUCTS
In today’s agile community, there is a lot of buzz around scaling. But what does scaling even mean, and why do you need to do it? Are you scaling an agile adoption effort? Are you trying to increase velocity for a single product? Do you just have too many people who you need to keep busy? Let’s break it down beginning with the 2×2 in Figure 8-8.

Figure 8-8 Number of Development Teams and products
Let’s have a look at each quadrant.
ONE PRODUCT, ONE DEVELOPMENT TEAM
This is the sweet spot for Scrum: a dedicated Scrum Team focused on a single product. The rules of Scrum help the team members work out their communication and integration dependencies. They will likely have dependencies on outside people, environments, and other things outside of their immediate control, but they can usually manage them like any good self-organizing Development Team would.
Nail It Before You Scale It
When it comes to scaling, too many organizations attempt to scale Scrum to multiple Development Teams before they are even able to get just one Development Team to reliably create a “Done” Increment each Sprint. All they really end up doing is scaling their dysfunction and reducing their overall velocity (see Figure 8-7).
SEVERAL PRODUCTS, ONE DEVELOPMENT TEAM
This quadrant is not about scaling. It is about managing the Product Backlog in a way that minimizes context switching (see Figure 8-9).

Figure 8-9 Moving only the work of one product into a given Sprint
As mentioned earlier in this chapter, if you have more products than you have Development Teams, you will lose effectiveness.
You might try to cheat your way out of this situation by having one Development Team work on only one product in a given Sprint. However, even if this seems tempting and a reasonable approach, be aware that this is a suboptimal solution and will work only if the Development Team is not disturbed during the Sprint with other “important” work from another product.
I have found that the only situation in which having one Development Team work on many products makes sense is with small companies that support multiple products but have budget for only one team. One Product Owner I worked with placed all the work across the products into one Product Backlog and had to determine which products took precedence each Sprint. It certainly wasn’t as effective as having dedicated Development Teams for each product, but it was a price the company was willing to pay given its situation.
SEVERAL PRODUCTS, SEVERAL DEVELOPMENT TEAMS
Although this quadrant has many Development Teams and many products, it is not necessarily a scaling issue. One hundred dedicated Development Teams working on 100 products may have the odd dependency here and there, but they should be able to manage with pure Scrum and good engineering practices.
The real challenge here is determining which products are the most important and how much to budget for each, where budget equates to Development Teams. This is portfolio management.
Johanna Rothman describes this in Manage Your Product Portfolio: “Portfolio is an organization of projects by date and value, that the organization commits to or is planning to commit to.”6
Even though we would have preferred Johanna had used the term “product” instead of “project,” the spirit of this statement still applies.
An organization should have one product portfolio (see Figure 8-6), which represents all the products that it is committed to. Managing this backlog implies selecting, prioritizing, and killing your products.7
Essentially, the idea is to move the highest value product from the top right either into the Scaled Scrum (Nexus) quadrant or the Scrum quadrant depending on number of Development Teams dedicated to it (see Figure 8-10).

Figure 8-10 Prioritization of products into Scaled Scrum or team Scrum
ONE PRODUCT, SEVERAL DEVELOPMENT TEAMS
This is the domain of a large-scale product approach and ultimately defines scaling. Scaling is not about adopting agile or Scrum, managing your portfolio, or dealing with context switching. Scaling is about multiple Development Teams working on a single product.
When one single Development Team does not suffice, a scaling approach that still stays true to the values of Scrum may be needed.
There are many scaling frameworks (with lots of cool acronyms) available, like Large-Scale Scrum (LeSS), Disciplined Agile Delivery (DAD), Scaled Agile Framework (SAFe), Scrum@Scale, and Nexus. All have varying degrees of detail and approaches, most of which are outside the scope of this book.
Scaled Scrum Is Still Scrum
Ultimately, the core values and practices of Scrum apply at scale. Nexus, LeSS, and Scrum@Scale come closest to this as they were developed in accordance with the Scrum Guide and therefore keep an empirical mindset and self-organization at heart. Next we quickly review Nexus, the scaling framework we have the most experience using.
THE NEXUS FRAMEWORK
According to Merriam-Webster, a Nexus is:
A connection or links between groups or series. Often in the context of providing focus.8
This section on Nexus highlights a few key points that are important for Product Owners to know when dealing with scale. For more details, take a look at the Nexus Guide9 or The Nexus™ Framework for Scaling Scrum.10
In the same way Scrum is a framework for three to nine people to work more effectively together; at scale, Nexus is a similar framework for three to nine Development Teams to work more effectively together. The same challenges that people have communicating, dealing with dependencies, and integrating all apply between teams the same way they do between people on a team.
Nexus is the exoskeleton of scaled Scrum.
—Ken Schwaber
The Nexus framework (see Figure 8-11) scales up to nine Development Teams for one product with one Product Owner and one Product Backlog.
Unlike single-team Scrum, Product Backlog refinement is a mandatory event in Nexus since multiple Development Teams need to be aligned in the context of the larger product. Nexus refinement takes place on two levels:
1. As an activity across all Development Teams with the goal of increasing communication and minimizing dependencies between teams. This also allows for high-level relative sizing of the Product Backlog items. The top of the Product Backlog is then divided out between the Development Teams that will likely work on them.
2. Once a Development Team selects items from the Product Backlog, they will refine it as they would with single-team Scrum and then coordinate remaining dependencies with other Development Teams. Here they can apply their own estimates.
This provides relative estimation at two levels, possibly even with two different scales, where the higher-level describes the overall product development velocity, the velocity the Product Owner has to work and plan with. They can then append the progress from all Development Teams into one release plan for the one Product Backlog. From a stakeholder perspective, the workload separation between Development Teams (the magic behind the curtain) should be inconsequential.

Figure 8-11 The Nexus framework
The ultimate goal of the Nexus Sprint is to have one integrated working product Increment across all Development Teams. When a Nexus can successfully achieve this along with a well-maintained shared Product Backlog, it provides excellent transparency for the Product Owner and stakeholders.
REPORTING
A well-kept Product Backlog contains all the information needed for reporting.
Because of the fact that Scrum provides you with the ability to actually complete a valuable product increment each Sprint, it opens up a wide range of possibilities when it comes to reporting.
The primary measure of progress is working software.
—Agile Manifesto
FORECASTING BASICS
As long as the Product Backlog is continuously refined and you only have one Product Backlog for your product, this Product Backlog is—along with the Development Team’s velocity—all you need for reporting.

Figure 8-12 Release burn-down allowing for some forecasting
The release burn-down example in Figure 8-12 shows progress across Sprints for a large product with three Development Teams. The Product Backlog was fairly large, and as you can see, it took the Development Teams about five Sprints until they had enough learned—emergence—about the domain, technology, and how to work best as the Development Teams. Starting at Sprint 4, the size of the Product Backlog grew. This was either new functionality (Scope) or an updated estimate because of better understanding.
The thin black line is the expected burn-down trendline (based on the least squares11 regression) over all known data points (all Sprints). The thicker gray line represents the average velocity extrapolated from the last known data point (last Sprint). The dashed lines are respectively the average of three lowest and highest Sprint velocities. The spread of these lines is often referred to as the cone of uncertainty, which has its roots in hurricane trajectory predictions. The further you look into the future, the less accurate your predictions will be.
Cone of Uncertainty
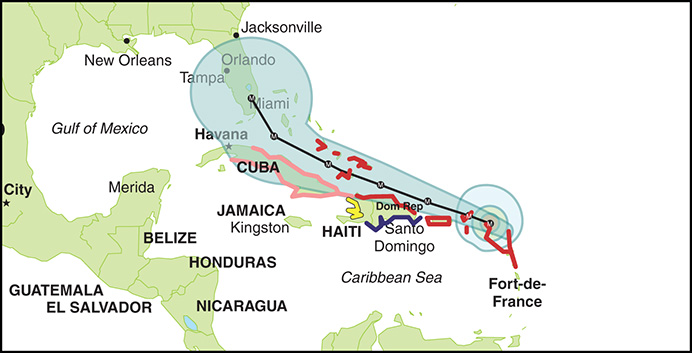
Figure 8-13 Hurricane forecasting with the cone of uncertainty
Predicting your product’s progress is a lot like predicting hurricanes (see Figure 8-13):
From weather.com
Each tropical system is given a forecast cone to help the public better understand where it’s headed.
The cone is designed to show increasing forecast uncertainty over time.
Based on previous forecast errors [over the previous five years], the entire track of the tropical cyclone can be expected to remain within the cone about 60 to 70 percent of the time. The cone becomes wider over time as the forecast uncertainty increases.12
Swap out “tropical system” with “Product Backlog” and “public” with “stakeholders” and most of the above statement translates to your world. Of course, there are no guarantees. Wild things still happen (unknown-unknowns) while predicting product development efforts, just like they do with weather systems. Hurricanes escape the cone 30 to 40 percent of the time. You never know for sure what path a hurricane will take until the storm happens. However, as you collect empirical data from where the hurricane has been, you develop a narrower landing area. In the same way, using Scrum properly, you can collect data about what has actually been “Done” to narrow the landing area of where you will end up.
Use the cone of uncertainty as a way to remind stakeholders of uncertainty, not to imply certainty.
The project management world often cites a “cone of uncertainty” that implies the more you analyze, the more precise your predictions will be. Introduced in this context by Barry Boehm13 and later picked up by Steve McConnell,14 this idea has largely been debunked.15 We use the hurricane “cone of uncertainty” with customers all the time and find it a great tool for showing what has been “Done,” communicating the uncertainty of the future, and moving away from more traditional status reports, such as Red-Amber-Green (RAG) traffic light reports.
This is also a good time to remind you that this forecasting, while useful, is only circumstantial evidence of any value delivered. Think of it instead as miles traveled (progress). It does not indicate whether you are traveling in the right direction (or even in circles). For more direct evidence of value, stick with the measurements described in Chapter 3.
Forecasting
As shown in Figure 8-14, the end of Sprint 13 is the scheduled release date. Since this release burn-down chart was created after Sprint 8, the team has five more Sprints to complete the Product Backlog. How likely is this, and what options are available?
![]() Change the release date → What are the implications of moving the date? Can we set expectations now about this possibility? Can we put a contingency plan in place?
Change the release date → What are the implications of moving the date? Can we set expectations now about this possibility? Can we put a contingency plan in place?
![]() Increase velocity to complete all scope → Can we add people to the Development Team? Is it too late for that to make a difference? Can we move other distractions off the Development Team’s plate? Can we improve tooling and infrastructure? Can we bring in another Development Team to help?
Increase velocity to complete all scope → Can we add people to the Development Team? Is it too late for that to make a difference? Can we move other distractions off the Development Team’s plate? Can we improve tooling and infrastructure? Can we bring in another Development Team to help?
![]() Work with scope → What is absolutely necessary for this release—Minimum Viable Product (MVP)?
Work with scope → What is absolutely necessary for this release—Minimum Viable Product (MVP)?
Figure 8-14 shows a situation where scope was adjusted as the date was non-negotiable.
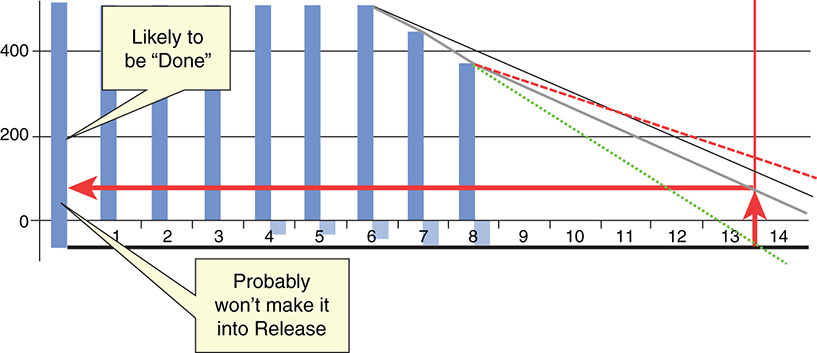
Figure 8-14 Scope projection based on burn-down chart
Inspecting the release burn-down chart, you could decide that the gray line is a reasonable forecast. Since the date is fixed at the end of Sprint 13, you can draw a vertical line from the current bottom of the scope until you touch the gray line. From this intersection, you then draw a horizontal leftward until you touch the Product Backlog. Scope above is likely to be completed (“Done”) by the release date. Scope below likely won’t.
This is good information for the Product Owner to make conscious scope decisions. For example, functionality in the “Done” part could be “simplified” to require less effort, thereby creating room for “currently won’t make it” functionality. Another option would be to descope less urgent functionality until a future release. This is hard work for the Product Owner, but like most things in life, it boils down to tradeoffs.
Overall, the value in using release plans such as these is to visualize and communicate the level of uncertainty that exists (transparency). It allows the Scrum Team as well as stakeholders to face the reality of their situation sooner rather than later (inspect) and then start making plans to adjust (adapt).
FORECASTING ACROSS MULTIPLE PRODUCTS
How can you compare Scrum Teams working on separate products?
Well, this depends on intent. If the intent is to find out which Scrum Teams are better in terms of velocity, the answer is “You can’t and you shouldn’t try.” Each Scrum Team has its own unique scale for estimating their Product Backlog, not to mention different levels of complexity and capacity. As mentioned in Chapter 3, doing this will also result in extrinsic motivation that may lead to fudging the numbers.
However, if the intent is to compare progress in a way to better distribute capacity and work, then there may be a way.
Acknowledging that each team has its own relative way of estimating, you can remove the actual numbers and instead focus on the slope of the velocity to get a progress overview. Regardless of what each individual Development Teams base unit is, the slope stays comparable.
Assume you have several connected subproducts, each with its own Scrum Team. You could create a release burn-down per subproduct and overlay them as in Figure 8-15. This makes it transparent which one has the highest risk of not being done on time and which one is on the critical path.
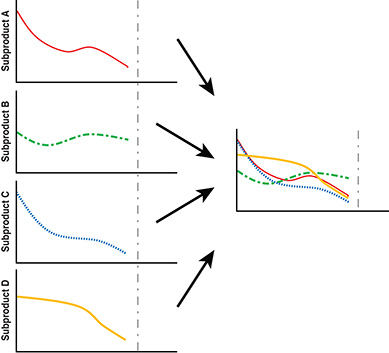
Figure 8-15 Using unitless release burn-down slopes to compare progress
With this value-neutral data, you can make decisions accordingly and actively steer development. You may decide to move people from subproduct C to subproduct B or Product Backlog items from subproduct B to subproduct C as C is doing fine right now. You might decide to hire an extra person to help with testing. The options are endless, and in the end it depends on your context. Regardless of what you decide to do, the next Sprint provides the transparency you need to inspect and adapt once more.
It is worth repeating that this information can be abused if associated with the performance of a Scrum Team. It can be valuable if treated in a transparent and neutral way with the purpose of inspection and adaptation.
PERCENTAGE OF COMPLETION
A simple-to-understand but not always simple-to-calculate metric is Percentage of Completion (PoC).
If you have to pack 120 jars of pickles, then it is reasonable to estimate that you are 50 percent complete once you pack the 60th jar.
However, when your project is made up of a series of interdependent steps, each one different from the next, then this becomes more difficult.
Imagine you have to make a large dinner, with many sequential and unique tasks, the only real way to estimate PoC is based on time spent/remaining. If you gave yourself two hours to make dinner and you are one hour into it, what is your PoC? If you have made the same dinner many times before, then you can assume you are 50 percent complete. However, if you are making the dinner for the first time and have no real confidence in your initial two-hour estimate, then that 50 percent PoC metric is misleading.
With more traditional waterfall processes, PoC is much more like the dinner example above, which only represents time spent. Figure 8-16 shows an example in which analysis is complete and design is 80 percent complete, putting the overall “project” at 37 percent completed.

Figure 8-16 Percentage of completion measured by time spent
This kind of reporting is made without even having started any development work and rarely represents accurately how much is truly complete, especially when building something unknown and complex.
When using Scrum, PoC can be a more meaningful metric. Like the jars of pickles example above, the Development Team is actually completing features each Sprint. Saying that you are 72 percent complete should have more meaning: as in, 72 percent of the features are completed and ready for production, if not already in production.
You can also do this at a more granular level with individual initiatives. Figure 8-17 shows an example in which the “Online auctions Initiative is 67 percent complete.” How do you know? Six of the nine Product Backlog items are actually “Done.”
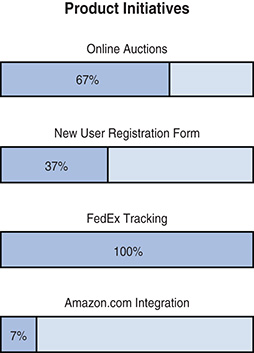
Figure 8-17 Percentage of completion by Initiatives
Consider adding metrics like these to your reports. They are more meaningful to your stakeholders, who likely think more in terms of valuable Initiatives than analysis, design, construction, and so on. A Sprint Review is an excellent opportunity to present them.
MONTE CARLO SIMULATION
Monte Carlo simulation is a risk mitigation technique for problems that require a numerical answer but are too complex to solve analytically. It instead applies random numbers and probability statistics to explore the likelihood of every possible outcome of a decision from one extreme to the other.
This technique has been used in physics, chemistry, research, business, and medicine, and even in the creation of the hydrogen bomb.
When applied to estimating Product Backlogs, Monte Carlo simulation works on the premise that each Product Backlog item has a range between an optimistic and a pessimistic estimate.
It simulates reality by assigning a random value between the optimistic and pessimistic range for a Product Backlog item. This is repeated across the whole Product Backlog, and the random Product Backlog values are added up. The resulting sum represents a point on the x-axis (see Figure 8-18). The y-axis represents the frequency of sums with the same value. This simulation is done at least 10,000 times.
The resulting plot is a distribution over time where the area is the likelihood of being done by that time.

Figure 8-18 Probability distribution based on Monte Carlo simulation
There are two points on the horizontal time axis that are of statistical interest: e50, where you have a 50 percent chance of being done; and e95, with a 95 percent percent chance of being done.
There are several online tools available to help with running simulations like these. I developed a simple Ruby script that does the job for me.
You can even run a Monte Carlo simulation with Microsoft Excel.16
How does this help you with customers demanding a date/cost prediction?
You can apply this same technique when using relative sizing of the Product Backlog items by replacing time with effort/size. With that, you acknowledge that the total effort/size is not yet known even if the scope is understood.
Figure 8-19 shows a Monte Carlo simulation with 100,000 runs over a Product Backlog with 72 Product Backlog items between 1 and 21 story points.
The distribution assumption per Product Backlog item is as follows:
![]() The likelihood of the size estimate being correct is 75 percent.
The likelihood of the size estimate being correct is 75 percent.
![]() The likelihood of it being the next higher size is 20 percent and the next lower size is 5 percent (e.g., for a 13 story point item, the range is (5%) 8, (75%) 13, or (20%) 21; for a 1 story point item, it would be 1, 1, or 2).
The likelihood of it being the next higher size is 20 percent and the next lower size is 5 percent (e.g., for a 13 story point item, the range is (5%) 8, (75%) 13, or (20%) 21; for a 1 story point item, it would be 1, 1, or 2).

Figure 8-19 Real Monte Carlo simulation for Product Backlog size
In this case, let’s say you choose an 80 percent probability of the total Product Backlog effort/size being at most 418 story points. If there are no changes to the Product Backlog, then there is still a 20 percent probability that the Product Backlog is larger.
Now you assume to have a total of 418 story points and an average velocity of 33 story points per Sprint.
Velocity has a variance as well, as shown in Figure 8-20 where the last eight Sprints reveal a variance between 29 and 37 points.

Figure 8-20 Velocity variance over time
With the Product Backlog effort distribution and the velocity average, you have a formula to calculate a possible completion date:
Time 5 (Story Pointstotal / Velocityavg) × Sprint Length
Now you can do a Monte Carlo with 100,000 simulations using random numbers between 29 and 37 story points. You subtract this velocity number from the total Product Backlog effort—418 in this case—until you are at or below zero. You count the frequency for the resulting number of Sprints. This distribution gives you a Sprint range for when the Product Backlog will be completed (see Figure 8-21): 50% probability in Sprint 14 and 95% probability in Sprint 15.
Will this work? It all comes down to your Development Team as they are doing the estimation and the work. The less stable the Development Team, the less precision, resulting in a higher variance in the estimates and velocity.

Figure 8-21 Monte Carlo simulation for number of Sprints
Do not let these statistics fool you with a false sense of precision. Every time the Product Backlog or the Development Team changes, the calculations need to be voided and redone. This becomes almost impossible with a volatile Development Team. No technique can guarantee you certainty when your team is in constant flux.
The more time a Development Team gets to collaborate, to emerge good practices, to learn from their past mistakes, the more they understand the product domain, the more reliable they will be. Rather than sponsoring a product, instead think of it as sponsoring a Development Team building the best possible product with the highest possible value within the given constraints.
Our tool will not estimate how long your project will take; all it will do is tell you how much uncertainty ought to be associated with whatever estimate you come up with.17
—Tom DeMarco and Timothy Lister
WHICH COLOR IS YOUR VELOCITY?
Assume that over the last two years, you had a stable Development Team that had a consistent velocity of 100 points. As a Product Owner, could you assert that this Development Team generated the same amount of value each Sprint over that time?
The answer should be no. Your Development Team may have done the same amount of work, but is the output the same? Did your team’s innovation rate change over time?
This can be visualized by categorizing (with colors if you aren’t stuck with black and white, as in the print version of this book) your Product Backlog items and the resulting velocity (see Figure 8-22).
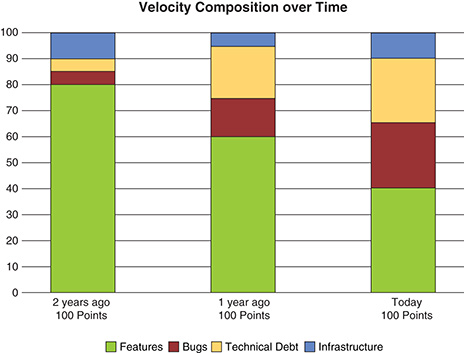
Figure 8-22 Velocity breakdown by work type
Features are good. This is what creates value by attracting new customers or keeping old ones.
Technical debt is not so good. However, the bad decisions made in the past still need to be dealt with. Addressing technical debt should help to have less rework in the future so that you can focus on more innovative features.
Infrastructure is work you have to do that fits neither into the feature nor technical debt category. It could be setting up a clustered load balanced database or upgrading environments. Again, these should help to create more value down the road.
Bugs are always bad. They are the manifestation of the inability to deliver a high-quality product. Bugs bridge the whole delivery life cycle from initial creation, refinement, implementation, testing, and releasing. A bug can be attributed to having made a mistake in any of these steps.
In the above example, the Development Team performs as well as it did two years ago. It still delivers around 100 points worth of output.
However, the value produced has decreased dramatically. It went from 80 points two years ago to only half of that, 40 points, today. Fighting technical debt and bugs went up accordingly.
Infrastructure is often higher in the beginning and decreases over time; it never vanishes completely. It is important to keep infrastructure and architecture sound.
The important take-away here is to monitor these numbers carefully, as this pattern is commonplace and can too easily be masked. The number value itself is not as important as its trend over time, which can indicate whether you are improving or getting worse. Consider the data in your given context, create transparency around them, and drive your decisions from there.
BUDGETING
At some point, an idea for a product initiative is proposed by someone. This initiative has prospective revenue generation or cost savings for the organization. Maybe a business case is created to show this potential ROI. The next step is budgeting.
In a defined phase-driven organization, the budgeting process is typically handed off to project managers and follows the following four steps:
1. Prepare the Budget
Find out what is needed, create plan for initiative, and then send to decision makers.
2. Approve the Budget
Determine whether the budget still aligns with the purported ROI of the initiative. Is it still worth doing? This can often be a political activity in which changes and cuts are expected before approval, which often bleeds into development time.
3. Execute (and Control) the Budget
Doing the work and controlling costs. This is where scope creep is managed and change requests are made to adjust the budget.
4. Evaluate the Budget
Making sure the money was spent and used correctly. This is the moment of truth when you find out whether the money was spent effectively.

Figure 8-23 Setting date, time, and budget when the least knowledge is available
The problem with this approach is that money and date are set before the actual work has started, exactly when everyone knows the least about what is being built (see Figure 8-23). No real learning and no contact with complexity has happened yet. And for a project manager, their job is to deliver the specified project on budget, on schedule, and within scope.
The initial business case likely has merit. However, the lengthy budgeting process itself can add to layers upon layers of planning and handoffs that end up masking the original product vision. Think back to the product management vacuum described in the first chapter.
Instead of putting on these shackles before getting a chance to learn, you should leverage emergence by collecting real data—empirical evidence—by building a small part of the planned product. This part of the product should address anticipated features or technical risks as you want real data to drive a go/no-go decision. The cost of this learning is relatively easy to calculate: It is the number of members of your Development Team for the length of the learning period (see Figure 8-24). Usually, just a few Sprints should allow for enough empirical data to drive an informed decision. This time (and cost) may even be less than the time needed to create a comprehensive plan and budget.
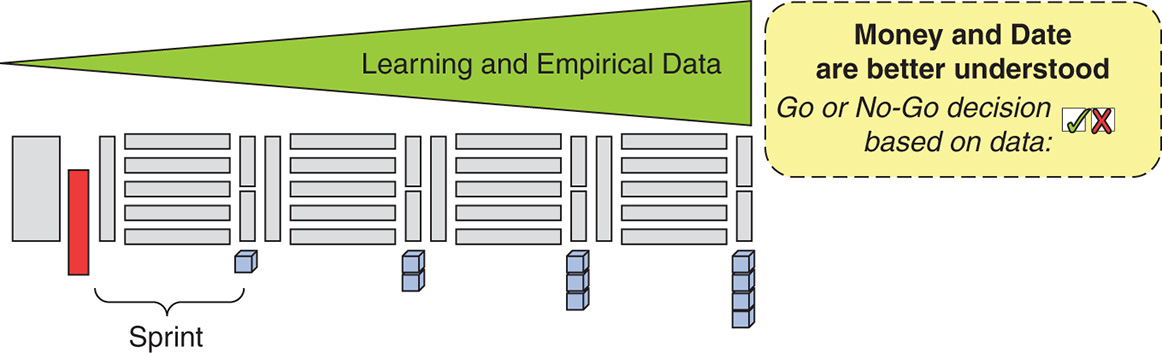
Figure 8-24 Two-phased budgeting: commitment after real knowledge is acquired
If the data shows that the risks are not manageable and the resulting uncertainty is therefore too high, this may be a good time to pull the plug. You lose some money, but you knew upfront how much it would be.
If the data shows that there is a realistic chance to build and ship the product, then go ahead and do it. It might even be a good time to speed up delivery by scaling up your Development Teams.
Be wise enough not to be reckless, but brave enough to take great risks.
—Frank Warren
Even better than building the first part of the product to gain data for making a go/no-go decision is to actually release the product before the next budgeting phase. It is much easier to make a case for a budget when you can demonstrate actual ROI. Remember the MVP we introduced in Chapter 4.
I was on a Scrum Team for an internal call center application. Those of us on the Development Team had no idea that our budget was almost up. However, a few Sprints earlier, when we were demonstrating some new functionality, one of the users convinced us to give them the functionality sooner, saying it would save him time during his daily tasks. When it was later announced that our budget was up, that user was able to show how much time (money) the team saved with the new functionality, which made acquiring new budgets much easier.
Five steps for agile budgeting (FEED-ME):
1. Fund products and their visions instead of projects
Rather than thinking in terms of project funding, think about products. Having a product costs money. A two-week Sprint that costs $50,000 translates to an annual run rate of $1.3 million. How many people and Development Teams can that fund?
2. Empower the Product Owner
Instead of assigning scope, schedule, and budget to a project manager, allow the Product Owner to become more of a sponsor with an entrepreneurial mindset for her product. Give her the fiduciary responsibility.
3. Establish transparency
In lieu of thinking and acting in a defined linear approach, establish empirical feedback loops that allow for continuous measurements. Keep asking, “Are we still on track? Are we still on the right track?”
4. Demonstrate value sooner
The more often you release, the more often your stakeholders will see a return on their investment, making them much more eager to continue or increase funding.
5. Manage stakeholder expectations
Ensure that your stakeholders are consistently informed on where the money is being spent and what they are getting in return. Remind them about the uncertainty of building complex products and that directions may need to change. Be on the lookout for new stakeholders as the work progresses.
6. Employ empirical budgeting through validation
Instead of being driven by fixed budget (and scope and schedule), recognize that budgets will need to vary to deal with the evidence gathered while validating your assumptions. Budgets may need to be reassigned, decreased, increased, or even killed. Plan to revisit the budget every time you validate and new evidence is collected.
Certainly all this is easier said than done, and moving to a more agile budgeting approach is not an overnight initiative. In the end, you need to play the cards that you are dealt. Just know that however the funding happens, an agile approach can still work.
If your organization is still demanding an upfront budget and . . .
. . . you have some say in the budgeting process:
1. Build a Product Backlog.
2. Determine a potential velocity with the Development Team.
3. Determine the number of Sprints.
4. Multiply the number of Sprints by the cost of a Sprint.
5. Realize that as you release functionality that provides a return, getting more funding will be much easier (if needed).
. . . you have no say in the budget and it is handed to you:
1. Build a Product Backlog.
2. Determine a potential velocity with the Development Team.
3. Determine how far down the Product Backlog you can get with the potential velocity.
4. Realize that as you release functionality that provides a return, getting more funding will be much easier (if needed).
. . . you are asked for a fixed budget for a fixed scope:
1. Realize that you have been asked to take on all the risk. Therefore communicate that the cost will be higher to effectively manage this risk.
2. Build a Product Backlog.
3. Determine a potential velocity with the Development Team.
4. Determine the number of Sprints.
5. Increase the cost of the Sprint by an extra member or two per Development Team for risk mitigation. Consider this a buffer to handle the overhead of scope changes.
6. Multiply the number of Sprints by the cost of a Sprint.
7. Realize that as you release functionality, customers will want changes. Accept any changes if there is capacity or if they can be swapped with equally sized items. Increase the cost for all other changes; otherwise the quality of the product will suffer.
8. Ensure that the budget includes a maintenance period following the end of the Initiative as there will always be unforeseen work after a release.
As you can see, a fixed budget and scope limits agility. Ultimately, it creates a vendor management situation where the customer is asking for a product as though he were buying it off the shelf. The difference is that the product does not yet exist and the vendor needs to account for that uncertainty.
I work for a software development company called Improving. As a vendor building products for our customers, we want to collaborate with them as much as possible to build the right product. Unfortunately, many clients ask for a fixed price for a fixed scope. We have learned the hard way that when we do not account for the risk by adding extra people, then accommodating the client with changes along the way ultimately decreases our profit and sometimes even puts us in the red. As this does not help us or the client, we like to provide them with two options: (1) time and material costs, which allows the client to increase or decrease budget as they see value along the way; or (2) a higher fixed cost, when they shift the risk to us.
Ultimately, the best thing you can do to manage all this risk is to build a working “Done” product at the end of every Sprint.
By putting yourself in a position to produce value throughout, the fundamental discussions around budgets and timelines change. The question is no longer about “Are we going to make it?” Instead it becomes “Are we getting the best ROI out of each Sprint?”
Not only will this approach make budgeting decisions easier, it will help with other important factors such as meeting stakeholder’s expectations and complying with governance and regulatory requirements.
GOVERNANCE AND COMPLIANCE
The first two values of the 2001 Agile Manifesto are:
Individuals and interactions over processes and tools
Working software over comprehensive documentation
Both of these reflect the potential waste within governance activities that are implemented with the intention of mitigating risk. Agile teams mitigate risk by creating working software; therefore compliance documents, sign-offs, and audits are often seen as redundant.
But does this mean that all governance and compliance activities are wasteful?
To better answer this, let’s take a look at some common documents in product development (Table 8-4)
Table 8-4 Comparing Common Documents in Product Development
Requirements |
User Guides |
Business Rules |
Training Materials |
Test Cases |
Legal Compliance (Sarbanes-Oxley) |
UI Mock-ups |
Support and Maintenance Guides |
Designs |
Security Compliance |
Coding Style Guides |
Legal Traceability-Matrix (FDA, FAA, etc.) |
Notice a difference between the documents on the left versus the documents on the right?
The documents on the left are consumed by the Development Team, while the documents on the right are consumed by stakeholders outside of the Scrum Team. Therefore, who should determine which documents are needed? Ideally, the Development Team should get to select the documents that help them (left), while the Product Owner should select the documents that help the stakeholders (right). Therefore, the documents on the left should find themselves either in the Sprint Backlog and/or in the Definition of “Done.” The documents on the right should find themselves in the Product Backlog or also as part of the Definition of “Done.”
This is a good way to look at governance. There is internal governance for the documents on the left and external governance for the documents on the right. External governance may be considered wasteful, but it is necessary. You treat it like you would any other stakeholder request. Internal governance, however, may be a good opportunity to reduce waste.
There are two main reasons internal governance is implemented.
The first is that there is a lack of trust with the Development Teams, so they are asked to document their work to ensure they do not get off track. In case they get off track, they are likely asked to provide even more documentation, outlining a plan to get back on track.
The second is that the organization may want consistency between teams, products, and departments to ultimately lower costs.
The first reason, lack of trust, is addressed with Scrum by creating working increments each Sprint. Therefore, the only real reason for internal governance should be to achieve consistency across the organization.
The larger the enterprise, the more governance is necessary to maintain oversight and stay in control. With waterfall, the governance checkpoints are aligned with milestones between development phases (see Figure 8-25). Until something is built, there is nothing but paperwork governance.
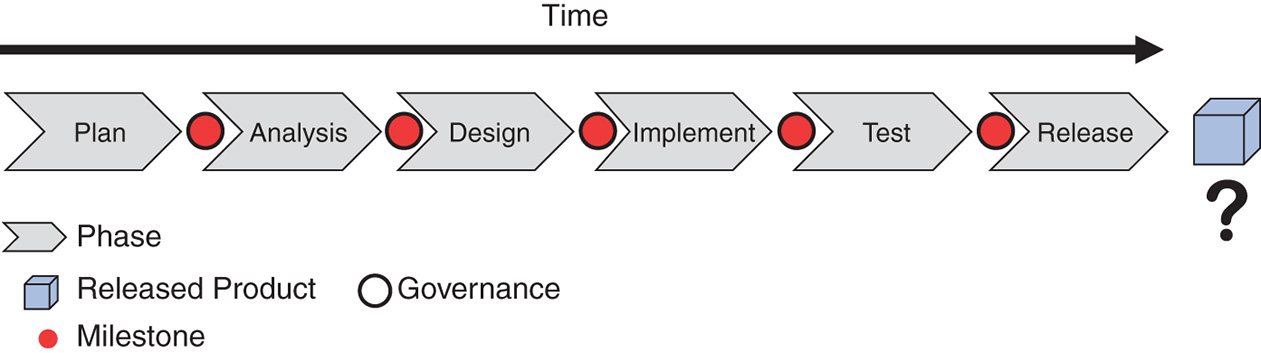
Figure 8-25 Governance at milestones
When things go wrong, governance usually grows, slowing the release down even further.
The myth is that without governance, there is chaos; the more governance there is, the more order there will be (see Figure 8-26).
Figure 8-26 Governance spectrum
Governance is at its highest right before a release since releasing presents the most risk. This presents a problem with organizations that are attempting to be more agile and releasing more often.
I was coaching several teams within e-commerce for a large retail chain. The organization typically used 6- to 12-month release cycles and had an internal governance regulation of needing 17 signatures when planning a release and again before the release. Since we had planned on releasing every 2-week Sprint, this became an obvious bottleneck. It may have been possible for a major release strategy, but we were trying to deliver value more often. Getting 17 signatures at Sprint Planning and then again after the Sprint Review was impossible. Bringing this to the attention of the governance group and management stakeholders resulted in changes to their practices.
With a clear focus on value through continuous product delivery, you have all you need to govern.
Any paperwork describing progress is futile—no customers will pay for that. They pay money only for a working product. How do you get this working product? Leave it to the people doing the work by providing a clear vision and empower them to release frequently. Don’t bury them in bureaucracy.
John Kotter describes this well:18
The old methodology simply can’t handle rapid change. Hierarchies and standard managerial processes, even when minimally bureaucratic, are inherently risk-averse and resistant to change.
[Th]e absence of bureaucratic layers, command-and-control prohibitions, and Six Sigma processes, . . . permits a level of individualism, creativity, and innovation that not even the least bureaucratic hierarchy can provide.
—John Kotter
Once you have a “Done” working product at the end of the Sprint, you have all the feedback and learning to “govern” right (see Figure 8-27).
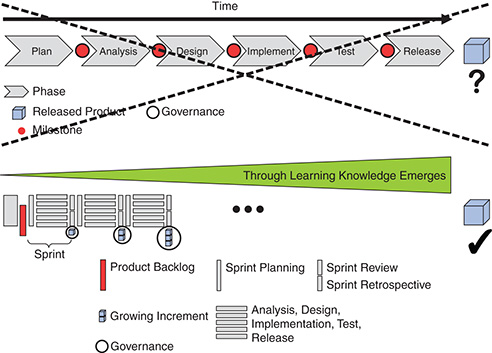
Figure 8-27 Agile governance based on working product
I am a big fan of the Toyota A3 Reports as described by Durward Sobek and Art Smalley.19 So I was wondering how you could use them for reporting when using Scrum. The result is what I call the “Agile A4 Sprint Report” as it fits nicely on a page (see Figure 8-28). The top left describes how the past Sprint went and whether there were any learnings or difficulties. Just below, we see the Development Team’s happiness index. Below that are all the risks that cannot be handled by Scrum itself. Each risk is described by its probability and impact if it materializes.
Top right is the burn-down over our Product Backlog. At the bottom right, we see the number of open bugs.
In the center is where the Development Team indicates whether the product is “Done” and can be released.
This report is updated every Sprint and made visible. That way it is easy to compare Sprint to Sprint and discover trends. This was all the governance we needed.
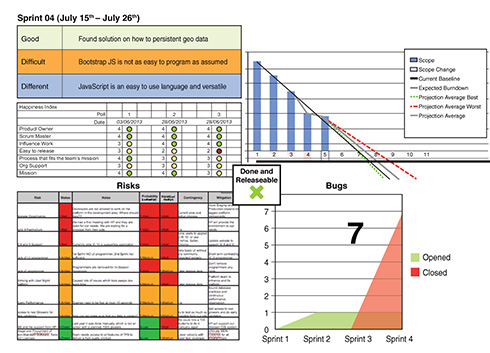
Figure 8-28 Agile A4 Sprint Report
KICKOFF
When planning a release, getting off on the right foot is important.
According to Sandy Mamoli and David Mole,20 30 percent of the success depends on how the team is launched. Even though the kickoff is not the most important ingredient, it still has the potential to ruin just about everything.
I do enjoy running for recreation and actually competed in a couple of marathons. Training is the most important aspect of what your final time will be. It is not all, though. Once you are in your starting block and ready to give your best, many things have been done in preparation. Simple things like clipping your toenails, selecting the right socks, pants, and shirt to avoid skin shavings, which could become rather painful over the 26.2 miles (42.195 km) distance. Calculating how often to drink which liquid, the target pace needed to reach your anticipated time. How much to eat of the right food the day before, to drink enough to be hydrated but not too much as you want to avoid a bathroom break. After you start, it is about finding your rhythm, your breathing, your pace. It is tempting to join the group that is starting like they are on a 100m dash. If you stick to your principles, however, I guarantee that you will pick them up about a third of the distance. Once the first 3 miles are completed, it is all about inspection and adaptation of time, pace, heart rate, and distance.
How to launch your product development initiative is sadly too often a second thought. It seems more important to get started instead of starting right. The “just start now, you will be told exactly what we need later” mantra is common. Basically, not enough developers with not the right skills will do their best chasing a nonformulated vision. This is frustrating on many levels and does not create a buy-in or commitment from the Development Team(s).
Diana Larsen and Ainsley Nies describe how they like to kick off their product development efforts in their book Liftoff.21 Figure 8-29 is a brief primer for a kickoff.
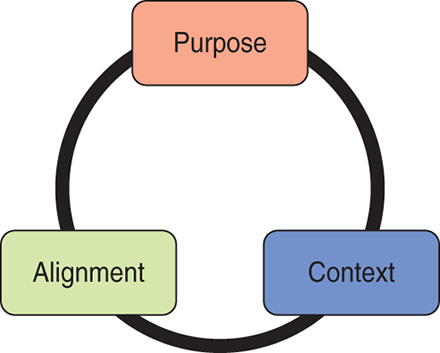
Figure 8-29 Kickoff with Purpose, Context, and Alignment
Purpose is about putting a stake in the ground, clearly formulating the vision, and deciding how you think you can get there (see Figure 8-30).
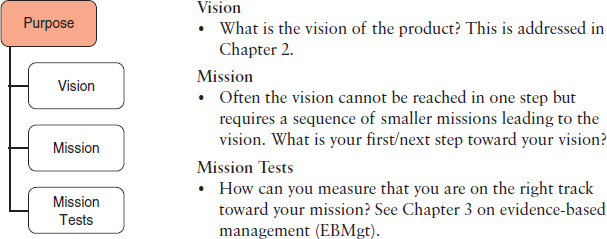
Figure 8-30 Purpose
I once worked on an agronomic product. The vision was to increase the harvest yield by 20 percent by a smarter usage of water, a scarce resource in that area. Our first mission was to have at least 100 farmers sign up and participate in the pilot as we wanted to validate our math model. The mission tests were rather simple: 100 farmers to see the benefit of using the product.
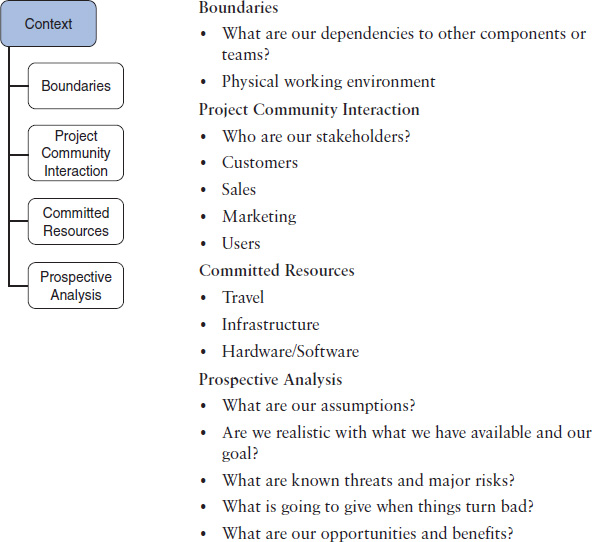
Figure 8-31 Context
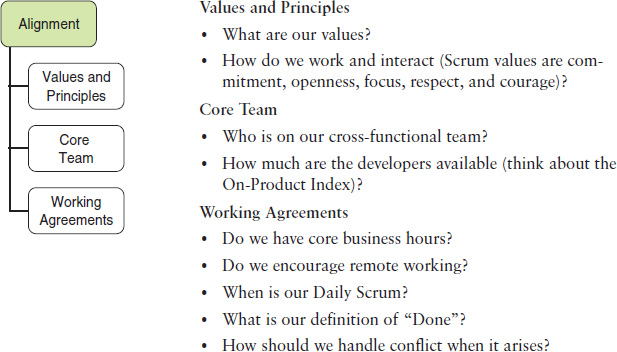
Figure 8-32 Alignment
Following the steps in Figures 8-30, 8-31, and 8-32 and working out an answer for each of the points is a kickoff done well. Yes, this is a team effort; nothing you do is in isolation. Get everybody in the same room (see Figure 8-33) and have them, through strong facilitation, work it out for themselves.
How long does this take? In general, plan for at least one day. If one day is not enough, then do some team prep work upfront and do the kickoff as the big event. Or you might even go offsite for two days and build in some team-forming activities.
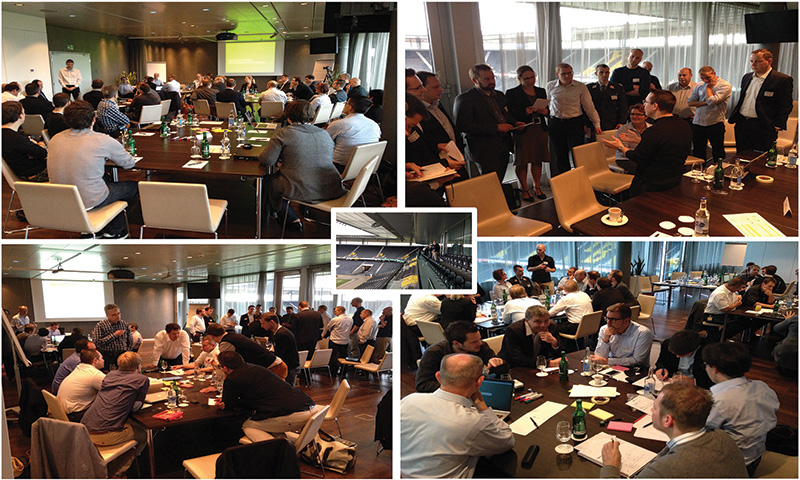
Figure 8-33 Kickoff at Swiss Postal Services in the VIP Lounge at Stade de Suisse
QUALITY
Let’s begin with a few definitions of quality.
DEFINITIONS
Everyone wants quality service or a high-quality product. What exactly is quality, though? If the product is of high quality, shouldn’t it be a success? Here are a couple of definitions:
![]() Original ISO 9000 Definition of quality: Degree to which a set of inherent characteristics fulfills requirements
Original ISO 9000 Definition of quality: Degree to which a set of inherent characteristics fulfills requirements
![]() Philip B. Crosby22 (well respected for his work on quality management): Conformance to requirements
Philip B. Crosby22 (well respected for his work on quality management): Conformance to requirements
Quality is all about doing what you specified in the beginning, probably a long time ago when you knew the least. It focuses on process conformance and not on value and end user happiness.
Johan Laurenz Eveleens and Chris Verhoef23 look at the definition of project success based on the definitions of the Standish Group:
Resolution Type 1, or project success
The project is completed on time and on budget, offering all features and functions as initially specified.
Resolution Type 2, or project challenged
The project is completed and operational but over budget and over the time estimate, and offers fewer features and functions than originally specified.
Resolution Type 3, or project impaired
The project is cancelled at some point during the development cycle.
Jørgensen and his colleagues show that the definitions do not cover all possibilities. For instance, a project that’s within budget and time but that has less functionality doesn’t fit any category (see Table 8-5, fourth row).
Table 8-5 Possible Definition of Successful Project
# |
On Time |
On Budget |
All Features |
Status |
Happy Customer |
RT1 |
Yes |
Yes |
Yes |
Success |
? |
RT2 |
Over |
Over |
Less |
Challenged |
? |
RT3 |
? |
? |
? |
Cancelled |
? (No) |
4 |
Ok |
Ok |
Less |
? |
Yes |
What if the missing functionality is of low value and not missed by the customers? Does it reduce product quality? Not necessarily, because it is known that around 50 percent of the features are hardly ever used. Consider the most important quality criteria to be a satisfied customer with an okay budget usage and an okay timeline. With “okay” it is meant that the spent money and time was right in the given context; it could mean that either more or even less was used. However, this judgment call has to come from the Product Owner based on collaboration with the stakeholders.
Also, since you are “Done” after each Sprint, it is absolutely okay to spend less money and less time as originally planned and release more frequently to collect real feedback from the market, possibly for each feature to gather real value metrics.
TYPES OF QUALITY
Types of quality include product quality and technical quality.
Product Quality
The Product Quality is all about creating the right product—the right set of features and functionality. This responsibility lies with the Product Owner and has to be addressed through the right scope, which is represented through the Product Backlog.
In a regulated environment this is called validation—doing the right thing.
Technical Quality
The technical quality resides with the Development Team. It is the Development Team’s responsibility to make sure that the developed product is always in good shape without technical debt and in a “Done” and releasable state.
In a regulated environment, this is called verification—doing it right.
Figure 8-34 summarizes quality.

Figure 8-34 Iron triangle of quality and relation to quality with the Scrum roles
In the end, it is all about doing the right thing right.
KEEPING QUALITY
The software product grows incrementally. Think about playing Legos, where you put one brick on top of another until you have what you want. This would work if you knew everything upfront, but since you operate in the complex domain, you will discover required changes to the existing Increment. The Increment grows, but existing functionality is being adapted throughout. That is the iterative part of iterative and incremental.
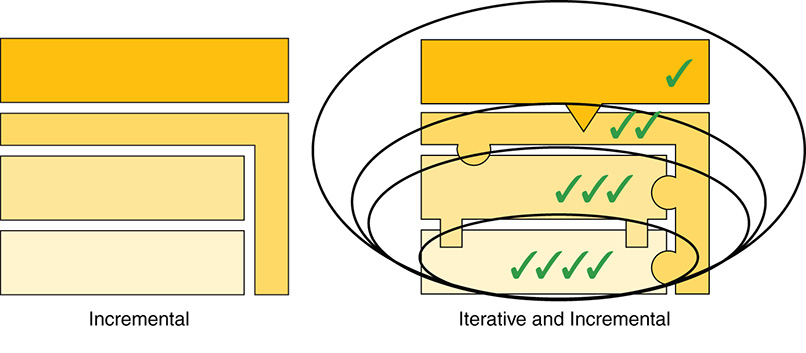
Figure 8-35 Keeping quality over time
Quality needs to be built into the product from day one; quality cannot be tested into the product at the very end. Testing after the fact is about stability and not about quality. Quality needs to be built into the product and you have to make sure that it stays (see Figure 8-35). You have to make sure that the achieved quality—product and technical—does not vanish over time (see Figure 8-36). Having it once doesn’t guarantee its presence in the future.
Therefore, there has to be a full regression test of what was added and what was there already. For that, you need test automation. Manual testing will not scale for a large number of Sprints. If your only test strategy is manual, before you know it your regression tests will take up more of your Sprint than actual development. That is when you have a big problem. You will no longer be able to guarantee a quality product as you won’t be able to get to “Done” as easily.

Figure 8-36 Maximizing and keeping value by ensuring quality
Let’s revisit the Agile Testing Quadrants (see Figure 8-37), which were introduced in the “Specification by Example” section earlier in the chapter.
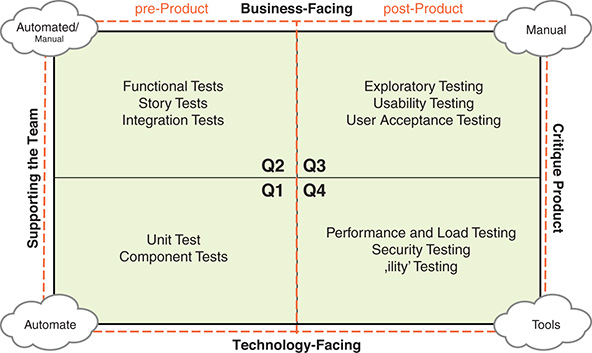
Figure 8-37 Agile Testing Quadrants with a product view
Quadrant 1
This quadrant is all about solid craftsmanship: good design, good engineering, good programming, and discipline. Quadrant 1 builds the foundation on which the product is going to be built. It is based on hundreds or thousands of automated unit tests. This is where testing frameworks like JUnit,24 which was originally developed Kent Beck, come into play. This is where individual functions and classes are tested. Those tests ensure a big part of the technical quality.
A unit test does not touch the file system, database, or any other system; it is in memory only. That is what makes unit tests so fast and allows thousands of tests to run in a short time. Simulating the environment requires that you understood the behavior of the environment. It is exactly this understanding that drives better design decisions.
Furthermore, those tests are executable documentation, exactly describing the behavior of the used systems. Even better, this kind of documentation does not ever lie. It is either green for a successful test or red when something is wrong.
Quadrant 1 is all about the How.
Quadrant 2
This quadrant was put into the forefront through agile software development as it brings together the business, engineering, and testing points of view. This quadrant is an essential part for bridging the product management vacuum by having the crucial conversations to drive out all abstractness of the requirements. The tests in this quadrant make sure that the business quality is ensured. Tests in this quadrant should be automated with the occasional exception. If test automation seems unrealistic in this quadrant, it is often a sign of bad architectural decisions; this often shows that the business logic can be tested only through the user interface because it is not decoupled enough from the presentation layer.
Since Quadrant 2 is also about integration, this is the place where integration with all other systems takes place. Simulations are being replaced by the real thing, and tests are not only in memory any more—this is where the rubber meets the road.
If done right, you can actually reuse most of your unit tests from Quadrant 1 by redirecting the test from the simulation to the real thing. Again, this should be straightforward assuming you have the right architecture and design patterns in place.
Quadrant 2 is all about the What.
Pre-product
Quadrants 1 and 2 are pre-product. All the tests in these quadrants lead to the product. If one of the tests fails, you do not have a product. These two quadrants are your quality sentinels; if all of these tests are successful, you have a product. They perform the grunt work on a continuous basis and this is why these tests have to be automated.
This automation does not come cheap, but it pays back in spades in the long run. What can be better than to have a product that tests itself?
This is why continuous integration, along with automated builds and tests, is a must these days. If your Development Team does not have a continuous integration system up and running, they are putting you at risk. Make sure they have enough capacity each Sprint to implement the right infrastructure, or you will be paying for it eventually down the line (with interest) in the form of technical debt.
These two quadrants are all about supporting the Development Team in their daily work to deliver “Done” Increments of product continuously and build the foundation for emergent architecture.
Quadrant 3
Once you have the product, it is time to make sure it does exactly what the user wants in a usable way. This is when you provide the chance for hands-on playing around either from a testing side by exploratory testing or by real end users doing real target-driven work. Expect one of two feedbacks: Works for me/us or doesn’t work for me/us. If it is the later, you declare the functionality as not “Done” and put it back into the Product Backlog for future evaluation. If it is the former—yay! Automate the UATs (User Acceptance Tests) and move them into Quadrant 2. This way, the pre-product tests ensure that you keep the quality.
As this quadrant is all about the human aspect, it is clear that these tests are manual. Those tests are enough work to keep testing busy, which is another reason for automating Quadrants 1 and 2.
Quadrant 3 is all about the User.
Quadrant 4
How do you make sure your architecture is scalable, reliable, and performs well under load? Sure, you can test for many of those aspects in Quadrant 1 and possibly Quadrant 2, but in the end the only true measure for those quality attributes is with the final product. Once you have the product, you get the chance to make sure that system and underlying architecture afford all those nonfunctional requirements. These tests are often tool based, either through a purchased tool or custom development. Again, you have to automate as many of these tests as possible.
Quadrant 4 is all about the Nonfunctional Requirements.
Post-product
Quadrants 3 and 4 are post-product. All the tests are performed on the existing product to appraise, assess, and comment the product. This validation is still on premise, meaning it is not yet the market feedback. However, doing this continously and frequently improves the likelihood of releasing a successful product and therefore shrinking the product management vacuum.
QUIZ REVIEW
Compare your answers from the beginning of the chapter to the ones below. Now that you have read the chapter, would you change any of your answers? Do you agree with the answers below?
Statement |
Agree |
Disagree |
With Scrum, you need to release at the end of each Sprint. |
|
|
You cannot provide release dates with Scrum. |
|
|
You can release multiple times within a Sprint. |
|
|
Not allowing teams to release during important business periods (code freezes) reduces agility. |
|
|
With Scrum, Product Backlog items must be sized using relative points. |
|
|
A good release plan should include a buffer time period just before a release to stabilize the product (fix defects, regression test, document, etc). |
|
|
____________________________
1. Diego de lo Giudice, “Keynote: The State of Scaling Agile in the Age of the Customer,” Scrum Day Europe, Amsterdam, 2014.
2. James W. Grenning, “Planning Poker or How to Avoid Analysis Paralysis while Release Planning,” Hawthorn Woods: Renaissance Software Consulting, April 2002.
3. Ken Schwaber and Jeff Sutherland, “Changes to The Scrum Guide,” Scrum.org, July 6, 2016, https://www.scrum.org/About/All-Articles/articleType/ArticleView/articleId/1020/Changes-to-the-Scrum-Guide--ScrumPulse-Episode-14 (start watching at min 30:00).
4. Johanna Rothman, Manage Your Project Portfolio: Increase Your Capacity and Finish More Projects (Raleigh, NC: Pragmatic Bookshelf, 2009), 11.
5. Frederick Brooks, The Mythical Man Month (Reading, MA: Addison-Wesley, 1995), 25.
6. Rothman, Manage Your Product Portfolio, 23.
7. Craig Larman and Bas Vodde, Scaling Lean & Agile Development (Boston: Addison-Wesley, 2009).
8. Merriam-Webster, accessed March 22, 2018, https://www.merriam-webster.com/dictionary/nexus.
9. “The Nexus Guide,” Scrum.org, accessed March 3, 2018, https://www.scrum.org/resources/nexus-guide.
10. Kurt Bittner, Patricia Kong, and Dave West, The Nexus™ Framework for Scaling Scrum (Boston: Addison Wesley, 2017).
11. “Least Squares Regression,” Math Is Fun, accessed March 20, 2018, https://www.mathsisfun.com/data/least-squares-regression.html.
12. “Cone of Uncertainty: Facts and Myths About This Tropical Forecasting Tool,” Weather.com, September 4, 2017, https://weather.com/science/weather-explainers/news/tropical-storm-cycloneforecast-cone-hurricane.
13. Barry Boehm, Software Engineering Economics (Upper Saddle River, NJ: Prentice-Hall, 1981).
14. Steve McConnell, Software Estimation: Demystifying the Black Art (Redmond, WA: Microsoft Press, 2006).
15. Laurent Bossavit, The Leprechauns of Software Engineering, Leanpub, last updated June 27, 2017, https://leanpub.com/leprechauns.
16. “Introduction to Monte Carlo Simulation,” Microsoft, last updated August 21, 2014, https://support.office.com/en-us/article/introduction-to-monte-carlo-simulation-64c0ba99-752a-4fa8-bbd3-4450d8db16f1.
17. Tom DeMarco and Timothy Lister, Waltzing with Bears: Managing Risk on Software Projects (New York: Dorset House, 2003), 91.
18. John Kotter, “Accelerate!,” Harvard Business Review, November 2012.
19. Durward K. Sobek II and Art Smalley, A3—Understanding A3 Thinking (New York: Taylor and Francis, 2008).
20. Sandy Mamoli and David Mole, Creating Great Teams: How Self-Selection Lets People Excel (Dallas: Pragmatic Bookshelf, 2015).
21. Diana Larsen and Ainsley Nies, Liftoff (Hillsboro, OR: Onyx Neon Press, 2012).
22. https://en.wikipedia.org/wiki/Philip_B._Crosby
23. Johan Laurenz Eveleens and Chris Verhoef, “The Rise and Fall of the Chaos Report,” IEEE Software 27, no. 1 (2010): 30–36.
24. “About,” JUnit.org, accessed March 3, 2018, http://junit.org.