In this chapter, you will find out what to do when apps get buggy. You will learn how to use Logcat, Android Lint, and the debugger that comes with Android Studio.
To practice debugging, the first step is to break something. In QuizActivity.java, comment out the code in onCreate(Bundle) where you pull out mQuestionTextView.
Listing 4.1 Commenting out a crucial line (QuizActivity.java)
@Override
protected void onCreate(Bundle savedInstanceState) {
    super.onCreate(savedInstanceState);
    Log.d(TAG, "onCreate(Bundle) called");
    setContentView(R.layout.activity_quiz);

    if (savedInstanceState != null) {
        mCurrentIndex = savedInstanceState.getInt(KEY_INDEX, 0);
    }

    // mQuestionTextView = (TextView)findViewById(R.id.question_text_view);

    mTrueButton = (Button)findViewById(R.id.true_button);
    mTrueButton.setOnClickListener(new View.OnClickListener() {
        ...
    });
    ...
}
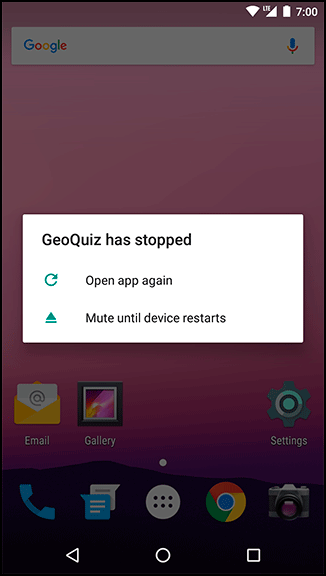
Run GeoQuiz and see what happens. Figure 4.1 shows the message that appears when your app crashes and burns. Different versions of Android will have slightly different messages, but they all mean the same thing.
Of course, you know what is wrong with your app, but if you did not, it might help to look at your app from a new perspective.
Expand the Android Monitor tool window so that you can see what has happened.
If you scroll up and down in Logcat, you should eventually find an expanse of red, as shown in Figure 4.2.
This is a standard AndroidRuntime exception report.
If you do not see much in Logcat and cannot find the exception, you may need to select the No Filters option in the filter dropdown. On the other hand, if you see too much in Logcat, you can adjust the Log Level to Error, which will show only the most severe log messages. You can also search for the text “FATAL EXCEPTION,” which will bring you straight to the exception that caused the app to crash.
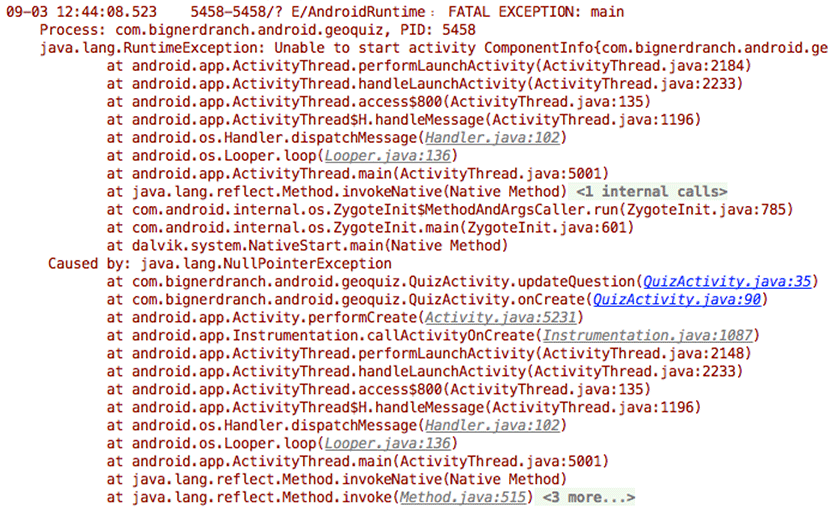
The report tells you the top-level exception and its stack trace, then the exception that caused that exception and its stack trace, and so on until it finds an exception with no cause.
In most of the code you will write, that last exception with no cause is the interesting one. Here the exception without a cause is a java.lang.NullPointerException. The line just below this exception is the first line in its stack trace. This line tells you the class and method where the exception occurred as well as what file and line number the exception occurred on. Click the blue link, and Android Studio will take you to that line in your source code.
The line to which you are taken is the first use of the mQuestionTextView variable, inside updateQuestion(). The name NullPointerException gives you a hint to the problem: This variable was not initialized.
Uncomment the line initializing mQuestionTextView to fix the bug.
When you encounter runtime exceptions, remember to look for the last exception in Logcat and the first line in its stack trace that refers to code that you have written. That is where the problem occurred, and it is the best place to start looking for answers.
If a crash occurs while a device is not plugged in, all is not lost. The device will store the latest lines written to the log. The length and expiration of the stored log depends on the device, but you can usually count on retrieving log results within 10 minutes. Just plug in the device and select it in the Devices view. Logcat will fill itself with the stored log.
Problems with your apps will not always be crashes. In some cases, they will be misbehaviors. For example, suppose that every time you pressed the NEXT button, nothing happened. That would be a noncrashing, misbehaving bug.
In QuizActivity.java, make a change to the mNextButton listener to comment out the code that increments mCurrentIndex.
Listing 4.2 Forgetting a critical line of code (QuizActivity.java)
@Override
protected void onCreate(Bundle savedInstanceState) {
    super.onCreate(savedInstanceState);
    ...
    mNextButton = (Button)findViewById(R.id.next_button);
    mNextButton.setOnClickListener(new View.OnClickListener() {
        @Override
        public void onClick(View v) {
            // mCurrentIndex = (mCurrentIndex + 1) % mQuestionBank.length;
            updateQuestion();
        }
    });
    ...
}
Run GeoQuiz and press the NEXT button. You should see no effect.
This bug is trickier than the last bug. It is not throwing an exception, so fixing the bug is not a simple matter of making the exception go away. On top of that, this misbehavior could be caused in two different ways: The index might not be changed, or updateQuestion() might not be called.
If you had no idea what was causing the problem, you would need to track down the culprit. In the next few sections, you will see two ways to do this: diagnostic logging of a stack trace and using the debugger to set a breakpoint.
In QuizActivity, add a log statement to updateQuestion().
Listing 4.3 Exception for fun and profit (QuizActivity.java)
public class QuizActivity extends AppCompatActivity {
    ...
    private void updateQuestion() {
        Log.d(TAG, "Updating question text", new Exception());
        int question = mQuestionBank[mCurrentIndex].getTextResId();
        mQuestionTextView.setText(question);
    }
The Log.d(String, String, Throwable) version of Log.d logs the entire stack trace just like the AndroidRuntime exception you saw earlier. The stack trace will tell you where the call to updateQuestion() was made.
The exception that you pass to Log.d(String, String, Throwable) does not have to be a thrown exception that you caught. You can create a brand new Exception and pass it to the method without ever throwing it, and you will get a report of where the exception was created.
Run GeoQuiz, press the NEXT button, and then check the output in Logcat (Figure 4.3).

The top line in the stack trace is the line where you logged out the Exception. A few lines after that you can see where updateQuestion() was called from within your onClick(View) implementation. Click the link on this line, and you will be taken to where you commented out the line to increment your question index. But do not get rid of the bug; you are going to use the debugger to find it again in a moment.
Logging out stack traces is a powerful tool, but it is also a verbose one. Leave a bunch of these hanging around, and soon Logcat will be an unmanageable mess. Also, a competitor might steal your ideas by reading your stack traces to understand what your code is doing.
On the other hand, sometimes a stack trace showing what your code does is exactly what you need. If you are seeking help with a problem at stackoverflow.com or forums.bignerdranch.com, it often helps to include a stack trace. You can copy and paste lines directly from Logcat.
Before continuing, delete the log statement in QuizActivity.java.
Now you will use the debugger that comes with Android Studio to track down the same bug. You will set a breakpoint on updateQuestion() to see whether it was called. A breakpoint pauses execution before the line executes and allows you to examine line by line what happens next.
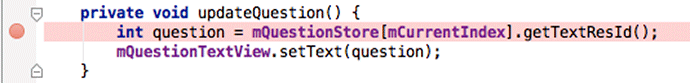
In QuizActivity.java, return to the updateQuestion() method. Next to the first line of this method, click the gray bar in the lefthand margin. You should now see a red circle in the gray bar like the one shown in Figure 4.4. This is a breakpoint.
To engage the debugger and trigger your breakpoint, you need to debug your app instead of running it. To debug your app, click the debug button (represented by a bug), which is next to the run button. You can also navigate to Run → Debug 'app' in the menu bar. Your device will report that it is waiting for the debugger to attach, and then it will proceed normally.
Once your app is up and running with the debugger attached, it will pause. Firing up GeoQuiz called QuizActivity.onCreate(Bundle), which called updateQuestion(), which hit your breakpoint.
In Figure 4.5, you can see that this editor has opened QuizActivity.java and highlighted the line with the breakpoint where execution has paused.
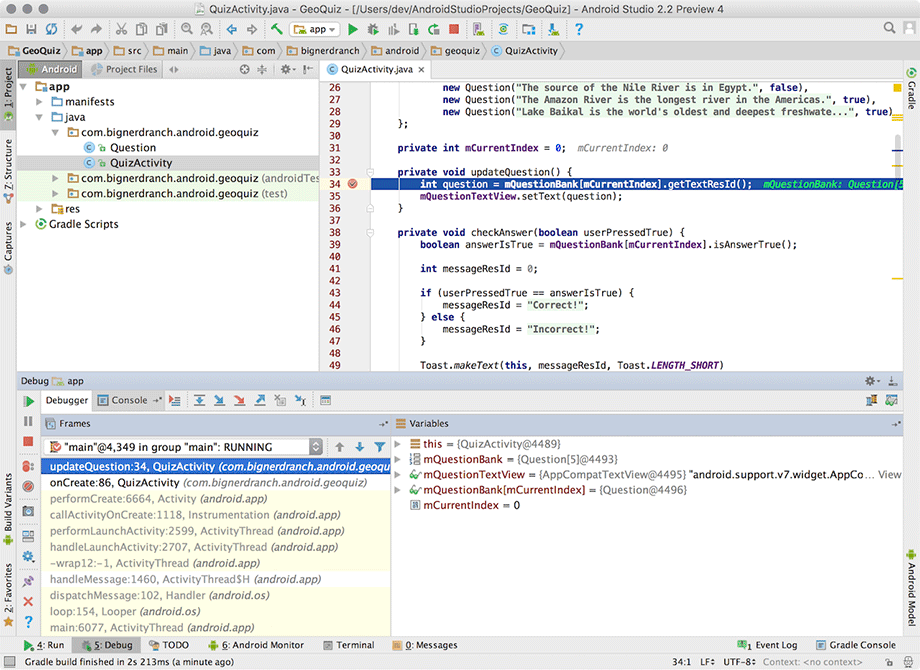
The debug tool window at the bottom of the screen is now visible. It contains the Frames and Variables views (Figure 4.6).
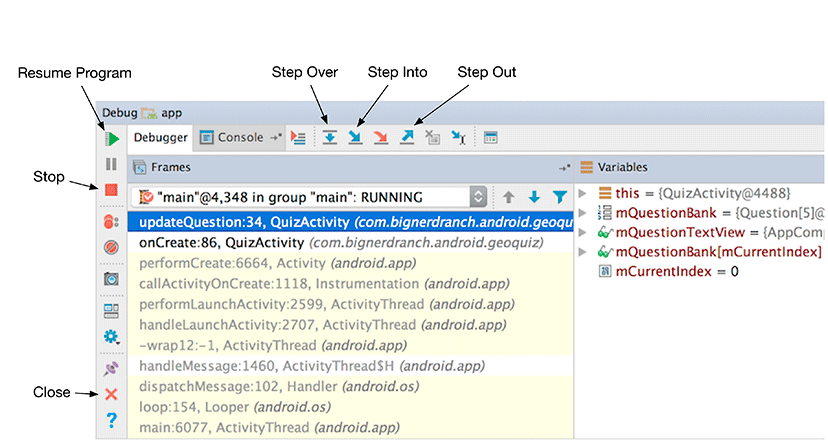
You can use the arrow buttons at the top of the view to step through your program. You can see from the stack trace that updateQuestion() has been called from inside onCreate(Bundle). But you are interested in investigating the NEXT button’s behavior, so click the resume program button to continue execution. Then press the NEXT button in GeoQuiz to see if your breakpoint is hit and execution is stopped. (It should be.)
Now that you are stopped at an interesting point of execution, you can take a look around. The Variables view allows you to examine the values of the objects in your program. You should see the variables that you have created in QuizActivity as well as an additional value: this (the QuizActivity instance itself).
You could expand the this variable to see all the variables declared in QuizActivity’s superclass, Activity, in Activity’s superclass, in its super-superclass, and so on. But for now, focus on the variables that you created.
You are only interested in one value: mCurrentIndex. Scroll down in the variables view until you see mCurrentIndex. Sure enough, it still has a value of 0.
This code looks perfectly fine. To continue your investigation, you need to step out of this method. Click the step out button.
Check the editor view. It has now jumped you over to your mNextButton’s OnClickListener, right after updateQuestion() was called. Pretty nifty.
You will want to fix this implementation, but before you make any changes to code, you should stop debugging your app. You can do this in two ways: You can stop the program, or you can simply disconnect the debugger. To stop the program, click the stop button shown in Figure 4.6. Usually it is easier to simply disconnect the debugger. To do that, click the close button also labeled in Figure 4.6.
Now return your OnClickListener to its former glory.
Listing 4.5 Returning to normalcy (QuizActivity.java)
@Override
protected void onCreate(Bundle savedInstanceState) {
    super.onCreate(savedInstanceState);
    ...
    mNextButton = (Button)findViewById(R.id.next_button);
    mNextButton.setOnClickListener(new View.OnClickListener() {
        @Override
        public void onClick(View v) {
            // mCurrentIndex = (mCurrentIndex + 1) % mQuestionBank.length;
            updateQuestion();
        }
    });
    ...
}
You have tried out two ways of tracking down a misbehaving line of code: stack trace logging and setting a breakpoint in the debugger. Which is better? Each has its uses, and one or the other will probably end up being your favorite.
Logging out stack traces has the advantage that you can see stack traces from multiple places in one log. The downside is that to learn something new you have to add new log statements, rebuild, deploy, and navigate through your app to see what happened. The debugger is more convenient. If you run your app with the debugger attached, then you can set a breakpoint while the application is still running and poke around to get information about multiple issues.
As if that were not enough choices, you can also use the debugger to catch exceptions. Return to QuizActivity’s onCreate method and comment out a line of code that will cause the app to crash.
Listing 4.6 Making GeoQuiz crash again (QuizActivity.java)
@Override
protected void onCreate(Bundle savedInstanceState) {
super.onCreate(savedInstanceState);
    ...
    // mNextButton = (Button) findViewById(R.id.next_button);
    mNextButton.setOnClickListener(new View.OnClickListener() {
        @Override
        public void onClick(View v) {
            mCurrentIndex = (mCurrentIndex + 1) % mQuestionBank.length;
            updateQuestion();
        }
    });
    ...
}
Now select Run → View Breakpoints... to pull up the breakpoints dialog, as shown in Figure 4.7.
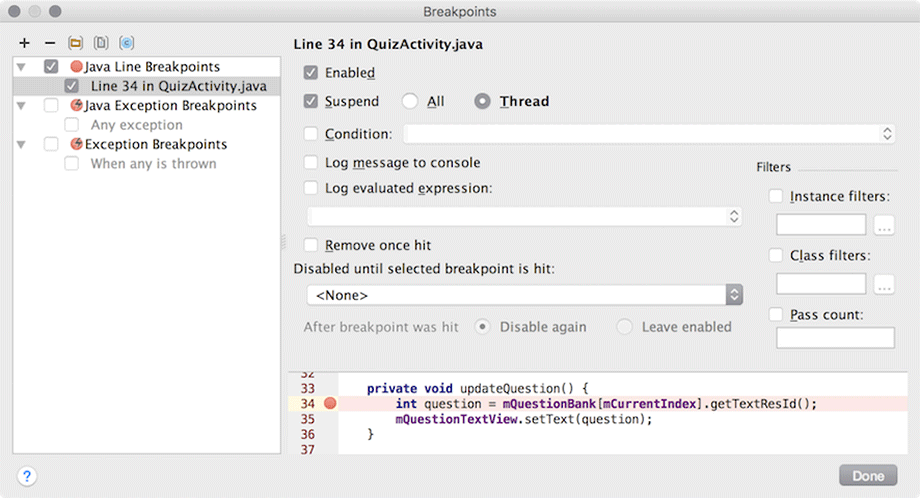
This dialog shows all of your currently set breakpoints. Remove the breakpoint you added earlier by highlighting it and clicking the - button.
The breakpoints dialog also allows you to set a breakpoint that is triggered when an exception is thrown, wherever it might happen. You can limit it to only uncaught exceptions or apply it to both caught and uncaught exceptions.
Click the + button to add a new breakpoint. Choose Java Exception Breakpoints in the drop-down list. You can now select the type of exception that you want to catch. Type in RuntimeException and choose RuntimeException (java.lang) from the suggestions. RuntimeException is the superclass of NullPointerException, ClassCastException, and other runtime problems, so it makes a nice catch-all.
Click Done and launch GeoQuiz with the debugger attached. This time, your debugger will jump right to the line where the exception was thrown as soon as it happens. Exquisite.
Now, this is a fairly big hammer. If you leave this breakpoint on while debugging, you can expect it to stop on some framework code or in other places you do not expect. So you may want to turn it off when you are not using it. Go ahead and remove the breakpoint now by returning to Run → View Breakpoints....
Undo the change from Listing 4.6 to get GeoQuiz back to a working state.