
CHAPTER 13
Monitoring and Auditing
This chapter covers the following subjects:
![]() Monitoring Methodologies: Monitoring the network is extremely important, yet often overlooked by security administrators. In this section, you learn about the various monitoring methodologies that applications and IDS/IPS solutions use.
Monitoring Methodologies: Monitoring the network is extremely important, yet often overlooked by security administrators. In this section, you learn about the various monitoring methodologies that applications and IDS/IPS solutions use.
![]() Using Tools to Monitor Systems and Networks: Here, we delve into the hands-on again. Included in this section are performance analysis tools, such as Performance Monitor, and protocol analysis tools, such as Wireshark.
Using Tools to Monitor Systems and Networks: Here, we delve into the hands-on again. Included in this section are performance analysis tools, such as Performance Monitor, and protocol analysis tools, such as Wireshark.
![]() Conducting Audits: Full-blown audits might be performed by third-party companies, but you as the security administrator should be constantly auditing and logging the network and its hosts. This section gives some good tips to follow when executing an audit and covers some of the tools you would use in a Windows server to perform audits and log them properly.
Conducting Audits: Full-blown audits might be performed by third-party companies, but you as the security administrator should be constantly auditing and logging the network and its hosts. This section gives some good tips to follow when executing an audit and covers some of the tools you would use in a Windows server to perform audits and log them properly.
This chapter discusses monitoring and auditing. Key point: Monitoring alone does not constitute an audit, but audits usually include monitoring. So we cover some monitoring methodologies and monitoring tools before we get into computer security audits. This chapter assumes that you have read through Chapter 12, “Vulnerability and Risk Assessment,” and that you will employ the concepts and tools you learned about in that chapter when performing an audit. Chapter 12 and this chapter are strongly intertwined; I broke them into two chapters because there was a bit too much information for just one, and I want to differentiate somewhat between risk and audits. But regardless, these two chapters are all about putting on your sleuthing hat. You might be surprised, but many networking and operating system security issues can be solved by using that old Sherlockian adage: “When you have eliminated the impossible, whatever remains, however improbable, must be the truth.” This process of elimination is one of the cornerstones of a good IT troubleshooter and works well in the actual CompTIA Security+ exam.
Foundation Topics
Monitoring Methodologies
To operate a clean, secure network, you must keep an eye on your systems, applications, servers, network devices, power devices, and the entire network in general. One way to do this is to monitor the network. This surveillance of the network in of itself increases the security of your entire infrastructure. By periodically watching everything that occurs on the network, you become more familiar with day-to-day happenings and over time get quicker at analyzing whether an event is legitimate. It can help to think of yourself as Hercule Poirot, the Belgian detective—seeing everything that happens on your network, and ultimately knowing everything that happens. It might be a bit egotistical sounding, but whoever said that IT people don’t have an ego?
This surveillance can be done in one of two ways: manual monitoring or automated monitoring. When manually monitoring the network, you are systematically viewing log files, policies, permissions, and so on. But this can also be automated. For example, there are several data mining programs available that can automatically sift through logs and other files for the exact information you want to know. In addition, applications such as antivirus, intrusion detection systems (IDSs), and intrusion prevention systems (IPSs) can automatically scan for errors, malicious attacks, and anomalies. The three main types of automated monitoring are signature-based, anomaly-based, and behavior-based.
Signature-Based Monitoring
In a signature-based monitoring scenario, frames and packets of network traffic are analyzed for predetermined attack patterns. These attack patterns are known as signatures. The signatures are stored in a database that must be updated regularly to have any effect on the security of your network. Many attacks today have their own distinct signatures. However, only the specific attack that matches the signature will be detected. Malicious activity with a slightly different signature might be missed. This makes signature-based monitoring vulnerable to false negatives—when an IDS, IPS, or antivirus system fails to detect an actual attack or error. To protect against this, the signature-based system should be updated to bring the system up to date with the latest signatures. When it comes to intrusion detection systems, the most basic form is the signature-based IDS. However, some signature-based monitoring systems are a bit more advanced and use heuristic signatures. These signatures incorporate an algorithm that determines whether an alarm should be sounded when a specific threshold is met. This type of signature is CPU-intensive and requires fine-tuning. For example, some signature-based IDS solutions use these signatures to conform to particular networking environments.
Anomaly-Based Monitoring
An anomaly-based monitoring system (also known as statistical anomaly-based) establishes a performance baseline based on a set of normal network traffic evaluations. These evaluations should be taken when the network and servers are under an average load during regular working hours. This monitoring method then compares current network traffic activity with the previously created baseline to detect whether it is within baseline parameters. If the sampled traffic is outside baseline parameters, an alarm will be triggered and sent to the administrator (as long as the system was configured properly). This type of monitoring is dependent on the accuracy of the baseline. An inaccurate baseline increases the likelihood of obtaining false indicators, such as false positives. Normally, false positives are when the system reads a legitimate event as an attack or other error. This can happen with an improperly configured IDS or IPS solution. If too many false indicator alerts are received by the security administrator, then the IDS/IPS should be reconfigured and baselines recollected, and/or those types of false alarms should be disabled.
Behavior-Based Monitoring
A behavior-based monitoring system looks at the previous behavior of applications, executables, and/or the operating system and compares that to current activity on the system. If an application later behaves improperly, the monitoring system will attempt to stop the behavior. This has advantages compared to signature-based and anomaly-based monitoring in that it can to a certain extent help with future events, without having to be updated. However, because there are so many types of applications, and so many types of relationships between applications, this type of monitoring could set off a high amount of false positives. Behavior monitoring should be configured carefully to avoid the system triggering alarms due to legitimate activity.
Note
Heuristic analysis is often used in combination with behavior-based monitoring as it relates to antivirus software and IDS/IPS solutions. A heuristic in computer science is an algorithm that consistently performs quickly, and provides good results based on a set of rules. Heuristic analysis is designed to detect malicious behavior without uniquely identifying it (as is done in a signature-based system). It can find previously unknown malicious behavior by comparing it to known and similar malicious behavior. Then it “guesses” whether something is malicious or not. This can lead to low accuracy and a high percentage of false positives.
Table 13-1 summarizes the monitoring methods discussed. Keep in mind that some systems (IDS, IPS, and so on) might combine more than one of these monitoring methods.

Table 13-1 Summary of Monitoring Methodologies
Monitoring Methodology |
Description |
Signature-based monitoring |
Network traffic is analyzed for predetermined attack patterns. These attack patterns are known as signatures. |
Anomaly-based monitoring |
Establishes a performance baseline based on a set of normal network traffic evaluations. Requires a baseline. |
Behavior-based monitoring |
Looks at the previous behavior of applications, executables, and/or the operating system and compares that to current activity on the system. If an application later behaves improperly, the monitoring system will attempt to stop the behavior. Requires a baseline. |
Using Tools to Monitor Systems and Networks
All the methodologies in the world won’t help you unless you know how to use some monitoring tools and how to create baselines. By using performance monitoring gizmos and software, incorporating protocol analyzers, and using other analytical utilities in the GUI and the command-line, you can really “watch” the network and quickly mitigate threats as they present themselves.
In this section, we use the Performance tool in Windows, the Wireshark protocol analyzer, and other analytical tools within the command-line and the GUI. These are just a couple examples of performance and network monitoring tools out there, but they are commonly used in the field and should give you a decent idea of how to work with any tools in those categories.
Performance Baselining
We mentioned in Chapter 4, “OS Hardening and Virtualization,” that baselining is the process of measuring changes in networking, hardware, software, applications, and so on. Documenting and accounting for changes in a baseline is known as baseline reporting. Baseline reporting enables a security administrator to identify the security posture of an application, system, or network. The security posture can be defined as the risk level to which a system, or other technology element, is exposed. Security posture assessments (SPAs) use baseline reporting and other analyses to discover vulnerabilities and weaknesses in systems.
Note
Ultimately, a security baseline will define the basic set of security objectives that must be met by any given service or system. Baseline deviation, meaning any changes or discrepancies as compared to the baseline, should be investigated right away, especially for mission-critical systems and RTOS-based computers.
Let’s get into baselining a little more and show one of the software tools you can use to create a baseline.
Creating a baseline consists of selecting something to measure and measuring it consistently for a period of time. For example, we might want to know what the average hourly data transfer is to and from a server’s network interface. There are a lot of ways to measure this, but we could possibly use a performance monitoring tool or a protocol analyzer to find out how many packets cross through the server’s network adapter. This could be run for 1 hour (during business hours, of course) every day for 2 weeks. Selecting different hours for each day would add more randomness to the final results. By averaging the results together, we get a baseline. Then we can compare future measurements of the server to the baseline. This helps us define what the standard load of our server is and the requirements our server needs on a consistent basis. It also helps when installing other like computers on the network. The term baselining is most often used to refer to monitoring network performance, but it actually can be used to describe just about any type of performance monitoring and benchmarking. The term standard load is often used when referring to servers. A configuration baseline defines what the standard load of the server is for any measured objects. When it comes to performance-monitoring applications, objects are all of the components in the server (for example, CPU, RAM, hard disk, and so on). They are measured using counters. A typical counter would be the % Processor Time of the CPU. This is used by the Task Manager.
An example of one of these tools is the Performance Monitor tool in Windows. It can help to create baselines measuring network activity, CPU usage, memory, hard drive resources used, and so on. It should also be used when monitoring changes to the baseline. Figure 13-1 shows an example of Performance Monitor in Windows. The program works basically the same in all version of Windows, be it client or server, but the navigation to the program will vary. To simplify matters, go to the Run prompt and type perfmon.exe in Windows to open the program.
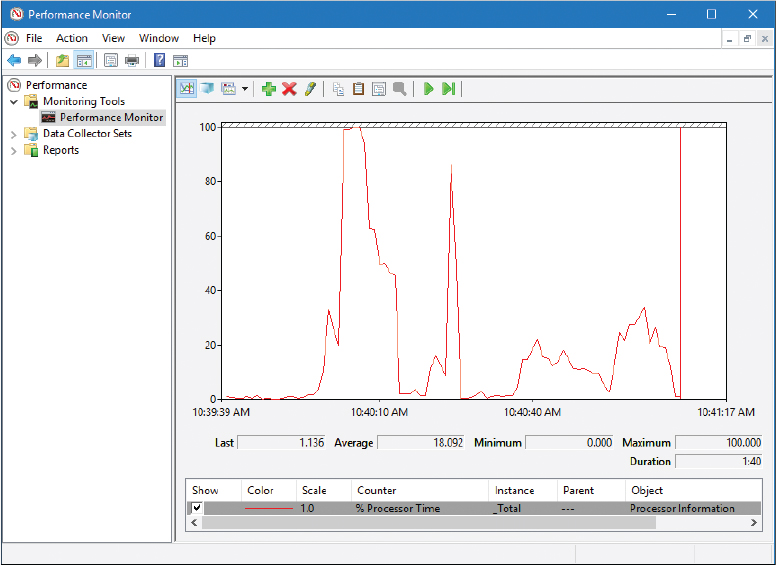
The CPU is probably the most important component of the computer. In Figure 13-1, the CPU counter hit 100% once, which is normal when opening applications or starting other processes. However, if the CPU maxes out often, then a percentage of clients will not be able to obtain access to resources on the computer. If the computer is a server, then that means trouble. CPU spiking could be due to normal usage, or it could be due to malicious activity or perhaps bad design. Further analysis would be necessary to determine the exact cause. If the system is a virtual machine, there is a higher probability of CPU spikes. Proper design of VMs is critical, and they must have a strong platform to run on if they are to serve clients properly. Known as a counter, the CPU % Processor Time is just one of many counters. A smart security auditor measures the activity of other objects such as the hard drive, paging file, memory (RAM), network adapter, and whatever else is specific to the organization’s needs. Each object has several counters to select from. For example, if you are analyzing a web server, you would probably want to include the HTTP Service Request Queries object, and specifically the ArrivalRate and CurrentQueueSize counters, in your examination.
Now, Figure 13-1 shows the Performance Monitor screen, but this only gives us a brief look at our system. The window of time is only a minute or so before the information refreshes. However, we can record this information over x periods of time and create reports from the recorded information. By comparing the Performance Monitor reports and logs, we ultimately create the baseline. The key is to measure the same way at the same time each day or each week. This provides accurate comparisons. However, keep in mind that performance recording can be a strain on resources. Verify that the computer in question can handle the tests first before you initiate them.
Making reports is all fine and good (and necessary), but it is wise to also set up alerts. Alerts can be generated automatically by the system and sent to administrators and other important IT people. These alerts can be set off in a myriad of ways, all of your choosing; for example, if the CPU were to trip a certain threshold or run at 90% for more than a minute (although this is normal in some environments). Or maybe the physical disk was peaking at 100 MB/s for more than 5 minutes. If these types of things happen often, the system should be checked for malicious activity, illegitimate usage, or the need for an upgrade.
A tool similar to Performance Monitor used in Linux systems is called System Monitor. The different versions of Linux also have many third-party tools that can be used for performance monitoring. macOS/OS X uses Activity Monitor.
Protocol Analyzers
We’ve mentioned protocol analyzers a couple of times already in this book but haven’t really delved into them too much. There are many protocol analyzers available, some free, some not, and some that are part of an operating system. In this section, we focus on Wireshark. Note that network adapters can work in one of two different modes:
![]() Promiscuous mode: The network adapter captures all packets that it has access to regardless of the destination of those packets.
Promiscuous mode: The network adapter captures all packets that it has access to regardless of the destination of those packets.
![]() Non-promiscuous mode: The network adapter captures only the packets addressed to it specifically.
Non-promiscuous mode: The network adapter captures only the packets addressed to it specifically.
Packet capturing programs have different default settings for these modes. Some programs and network adapters can be configured to work in different modes.
Protocol analyzers can be useful in diagnosing where broadcast storms are coming from on your LAN. A broadcast storm (or extreme broadcast radiation) is when there is an accumulation of broadcast and multicast packet traffic on the LAN coming from one or more network interfaces. These storms could be intentional or could happen due to a network application or operating system error. The protocol analyzer can specify exactly which network adapter is causing the storm.
Protocol analyzers are also effective in finding header manipulation. Header manipulation can be accomplished by entering unvalidated data into the header of a packet and can ultimately enable XSS attacks, poisoning attacks, hijacking, and cookie manipulation. Header manipulation is common in HTTP response packets. The exploit can be prevented/corrected with proper input validation and detected with a protocol analyzer.
Protocol analyzers can look inside a packet that makes up a TCP/IP handshake. Information that can be viewed includes the SYN, which is the “synchronized sequence numbers,” and the ACK, which is “acknowledgment field significant.” By using the protocol analyzer to analyze a TCP/IP handshake, you can uncover attacks such as TCP hijacking. But that is just one way to use a protocol analyzer to secure your network. Let’s talk about an industry standard protocol analyzer now.
Wireshark
Wireshark is a free download that works on several platforms. It is meant to capture packets on the local computer that it is installed on. But often, this is enough to find out vulnerabilities and monitor the local system and remote systems such as servers. Because Wireshark works in promiscuous mode, it can delve into packets even if they weren’t addressed to the computer it runs on. To discern more information about the remote systems, simply start sessions from the client computer to those remote systems and monitor the packet stream. If that is not enough, the program can be installed on servers as well. However, you should check company policy (and get permission) before ever installing any software on a server.
Note
When installing Wireshark to a Windows system, you will also need the latest version of WinPcap. Pcap (sometimes shown as PCAP) stands for packet capture.
Imagine that you were contracted to find out whether an organization’s web server was transacting secure data utilizing TLS version 1.0. But the organization doesn’t want anyone logging in to the server—all too common! No problem; you could use Wireshark on a client computer, initiate a packet capture, make a connection to the web server’s secure site, and verify that TLS 1.0 is being used by analyzing the packets, as shown in Figure 13-2. If you saw other protocols such as SSL 2.0 that should happen to raise a red flag, then you would want to investigate further, most likely culminating in a protocol upgrade or change.

Always take screen captures and save your analysis as proof of the work that you did, and as proof of your conclusions and ensuing recommendations. You can also save the packet capture file (with the .pcap extension) for future analysis.
Remember that Wireshark can be used with a network adapter configured for promiscuous mode. It is set up by default to collect packets locally and from other sources. However, you can also capture and analyze packets using port mirroring or a network tap. Port mirroring, also known as SPAN, is when you configure one or more ports on a switch to forward all packets to another port. That destination port is where your packet capturing computer is plugged in. Know that this can place a considerable load on the CPU of the switch, which can lead to dropped packets. A network tap (as mentioned in Chapter 9) is a physical device that intercepts traffic between two points of the network. It commonly has three ports: two for the points to be monitored, and a third for the packet capturing computer. This is a costlier solution but can monitor all packets and frames of information with no risk of dropped packets.
How about another real-world example? Let’s just say you were contracted to monitor an FTP server. The organization is not sure whether FTP passwords are truly being encrypted before being sent across the network. (By the way, some FTP programs with a default configuration do not encrypt the password.) You could use a packet sniffer to initiate a capture of packets on the monitoring server. Then, start up an FTP session on the monitoring server and log in to the FTP server. Afterward, stop the capture and view the FTP packets. Figure 13-3 shows an example of an FTP packet with a clear-text password. Notice that frame 1328 shows the password “locrian” in the details.
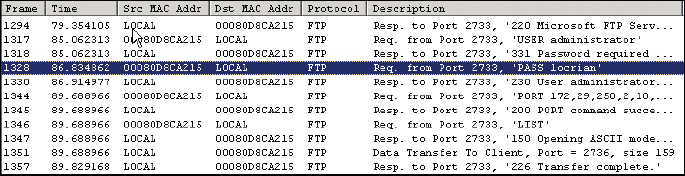
Clear-text passwords being passed across the network is a definite risk. The vulnerabilities could be mitigated by increasing the level of security on the FTP server and by using more secure programs. For example, if the FTP server were part of Windows IIS, domain-based or other authentication could be implemented. Or perhaps a different type of FTP server could be used, such as Pure-FTPd. And secure FTP client programs could be used as well. Instead of using the Command Prompt or a browser to make FTP connections, the FileZilla or WS_FTP programs could be used.
Note
tcpdump is a Unix/Linux-based packet analyzer that runs in the command-line. It can be used for intercepting and displaying the communications of other systems, so it is often used by security techs and attackers alike. The Windows port for this is WinDump, another program that is reliant on WinPcap.
SNMP
The Simple Network Management Protocol (SNMP) is a TCP/IP protocol that aids in monitoring network-attached devices and computers. It’s usually incorporated as part of a network management system, such as Windows SCCM/SCOM, or free SNMP-based monitoring software. A typical scenario that uses SNMP can be broken down into three components:
![]() Managed devices: Computers or other network-attached devices monitored through the use of agents by a network management system.
Managed devices: Computers or other network-attached devices monitored through the use of agents by a network management system.
![]() Agent: Software deployed by the network management system that is loaded on managed devices. The software redirects the information that the NMS needs to monitor the remote managed devices.
Agent: Software deployed by the network management system that is loaded on managed devices. The software redirects the information that the NMS needs to monitor the remote managed devices.
![]() Network management system (NMS): The software run on one or more servers that controls the monitoring of network-attached devices and computers.
Network management system (NMS): The software run on one or more servers that controls the monitoring of network-attached devices and computers.
So, if the IT director asked you to install agents on several computers and network printers, and monitor them from a server, this would be an example of SNMP and the use of a network management system.
SNMP uses ports 161 and 162. SNMP agents receive requests on port 161; these requests come from the network management system or simply “manager.” The manager receives notifications on port 162.
Because applications that use SNMP versions 1 and 2 are less secure, they should be replaced by software that supports SNMP version 3, as of the writing of this book, or whatever the latest version is. SNMPv3 provides confidentiality through the use of encrypted packets that prevent snooping and provide additional message integrity and authentication. However, there are vulnerabilities, such as power distribution units (PDUs) monitored by SNMP that use weak symmetric algorithms like CBC-DES. Packet analyzers and other third-party programs can be used to analyze SNMP devices, their packets, and any potential vulnerabilities.
Historically, SNMP-based monitoring and management tools have been in-band, meaning that the admin connects locally through the main company network itself. In-band management is very common. However, an admin might find the need to take an alternate path to manage network devices. In this case, the admin requires out-of-band management. This is common for devices that do not have a direct network connection, such as UPSs, PBX systems, and environmental controls. More importantly, in a mission-critical network, SNMP-based in-band management tools are not enough, because if the main LAN fails, then there is no path to manage the devices. That’s when out-of-band management becomes crucial. Out-of-band tools that are based on RS-232 access, or even an entirely separate LAN, are required if the main network fails. The key here is that an access switch of some kind that is independent from the main (in-band) network is available to the managed devices. The decision of whether to use in-band or out-of-band management (or both) should be weighed carefully. Remember that every additional system or network increases the security risk, and needs to be protected appropriately—on a physical and a logical level. Then, this needs to be balanced against the level of criticality of your systems.
Analytical Tools
In this book, we try to distinguish between monitoring, auditing, vulnerability assessment, and forensics, but from a hands-on point of view, they are all quite similar. Many analytical tools can be used for multiple security purposes. This section discusses a few more tools that are more fine-tuned for monitoring, but that doesn’t mean that they can’t be used for other security purposes; and there are plenty of other tools not mentioned here that can also be used for monitoring.
You will probably want to monitor open sessions and files. In Windows, any files and shares that are being accessed by remote computers can be monitored within Computer Management (Run > compmgmt.msc). Inside Computer Management, navigate to System Tools > Shared Folders. From there you can see what shares and open files are being accessed, and what network sessions are open to that computer.
Note
On some versions of Windows the Performance Monitor utility (discussed previously) can also be found within Computer Management.
One thing you can’t see in this utility is the files that were opened locally. But for this you can use the openfiles command, which also allows you to see files opened by remote computers. The openfiles command must be run in elevated mode within the Command Prompt, and by default the Maintain Objects List global flag must be enabled, which can be done with the following syntax:
openfiles /local on
Then, simply run the openfiles command to see what files are opened locally, and by remote computers, as shown in Figure 13-4. Of course, there are switches that you can use to modify the command; view them with the /? option.

You might have to increase the screen buffer for the Command Prompt to see all of the results. As you can see in the figure, there is a long list of locally accessed files, but more importantly, the second list (starting with ID 2) shows any files that remote computers are connected to. You can also use openfiles to disconnect those remote computers. Example syntax for this is
openfiles /disconnect /id ##
where ## is the ID number associated with the file, shown at the left of the figure.
You might also find that files have been opened and possibly compromised. When you are not sure if the integrity of a file (or files) has been affected, you can use the FC command to compare the file that is suspected of compromise with an older version of the file.
Files can also be viewed and closed with the net file command (must be run in elevated mode). You’ll probably also want to make use of the net config, net session, and net view commands. Better yet—just know the whole net command like the back of your hand. And of course there’s the netstat command; for example, netstat –an is a good way to show open ports in numeric format, and netstat –e gives the amount of bytes and packets (and errors) sent and received.
We previously mentioned a few commands in Linux that can be used to view processes, services, and open files. Another command that can be used to show open files is lsof (list openfiles). The netstat command functions similarly in Linux as it does in Windows (with netstat –l being very informative).
Changing gears somewhat: What makes up a lot of the files stored on servers? Individual keystrokes—a bunch of them. And these, too, can be monitored, with keyloggers—both hardware-based and software-based. The hardware variety is usually an inline (or pass-through) device that connects to the end of a keyboard’s cable just before the port on the computer. These are tricky little devices that often look like a basic adapter. But in reality, they are fairly expensive devices that can store gigabytes of data and can transmit data wirelessly. You can identify a potential keylogger by the fact that it has the same port on each end, albeit one male and one female. Often, they are heavier than a basic adapter of similar size due to the additional processors and the antenna that are built in. The basic countermeasure for these is to deny physical access to areas of the building with important data, such as server rooms. If people have free access to your building, then there is a definite vulnerability. As a security administrator, you should lobby against such access, but if it is inescapable, then a thorough visual search of computers should be periodically undertaken. Sometimes, a computer’s ports cannot be visualized very easily, but have no fear, there are software tools that can be used to locate these physical keyloggers as well. Speaking of software tools, keyloggers come in software format as well, and some are very difficult to detect (such as Actual Keylogger). These software tools can be prevented by using anti-keylogger software and security tokens. They can be detected using live USB/CD/DVD operating systems and network monitoring programs.
Use Static and Dynamic Tools
The list of analytical tools goes on and on, both integrated into the operating system and offered by third parties. Most of the analytical tools discussed in this section are static in nature. Because of this they are not best suited for monitoring environments where you are attempting to create a baseline. Other, more dynamic tools such as Performance Monitor and Wireshark will work better. However, there is something to be said about taking a snapshot of the moment with tools such as openfiles and getting a quick glimpse at what happened at just that moment. Taking it to the next level, it’s the combination of static and dynamic tools that will allow you to properly conduct an audit.
Conducting Audits
Computer security audits are technical assessments conducted on applications, systems, or networks. They are an example of a detective security control. Audits can be done manually or with computer programs. Manual assessments usually include the following:
![]() Review of security logs
Review of security logs
![]() Review of access control lists
Review of access control lists
![]() Review of user rights and permissions
Review of user rights and permissions
![]() Review of group policies
Review of group policies
![]() Performance of vulnerability scans
Performance of vulnerability scans
![]() Review of written organization policies
Review of written organization policies
![]() Interviewing organization personnel
Interviewing organization personnel
Programs used to audit a computer or network could be as simple as a program such as Belarc Advisor, or built-in auditing features within Windows and Linux, or more complex open source projects such as OpenXDAS.
When I have conducted IT security audits in the past, the following basic steps have helped me organize the entire process:
Step 1. Define exactly what is to be audited.
Step 2. Create backups.
Step 3. Scan for, analyze, and create a list of vulnerabilities, threats, and issues that have already occurred.
Step 4. Calculate risk.
Step 5. Develop a plan to mitigate risk and present it to the appropriate personnel.
Although an independent security auditor might do all these things, a security administrator will be most concerned with the auditing of files, logs, and systems security settings.
Auditing Files
When dealing with auditing, we are interested in the who, what, and when. Basically, a security administrator wants to know who did what to a particular resource and when that person did it.
Auditing files can usually be broken down into a three-step process:
Step 1. Turn on an auditing policy.
Step 2. Enable auditing for particular objects such as files, folders, and printers.
Step 3. Review the security logs to determine who did what to a resource and when.
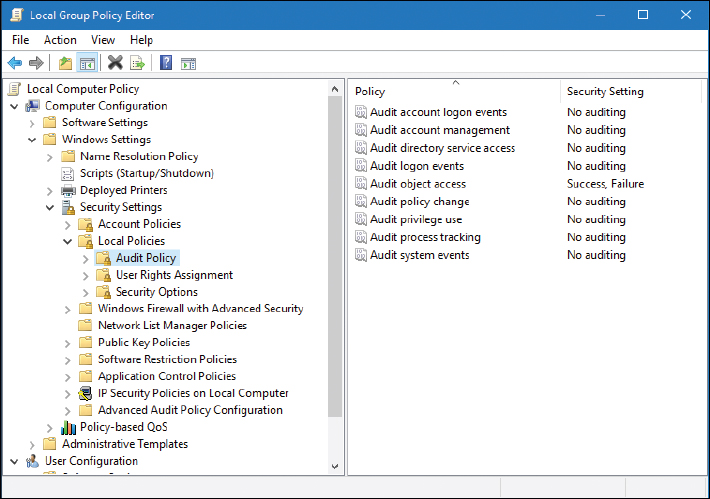
As an example, let’s use a Windows client computer. First, we would need to turn on a specific auditing policy such as “audit object access.” This can be done within the Local Computer Policy, as shown in Figure 13-5. You can select from several different auditing policies such as logon events and privilege use, but object access is probably the most common, so we’ll use that as the example.
Next, we would need to enable auditing for particular objects. Let’s say that we are auditing a folder of data. We would want to go to the Properties dialog box for that folder, then navigate to the Security tab, then click the Advanced button, and finally access the Auditing tab, as shown in Figure 13-6.
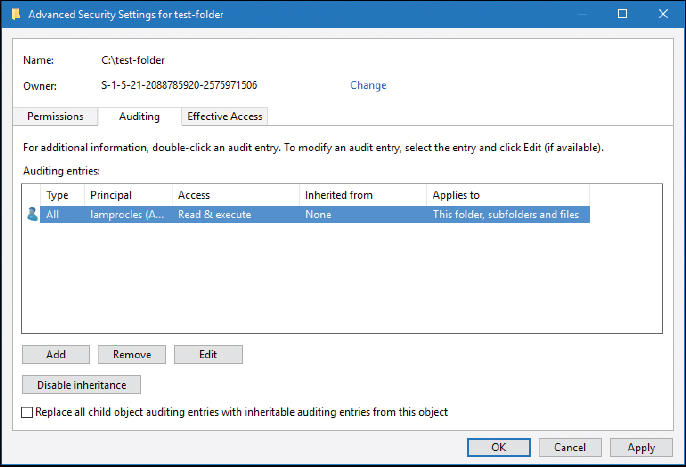
From there, we can add users whom we want to audit, and we can specify one or more of many different attributes to be audited.
Finally, we need to review the security logs to see exactly what is happening on our system and who is accessing what and when. The security logs also tell us whether users have succeeded or failed in their attempts to access, modify, or delete objects. And if users deny that they attempted to do something, these logs act as proof that their user account was indeed involved. This is one of several ways of putting non-repudiation into force. Non-repudiation is the idea of ensuring that a person or group cannot refute the validity of your proof against them.
A common problem with security logs is that they fail to become populated, especially on older systems. If users complain to you that they cannot see any security events in the Event Viewer, you should ask yourself the following:
![]() Has auditing been turned on in a policy? And was it turned on in the correct policy?
Has auditing been turned on in a policy? And was it turned on in the correct policy?
![]() Was auditing enabled for the individual object?
Was auditing enabled for the individual object?
![]() Does the person attempting to view the log have administrative capabilities?
Does the person attempting to view the log have administrative capabilities?
In addition, you have to watch out for overriding policies. By default, a policy gets its settings from a parent policy; you might need to turn off the override option. On another note, perhaps the audit recording failed for some reason. Many auditing systems also have the capability to send an alert to the administrator in the case that a recording fails. Hopefully, the system attempts to recover from the failure and continue recording auditing information while the administrator fixes the issue. By answering all these questions and examining everything pertinent to the auditing scenario, you should be able to populate that security log! Now, security logs are just one component of logging that we cover in the next section.
Logging
When it comes to auditing an organized set of information, logging is the method of choice. Frequent monitoring of logs is an important part of being a security person. Possibly the most important log file in Windows is the Security log, as shown in Figure 13-7.
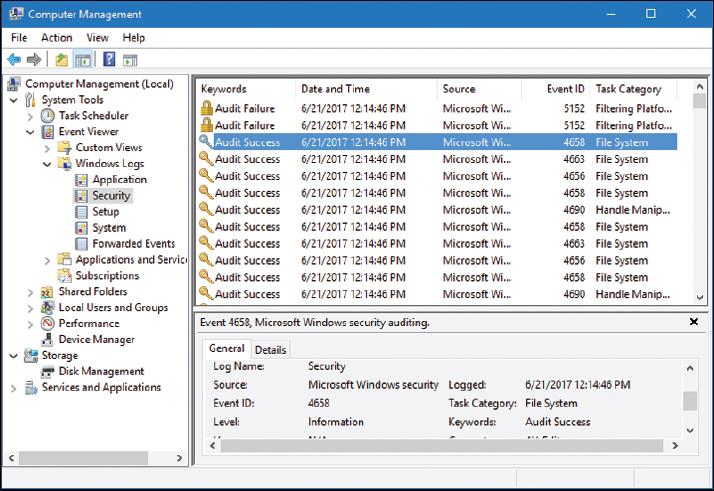
The Security log can show whether a user was successful at doing a variety of things, including logging on to the local computer or domain; accessing, modifying, or deleting files; modifying policies; and so on. Of course, many of these things need to be configured first before they can be logged. Newer versions of Windows automatically log such events as logon or policy modification. All these Security log events can be referred to as audit trails. Audit trails are records or logs that show the tracked actions of users, whether the user was successful in the attempt or not.
A security administrator should monitor this log file often to keep on top of any breaches, or attempted breaches, of security. By periodically reviewing the logs of applications, operating systems, and network devices, we can find issues, errors, and threats quickly and increase our general awareness of the state of the network.
Several other types of Windows log files should be monitored periodically, including the following:
![]() System: Logs events such as system shutdown or driver failure
System: Logs events such as system shutdown or driver failure
![]() Application: Logs events for operating system applications and third-party programs
Application: Logs events for operating system applications and third-party programs
The System and Application logs exist on client and server versions of Windows. A few log files that exist only on servers include the following:
![]() Distributed File System (DFS) Replication Service or File Replication Service
Distributed File System (DFS) Replication Service or File Replication Service
![]() DNS Server
DNS Server
![]() Directory Service
Directory Service
The Distributed File System (DFS) Replication log (or File Replication Service log on older versions of Windows Server) exists on Windows Servers by default. However, the Directory Service log will appear if the server has been promoted to a domain controller, and the DNS Server log will appear only if the DNS service has been installed to the server. Figure 13-8 shows the logs that run on a Windows Server that has been promoted to a domain controller and is running DNS.

We’ve mentioned the importance of reviewing DNS logs previously in the book but it is worth reminding you that examining the DNS log can uncover unauthorized zone transfers and other malicious or inadvertent activity on the DNS server. In the case of Figure 13-8, we see a warning stating that Active Directory Domain Services (AD DS) has not signaled to DNS that synchronization of the directory has completed; we’ll have to investigate that and probably fix that manually.
Let’s not forget about web servers—by analyzing and monitoring a web server, you can determine whether the server has been compromised. Drops in CPU and hard disk speed are common indications of a web server that has been attacked. Of course, it could just be a whole lot of web traffic! It’s up to you to use the log files to find out exactly what is going on.
Other types of operating systems, applications, and devices have their own set of log files—for example, applications such as Microsoft Exchange and SQL database servers, and firewalls. The firewall log especially is of importance, as shown in Figure 13-9. Note in the figure the dropped packets from addresses on the 169.254.0.0 network, which we know to be the APIPA network number. This is something that should be investigated further because most organizations have a policy against the use of APIPA addresses.
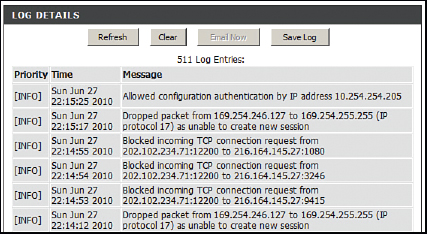
The firewall log can show all kinds of other things such as malicious port scans and other vulnerability scans. For example, when digging into a firewall log event, if you see the following syntax, you would know that a port scan attack has occurred:
S=207.50.135.54:53 – D=10.1.1.80:0
S=207.50.135.54:53 – D=10.1.1.80:1
S=207.50.135.54:53 – D=10.1.1.80:2
S=207.50.135.54:53 – D=10.1.1.80:3
S=207.50.135.54:53 – D=10.1.1.80:4
S=207.50.135.54:53 – D=10.1.1.80:5
Note the source IP address (which is public and therefore most likely external to your network) uses port 53 outbound to run a port scan of 10.1.1.80, starting with port 0 and moving on from there. The firewall is usually the first line of defense, but even if you have an IDS or IPS in front of it, you should review those firewall logs often.
A very useful tool for the security administrator is Syslog. Syslog is the standard for computer message logging. Most devices such as switches, routers, and firewalls use it, or can be updated to use it. For example, the log in Figure 13-9 was generated while adhering to the Syslog protocol. In addition, that log can be exported in real time to a computer running a Syslog server. The Syslog server is really just a repository for the logs that already exist on your routers and other devices. The key is that the Syslog server can run directly on your workstation, and pull the logs from those devices, so that you can easily monitor what is happening on those devices from the comfort of your seat. Yes, you could check the logs by logging in to the router or other device, but the logs won’t be readily available; you will have to locate them, and different devices will store them in different places. With a Syslog server, you can view multiple devices’ logs from one screen.
To illustrate this technology in action, take a look at Figure 13-10. This shows a Syslog program that is getting a log fed to it from a SOHO router. You can see that it is very easy to read the details of that log within the Syslog program; much easier than it would be to read them from within the SOHO router’s interface.

Figure 13-10 shows a list of logs. The one at the top is highlighted. It shows that the Source IP is 10.254.254.1. That is the internal IP address of the SOHO router—the device that is creating the log, and the one that is being monitored. The highlighted entry also has details at the bottom of the screen. You can see that the SOHO router blocked a TCP packet from the IP address 64.233.171.188 (in this case from port 5228). This is real, and it happens all the time as you can see from the log. It really reinforces the fact that you need to make sure your router (or other device) has its ports closed, and is patched and up to date!
By default, Syslog uses port 514 and works over a UDP transport mechanism. There are several companies that offer Syslog programs (SolarWinds Kiwi and Syslog Watcher, for example), and they all work in basically the same way, though some use a proprietary port number instead of the standard 514, and may offer TCP connectivity as well, to avoid packet loss. Port 6514 is used for secure connections known as Syslog over TLS.
Note
Though Windows does not by default support exporting of logs to a Syslog server, there are utilities you can download that will convert event logs from the Event Viewer into Syslog messages.
Log File Maintenance and Security
The planning, maintenance, and security of the log files should be thoroughly considered. A few things to take into account include the configuration and saving of the log files, backing up of the files, and securing and encrypting of the files.
Before setting up any type of logging system, you should consider the amount of disk space (or other form of memory) that the log files will require. You should also contemplate all the different information necessary to reconstruct logged events later. Are the logs stored in multiple locations? Were they encrypted? Were they hashed for integrity? Also up for consideration is the level of detail you will allow in the log. Verbose logging is something that admins apply to get as much information as possible. Also, is the organization interested in exactly when an event occurred? If so, time stamping should be incorporated. Although many systems do this by default, some organizations opt to not use time stamping to reduce CPU usage.
Log files can be saved to a different partition of the logging system, or saved to a different system altogether; although, the latter requires a fast secondary system and a fast network. The size and overwriting configuration of the file should play into your considerations. Figure 13-11 shows an example of the properties of a Windows Server Security log file. Currently, the file is 74 MB but can grow to a maximum size of 131072 KB (128 MB). Although 128 MB might sound like a lot, larger organizations can eat that up quickly because they will probably audit and log a lot of user actions. When the file gets this big, log mining becomes important. There can be thousands and thousands of entries, making it difficult for an admin to sort through them all, but several third-party programs can make the mining of specific types of log entries much simpler. You can also note in the figure that the log is set to overwrite events if the log reaches its maximum size. Security is a growing concern with organizations in general, so the chances are that they will not want events overwritten. Instead, you would select Do Not Overwrite Events (Clear Log Manually). As an admin, you would save and back up the log monthly or weekly, and clear the log at the beginning of the new time period to start a new log. If the log becomes full for any reason, you should have an alert set up to notify you or another admin.

As with any security configurations or files, the log files should be backed up. The best practice is to copy the files to a remote log server. The files could be backed up to a separate physical offsite location. Or, WORM (write once read many) media types could be utilized. WORM options such as DVD-R and other optical discs are good ways to back up log files, but not re-write optical discs, mind you. USB Flash drives and USB removable hard drives should not be allowed in any area where a computer stores log files. One way or another, a retention policy should be in place for your log files—meaning they should be retained for future reference.
Securing the log files can be done in several ways: First, by employing the aforementioned backup methods. Second, by setting permissions to the actual log file. Figure 13-11 shows the filename for the Security log: Security.evtx, located in %SystemRoot%System32WinevtLogs. That is where you would go to configure NTFS permissions. Just remember that by default, this file inherits its permissions from the parent folder. File integrity is also important when securing log files. Encrypting the log files through the concept known as hashing is a good way to verify the integrity of the log files if they are moved and/or copied. And finally, you could flat-out encrypt the entire contents of the file so that other users cannot view it. We talk more about hashing and encryption in Chapter 14, “Encryption and Hashing Concepts,” and Chapter 15, “PKI and Encryption Protocols."
Auditing System Security Settings
So far, we have conducted audits on object access and log files, but we still need to audit system security settings. For example, we should review user permissions and group policies.
For user access, we are most concerned with shared folders on the network and their permissions. Your file server (or distributed file system server) can easily show you all the shares it contains. This knowledge can be obtained on a Windows Server by navigating to Computer Management > System Tools > Shared Folders > Shares, as shown in Figure 13-12.
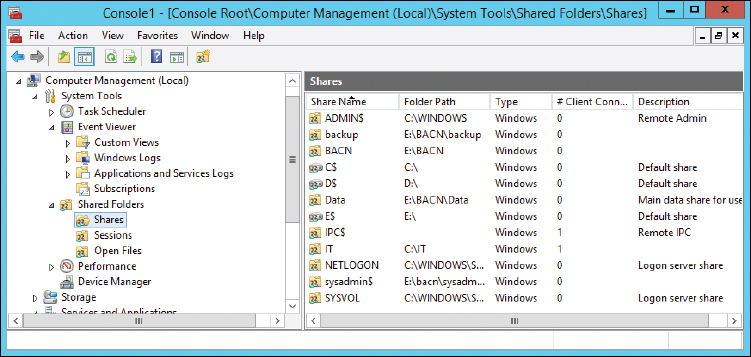
Notice the IT share. There are a couple of things that pique my interest from the get-go. For starters, the shared folder is located in the C: drive of this server. Shared folders should actually be on a different partition, drive, or even a different computer. Second, it is in the root. That isn’t a good practice either (blame the author). Of course, this is just a test folder that we created previously, but we should definitely consider the location of our shared folders.
Note
Some companies opt to secure administrative shares, such as IPC$ and ADMIN$. Although this isn’t actually an option on servers, it is a smart idea for client computers.
Either way, we now know where the IT share is located and can go to that folder’s properties and review the permissions for it, as shown in Figure 13-13.
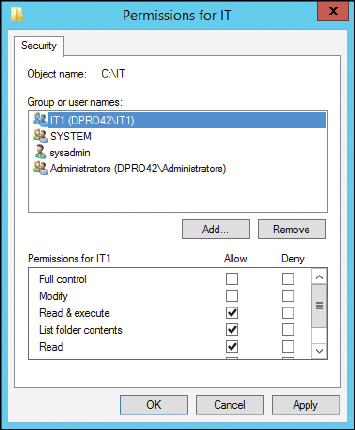
In the figure, you can see that the IT1 group has Read & Execute, List Folder Contents, and Read permissions. It is wise to make sure that individual users and groups of users do not have more permissions than necessary, or allowed. It is also important to verify proper ownership of the folder; in this example, it can be done by clicking the Advanced button within the IT Properties dialog box. Figure 13-14 shows that sysadmin is the owner of this resource. We want to make sure that no one else has inadvertently or maliciously taken control.
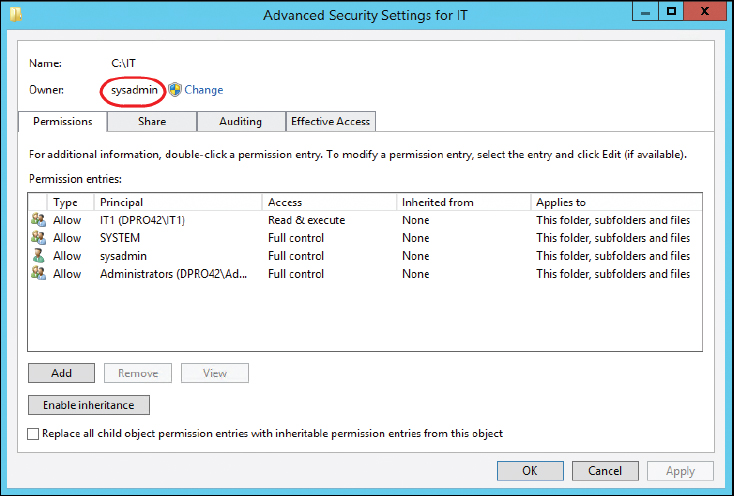
While you are in the Advanced Security Settings dialog box, you can check what auditing settings have been implemented and whether they correspond to an organization’s written policies.
Speaking of policies, computer policies should be reviewed as well. Remember that there might be different policies for each department in an organization. This would match up with the various organizational units on a Windows Server. Figure 13-15 shows the Security Settings section of the Marketing-Policy we created in Chapter 5, “Application Security." I haven’t counted them, but there are probably thousands of settings. Due to this, an organization might opt to use a security template; if this is the case, verify that the proper one is being used, and that the settings included in that template take into account what the organization has defined as part of its security plan. Templates are accessed by right-clicking Security Settings and selecting Import Policy. If a template is not being used, you will need to go through as many policy objects as possible, especially things such as password policy, security options, and the audit policy itself.

Individual computers will probably use User Account Control and adhere to the policies created on the server. A spot check should be made of individual computers to verify that they are playing by the rules. In some cases, an organization will require that all client computers are checked. Auditing can be a lot of work, so plan your time accordingly, and be ready for a few hiccups along the way.
SIEM
Your security monitoring can be augmented by using a security information and event management (SIEM) solution. SIEM products combine security event management and security information management. Products such as HPE’s ArcSight and IBM’s QRadar offer real-time monitoring of systems and logs, and automation in the form of alerts and triggers. Some of the capabilities of a SIEM solution include: data aggregation, which can combine data from network devices, servers and applications; correlation engines, which automatically look for common attributes of events across the various monitored platforms; compliance with government regulatory auditing processes; and forensic analysis. SIEM also includes WORM functionality so that information once written, cannot be modified. When correlating data, it provides for automatic deduplication, or the elimination of redundant data. It may also include scanning for configuration compliance, also known as configuration compliance manager functionality.
Chapter Summary
In the previous chapter we discussed treating your IT infrastructure as more of an entity, and less of a collection of technologies. That philosophy of the synergy between man and computer is nothing novel—the idea dates back to John von Neumann. But the extension of this synergy between disparate IT systems—and the security administrators that protect them—is an outlook that is being applied by more and more IT professionals.
Protect is the key word here. To do so effectively means to apply hands-on, continuous monitoring that: enables an already secure organization to assess weaknesses in real-time; tracks the growth of the IT infrastructure; and provides a glimpse of what is to be. But then there is also the Monday morning quarterbacking, the investigation of negative occurrences, the reference to historical anomalies—in short, the auditing of the IT infrastructure. It’s that interpretive digging into the past, coupled with protective monitoring, that can ensure the stability of an IT infrastructure.
Now we can wax poetic until we are blue in the face, but all the pontification in the world won’t provide the hands-on execution required to meticulously, and methodically, defend the IT environment. For example, it’s the IDS/IPS solutions that will provide you with actual statistics concerning the behavior of data, and any anomalies that may present themselves. It’s the concrete baselining with tools such as Performance Monitor and Wireshark that supplies analytics about the health of your servers and the types of data passing through them.
There is a myriad of other analytical tools at your disposal. The command-line included with each type of operating system has a huge variety of utilities that can bestow the bulk of the answers you are looking for about your computers. Plus, there are seemingly countless third-party applications available—some free, and some for a fee—that can help to fill any knowledge gaps about your computer network.
The detective in you will require periodic audits. In some cases, an organization requires that this be done by an independent consultant. However, your honor will probably require that you conduct occasional audits as well. Review your ACLs, permissions, and policies. But especially, keep a watchful eye on your security logs. These are some of the most important analytics that you will possess. They explain who did what and when it occurred (and possibly why). Define strong auditing policies, implement them, enforce them, review them often, and back them up.
Finally, we made mention of the von Neumann mindset. As IT infrastructures become more complex, and data gets “bigger,” and computers become “smarter,” this ideal becomes all the more vital. I’m not saying to pat the server on the back and tell it everything is going to be okay, but rather provide your IT infrastructure with a sort of compassion that will nurture it and help it to grow. You may say: “Dave, it sounds like you treat your computer networks almost as if they are living beings!" Is that so strange? Is AI so far away? Time will tell. As of the writing of this book (2017) there are learning algorithms, self-healing servers and networks, super-computers such as Watson and Titan, and advances in robotics that were unimaginable just a decade ago. Besides, many of the geeks out there (and I use that term with high regard) do indeed already treat their servers—even entire IT environments—like pets or even friends. And so, that compassion manifests itself in the form of robust monitoring and scrupulous auditing. That is the way to the goal of providing the highest level of protection possible.
Chapter Review Activities
Use the features in this section to study and review the topics in this chapter.
Review Key Topics
Review the most important topics in the chapter, noted with the Key Topic icon in the outer margin of the page. Table 13-2 lists a reference of these key topics and the page number on which each is found.
Table 13-2 Key Topics for Chapter 13
Key Topic Element |
Description |
Page Number |
Summary of monitoring methodologies |
||
Performance Monitor in Windows |
||
Wireshark showing a captured TLS Version 1.0 packet |
||
Captured FTP packet with clear-text password |
||
Audit Policy within the Local Computer Policy of a Windows computer |
||
Security log in Windows |
||
Syslog program running in Windows |
||
Windows Server Security Log Properties dialog box |
Define Key Terms
Define the following key terms from this chapter, and check your answers in the glossary:
signature-based monitoring, anomaly-based monitoring, behavior-based monitoring, baselining, baseline reporting, security posture, security posture assessment (SPA), promiscuous mode, non-promiscuous mode, broadcast storm, port mirroring, Simple Network Management Protocol (SNMP), computer security audits, audit trail
Complete the Real-World Scenarios
Complete the Real-World Scenarios found on the companion website (www.pearsonitcertification.com/title/9780789758996). You will find a PDF containing the scenario and questions, and also supporting videos and simulations.
Review Questions
Answer the following review questions. Check your answers with the correct answers that follow.
1. Which of the following is a record of the tracked actions of users?
A. Performance Monitor
B. Audit trails
C. Permissions
D. System and event logs
2. What tool can alert you if a server’s processor trips a certain threshold?
A. TDR
B. Password cracker
C. Event Viewer
D. Performance Monitor
3. The IT director has asked you to install agents on several client computers and monitor them from a program at a server. What is this known as?
A. SNMP
B. SMTP
C. SMP
D. Performance Monitor
4. One of your co-workers complains to you that he cannot see any security events in the Event Viewer. What are three possible reasons for this? (Select the three best answers.)
A. Auditing has not been turned on.
B. The log file is only 10 MB.
C. The co-worker is not an administrator.
D. Auditing for an individual object has not been turned on.
5. Which tool can be instrumental in capturing FTP GET requests?
A. Vulnerability scanner
B. Port scanner
C. Performance Monitor
D. Protocol analyzer
6. Your manager wants you to implement a type of intrusion detection system (IDS) that can be matched to certain types of traffic patterns. What kind of IDS is this?
A. Anomaly-based IDS
B. Signature-based IDS
C. Behavior-based IDS
D. Inline IDS
7. You are setting up auditing on a Windows computer. If set up properly, which log should have entries?
A. Application log
B. System log
C. Security log
D. Maintenance log
8. You have established a baseline for your server. Which of the following is the best tool to use to monitor any changes to that baseline?
A. Performance Monitor
B. Anti-spyware
C. Antivirus software
D. Vulnerability assessments software
9. In what way can you gather information from a remote printer?
A. HTTP
B. SNMP
C. CA
D. SMTP
10. Which of the following can determine which flags are set in a TCP/IP handshake?
A. Protocol analyzer
B. Port scanner
C. SYN/ACK
D. Performance Monitor
11. Which of following is the most basic form of IDS?
A. Anomaly-based
B. Behavioral-based
C. Signature-based
D. Statistical-based
12. Which of the following deals with the standard load for a server?
A. Patch management
B. Group Policy
C. Port scanning
D. Configuration baseline
13. Your boss wants you to properly log what happens on a database server. What are the most important concepts to think about while you do so? (Select the two best answers.)
A. The amount of virtual memory that you will allocate for this task
B. The amount of disk space you will require
C. The information that will be needed to reconstruct events later
D. Group Policy information
14. Which of the following is the best practice to implement when securing logs files?
A. Log all failed and successful login attempts.
B. Deny administrators access to log files.
C. Copy the logs to a remote log server.
D. Increase security settings for administrators.
15. What is the main reason to frequently view the logs of a DNS server?
A. To create aliases
B. To watch for unauthorized zone transfers
C. To defend against denial-of-service attacks
D. To prevent domain name kiting
16. As you review your firewall log, you see the following information. What type of attack is this?
S=207.50.135.54:53 - D=10.1.1.80:0
S=207.50.135.54:53 - D=10.1.1.80:1
S=207.50.135.54:53 - D=10.1.1.80:2
S=207.50.135.54:53 - D=10.1.1.80:3
S=207.50.135.54:53 - D=10.1.1.80:4
S=207.50.135.54:53 - D=10.1.1.80:5
A. Denial-of-service
B. Port scanning
C. Ping scanning
D. DNS spoofing
17. Of the following, which two security measures should be implemented when logging a server? (Select the two best answers.)
A. Cyclic redundancy checks
B. The application of retention policies on log files
C. Hashing of log files
D. Storing of temporary files
18. You suspect a broadcast storm on the LAN. Which tool is required to diagnose which network adapter is causing the storm?
A. Protocol analyzer
B. Firewall
C. Port scanner
D. Network intrusion detection system
E. Port mirror
19. Which of the following should be done if an audit recording fails?
A. Stop generating audit records.
B. Overwrite the oldest audit records.
C. Send an alert to the administrator.
D. Shut down the server.
20. Which of the following log files should show attempts at unauthorized access?
A. DNS
B. System
C. Application
D. Security
21. To find out when a computer was shut down, which log file would an administrator use?
A. Security
B. System
C. Application
D. DNS
22. Which of the following requires a baseline? (Select the two best answers.)
A. Behavior-based monitoring
B. Performance Monitor
C. Anomaly-based monitoring
D. Signature-based monitoring
23. Jason is a security administrator for a company of 4000 users. He wants to store 6 months of security logs to a logging server for analysis. The reports are required by upper management due to legal obligations but are not time-critical. When planning for the requirements of the logging server, which of the following should not be implemented?
A. Performance baseline and audit trails
B. Time stamping and integrity of the logs
C. Log details and level of verbose logging
D. Log storage and backup requirements
24. One of the developers in your organization installs a new application in a test system to test its functionality before implementing into production. Which of the following is most likely affected?
A. Application security
B. Initial baseline configuration
C. Application design
D. Baseline comparison
25. Michael has just completed monitoring and analyzing a web server. Which of the following indicates that the server might have been compromised?
A. The web server is sending hundreds of UDP packets.
B. The web server has a dozen connections to inbound port 80.
C. The web server has a dozen connections to inbound port 443.
D. The web server is showing a drop in CPU speed and hard disk speed.
26. What kind of security control do computer security audits fall under?
A. Detective
B. Preventive
C. Corrective
D. Protective
27. You have been alerted to suspicious traffic without a specific signature. Under further investigation, you determine that the alert was a false indicator. Furthermore, the same alert has arrived at your workstation several times. Which security device needs to be configured to disable false alarms in the future? (Select the best answer.)
A. Anomaly-based IDS
B. Signature-based IPS
C. Signature-based IDS
D. UTM
E. SIEM
28. You have been tasked with providing daily network usage reports of layer 3 devices without compromising any data during the information gathering process. Which of the following protocols should you select to provide for secure reporting in this scenario?
A. ICMP
B. SNMP
C. SNMPv3
D. SSH
29. Which of the following techniques enables an already secure organization to assess security vulnerabilities in real time?
A. Baselining
B. ACLs
C. Continuous monitoring
D. Video surveillance
30. Which of the following protocols are you observing in the packet capture below?
16:42:01 – SRC 192.168.1.5:3389 – DST 10.254.254.57:8080 – SYN/ACK
A. HTTP
B. HTTPS
C. RDP
D. SFTP
Answers and Explanations
1. B. Audit trails are records showing the tracked actions of users. Performance Monitor is a tool in Windows that enables you to track the performance of objects such as CPU, RAM, network adapter, physical disk, and so on. Permissions grant or deny access to resources. To see whether permissions were granted, auditing must be enabled. The System log and other logs record events that happened in other areas of the system—for example, events concerning the operating system, drivers, applications, and so on.
2. D. Performance Monitor can be configured in such a way that alerts can be set for any of the objects (processor, RAM, paging file) in a computer. For example, if the processor were to go beyond 90% usage for more than 1 minute, an alert would be created and could be sent automatically to an administrator. A TDR is a time-domain reflectometer, an electronic instrument used to test cables for faults. A password cracker is a software program used to recover or crack passwords; an example would be Cain & Abel. The Event Viewer is a built-in application in Windows that enables a user to view events on the computer such as warnings, errors, and other information events. It does not measure the objects in a server in the way that Performance Monitor does.
3. A. SNMP (Simple Network Management Protocol) is used when a person installs agents on client computers to monitor those systems from a single remote location. SMTP is used by e-mail clients and servers. SMP is symmetric multiprocessing, which is not covered in the Security+ exam objectives. Performance Monitor enables a person to monitor a computer and create performance baselines.
4. A, C, and D. To audit events on a computer, an administrator would need to enable auditing within the computer’s policy, then turn on auditing for an individual object (folder, file, and so on), and then view the events within the Security log of the Event Viewer. The size of the log file won’t matter in this case—aside from events being overwritten. However, the person should still be able to see some events if all the other criteria have been met because 10 MB is big enough for many events to be written to it.
5. D. A protocol analyzer captures data including things such as GET requests that were initiated from an FTP client. Vulnerability scanners and port scanners look for open ports and other vulnerabilities of a host. Performance Monitor is a Windows program that reports on the performance of the computer system and any of its parts.
6. B. When using an IDS, particular types of traffic patterns refer to signature-based IDS. Anomaly-based and behavior-based systems use different methodologies. Inline IDS means that the device exists on the network (often between a firewall and the Internet) and directly receives packets and forwards those packets to the intended destination.
7. C. After auditing is turned on and specific resources are configured for auditing, you need to check the Event Viewer’s Security log for the entries. These could be successful logons or misfired attempts at deleting files; there are literally hundreds of options. The Application log contains errors, warnings, and informational entries about applications. The System log deals with drivers, system files, and so on. A System Maintenance log can be used to record routine maintenance procedures.
8. A. Performance monitoring software can be used to create a baseline and monitor for any changes to that baseline. An example of this would be the Performance console window within Windows Server. (It is commonly referred to as Performance Monitor.) Antivirus and anti-spyware applications usually go hand-in-hand and are not used to monitor server baselines. Vulnerability assessing software such as Nessus or Nmap is used to see whether open ports and other vulnerabilities are on a server.
9. B. SNMP (Simple Network Management Protocol) enables you to gather information from a remote printer. HTTP is the Hypertext Transfer Protocol that deals with the transfer of web pages. A CA is a certificate authority, and SMTP is the Simple Mail Transfer Protocol.
10. A. A protocol analyzer can look inside the packets that make up a TCP/IP handshake. Information that can be viewed includes SYN, which is synchronize sequence numbers, and ACK, which is acknowledgment field significant. Port scanners and Performance Monitor do not have the capability to view flags set in a TCP/IP handshake, nor can they look inside packets in general.
11. C. Signature-based IDS is the most basic form of intrusion detection system, or IDS. This monitors packets on the network and compares them against a database of signatures. Anomaly-based, behavioral-based, and statistical-based are all more complex forms of IDS. Anomaly-based and statistical-based are often considered to be the same type of monitoring methodology.
12. D. A configuration baseline deals with the standard load of a server. By measuring the traffic that passes through the server’s network adapter, you can create a configuration baseline over time.
13. B and C. It is important to calculate how much disk space you will require for the logs of your database server and verify that you have that much disk space available on the hard drive. It is also important to plan what information will be needed in the case that you need to reconstruct events later. Group Policy information and virtual memory are not important for this particular task.
14. C. It is important to copy the logs to a secondary server in case something happens to the primary log server; this way you have another copy of any possible security breaches. Logging all failed and successful login attempts might not be wise, because it will create many entries. The rest of the answers are not necessarily good ideas when working with log files.
15. B. Security administrators should frequently view the logs of a DNS server to monitor any unauthorized zone transfers. Aliases are DNS names that redirect to a hostname or FQDN. Simply viewing the logs of a DNS server will not defend against denial-of-service attacks. Domain name kiting is the process of floating a domain name for up to five days without paying for the domain name.
16. B. The information listed is an example of a port scan. The source IP address perpetuating the port scan should be banned or blocked on the firewall. The fact that the source computer is using port 53 is of no consequence during the port scan and does not imply DNS spoofing. It is not a denial-of-service attack; note that the destination IP address ends in 80, but the number 80 is part of the IP address and is not the port.
17. B and C. The log files should be retained in some manner either on this computer or on another computer. By hashing the log files, the integrity of the files can be checked even after they are moved. Cyclic redundancy checks, or CRCs, have to deal with the transmission of Ethernet frames over the network. Temporary files are normally not necessary when dealing with log files.
18. A. A protocol analyzer should be used to diagnose which network adapter on the LAN is causing the broadcast storm. It is also useful for detecting flooding attacks and fragmented packets. A firewall cannot diagnose attacks perpetuated on a network. A port scanner is used to find open ports on one or more computers. A network intrusion detection system (NIDS) is implemented to locate and possibly quarantine some types of attacks but will not be effective when it comes to broadcast storms. A port mirror copies all packets from one or more ports to the monitoring port. It is preferred if you are doing a diagnosis of a broadcast storm, but it is not required, and may not even be possible in some cases.
19. C. If an audit recording fails, there should be sufficient safeguards employed that can automatically send an alert to the administrator, among other things. Audit records should not be overwritten and in general should not be stopped.
20. D. The Security log file should show attempts at unauthorized access to a Windows computer. The Application log file deals with events concerning applications within the operating system and some third-party applications. The System log file deals with drivers, system files, and so on. A DNS log will log information concerning the domain name system.
21. B. The System log will show when a computer was shut down (and turned on, for that matter, or restarted). The Security log shows any audited information on a computer system. The Application log deals with OS apps and third-party apps. The DNS log shows events that have transpired on a DNS server.
22. A and C. Behavior-based monitoring and anomaly-based monitoring require creating a baseline. Many host-based IDS systems will monitor parts of the dynamic behavior and the state of the computer system. An anomaly-based IDS will classify activities as either normal or anomalous; this will be based on rules instead of signatures. Both behavior-based and anomaly-based monitoring require a baseline to make a comparative analysis. Signature-based monitoring systems do not require this baseline because they are looking for specific patterns or signatures and are comparing them to a database of signatures. Performance Monitor can be used to create a baseline on Windows computers, but it does not necessarily require a baseline.
23. A. A performance baseline and audit trails are not necessarily needed. Security logs are usually not performance-oriented. For example, you might get this list from a Windows Server’s Security log in the Event Viewer. Auditing this much information could be unfeasible for one person. However, it is important to implement time stamping of the logs and store log details. Before implementing the logging server, Jason should check whether he has enough storage and backup space to meet his requirements.
24. B. The initial baseline configuration is most likely affected. Because the application has just been installed, there is only an initial baseline, but no other baselines to yet compare with. Since it is a testing environment, and the developer has just installed the application, security is not a priority. The developer probably wants to see what makes the application tick, and possibly reverse engineer it, but is not yet at the stage of application design, and probably won’t be until a new application or modification of the current application is designed.
25. D. If the web server is showing a drop in processor and hard disk speed, it might have been compromised. Further analysis and comparison to a pre-existing baseline would be necessary. All the other answers are common for a web server.
26. A. A computer security audit is an example of a detective security control. If a security administrator found that a firewall was letting unauthorized ICMP echoes into the network, the administrator might close the port on the firewall—a corrective control, and for the future, a preventive control. The term protective control is not generally used in security circles as it is a somewhat ambiguous term.
27. A. Most likely, the anomaly-based IDS needs to be reconfigured. It is alerting you to legitimate traffic, which amounts to false positives. These are not actually anomalies. If the traffic being analyzed has no specific signature (or known signature), then a signature-based IDS or IPS will not be able to identify it as legitimate or illegitimate. A UTM is a unified threat management device. This device may or may not have an IDS or IPS, and even then, it may or may not be capable of anomaly-based analysis, so it is not as likely an answer as the anomaly-based IDS. SIEM stands for security information and event management, and comes in the form of a software product or service or an appliance; it deals with real-time monitoring.
28. C. SNMPv3 should be used because it provides a higher level of security (encryption of packets, message integrity, and authentication), allowing you to gather information without fear of the data being compromised. SNMPv1 and v2 do not have the elaborate security of SNMPv3. ICMP is the Internet Control Message Protocol used with the ping utility, among other things. It has little to do with monitoring. SSH is Secure Shell, which is a more secure way of remotely controlling systems; it acts as a secure alternative to Telnet.
29. C. Continuous monitoring will help an already secure organization to assess security vulnerabilities and weaknesses in real time. Baselining and ACLs are things that have happened, or were configured in the past. Video surveillance is surely in real time, but it is doubtful as to whether it can assess security vulnerabilities in real time, even if someone is watching the video stream as it happens.
30. C. You are observing a Remote Desktop Protocol (RDP) acknowledgement packet. You can tell because the source IP address (192.168.1.5) is using port 3389, the default port for RDP, and is sending the ACK to 10.254.254.57 (which was connecting on the secondary HTTP port 8080). So the client is using an HTTP port, but that is inconsequential because the packet is being generated by the source (SRC) IP. HTTPS (port 443) is not involved in this packet capture. Neither is SFTP, as it rides on SSH using port 22.