Chapter 29. Introduction to Automation Tools
This chapter covers the following subjects:
Embedded Event Manager (EEM): This section illustrates common use cases and operations of the on-box EEM automation tool as well as the Tcl scripting engine.
Agent-Based Automation Tools: This section examines the benefits and operations of the various agent-based automation tools.
Agentless Automation Tools: This section examines the benefits and operations of the various agentless automation tools.
This chapter is intended to provide a high-level overview of some of the most common configuration management and automation tools that are available. This chapter also discusses some on-box tools and describes some common programmatic methods of management.
“Do I Know This Already?” Quiz
The “Do I Know This Already?” quiz allows you to assess whether you should read the entire chapter. If you miss no more than one of these self-assessment questions, you might want to move ahead to the “Exam Preparation Tasks” section. Table 29-1 lists the major headings in this chapter and the “Do I Know This Already?” quiz questions covering the material in those headings so you can assess your knowledge of these specific areas. The answers to the “Do I Know This Already?” quiz appear in Appendix A, “Answers to the ‘Do I Know This Already?’ Quiz Questions.”
Table 29-1 “Do I Know This Already?” Foundation Topics Section-to-Question Mapping
Foundations Topics Section |
Questions |
Embedded Event Manager (EEM) |
1 |
Agent-Based vs. Agentless Management Tools |
11 |
Agentless Automation Tools |
2 |
Ansible |
3, 5, 8–10 |
SaltStack (Agent and Server Mode) |
4 |
Chef |
6 |
Puppet |
7 |
1. True or false: Configuring network components by using the CLI is considered the fastest approach when dealing with a large number of devices.
True
False
2. Which of these tools are agentless in operation? (Choose three.)
Ansible
Puppet Bolt
SaltStack
Chef
Salt SSH
3. Which of the following are features of Ansible? (Choose two.)
Manifests
Modules
Playbooks
Tasks
Recipes
4. What configuration management software is built on Python? (Choose two.)
Ansible
Chef
Puppet
SaltStack
5. Which of the following is a YAML example?
{
  "user": "root",
  "user": "Jason",
  "user": "Jamie",
  "user": "Luke"
}
# HR Employee record Employee1: Name: John Dough Title: Developer Nickname: Mr. DBugroot Jason Jamie Luke
[users[root|Jason|Jamie|Luke]]
6. What is the language associated with Chef?
Python
C++
Ruby
Q-Basic
Tcl
7. What are some of the benefits of Puppet Forge and GitHub? (Choose all that apply.)
Keeping track of various versions of code
Knowing which developers are involved with code revisions
Collaborating with other developers and sharing code
Increasing the speed in working on software projects
Accessing a real-time telemetry software database
Automatically blocking malicious code
8. What are the PPDIOO lifecycle components?
Prepare, Plan, Design, Implement, Observe, Optimize
Prepare, Plan, Design, Implement, Operate, Optimize
Prepare, Plan, Design, Implement, Operate, Optimize
Plan, Prepare, Design, Implement, Observe, Optimize
Prepare, Plan, Design, Integrate, Observe, Optimize
9. Ansible uses the TAML syntax, which starts with three dashes (---), in the creation of playbook files.
True
False
10. What is the proper command to execute a playbook using Ansible?
ansible-playbook ConfigureInterface.yaml
ansible ConfigureInterface.yaml
play ansible-book ConfigureInterface.yaml
play ansible-book ConfigureInterface.taml
11. Which of these tools are agent-based in operation? (Choose two.)
Ansible
Puppet Bolt
SaltStack
Chef
Salt SSH
Answers to the “Do I Know This Already?” quiz:
1 B
2 A, B, E
3 C, D
4 A, D
5 B
6 C
7 A, B, C, D
8 B
9 B
10 A
11 B, C
Foundation Topics
Embedded Event Manager
Embedded Event Manager (EEM) is a very flexible and powerful Cisco IOS tool. EEM allows engineers to build software applets that can automate many tasks. EEM also derives some of its power from the fact that it enables you to build custom scripts using Tcl. Scripts can automatically execute, based on the output of an action or an event on a device. One of the main benefits of EEM is that it is all contained within the local device. There is no need to rely on an external scripting engine or monitoring device in most cases. Figure 29-1 illustrates some of the EEM event detectors and how they interact with the IOS subsystem.

Figure 29-1 EEM Event Detectors
EEM Applets
EEM applets are composed of multiple building blocks. This chapter focuses on two of the primary building blocks that make up EEM applets: events and actions.
EEM applets use a similar logic to the if-then statements used in some of the common programming languages (for instance, if an event happens, then an action is taken). The following example illustrates a very common EEM applet that is monitoring syslog messages on a router.
Example 29-1 shows an applet that is looking for a specific syslog message, stating that the Loopback0 interface went down. The specific syslog message is matched using regular expressions. This is a very powerful and granular way of matching patterns. If this specific syslog pattern is matched (an event) at least once, then the following actions will be taken:
The Loopback0 interface will be shut down and brought back up (because of shutdown and no shutdown).
The router will generate a syslog message that says, “I’ve fallen, and I can’t get up!”
An email message that includes the output of the show interface loopback0 command will be sent to the network administrator.
Example 29-1 Syslog Applet Example
event manager applet LOOP0 event syslog pattern "Interface Loopback0.* down" period 1 action 1.0 cli command "enable" action 2.0 cli command "config terminal" action 3.0 cli command "interface loopback0" action 4.0 cli command "shutdown" action 5.0 cli command "no shutdown" action 5.5 cli command "show interface loopback0" action 6.0 syslog msg "I've fallen, and I can't get up!" action 7.0 mail server 10.0.0.25 to [email protected] from [email protected] subject "Loopback0 Issues!" body "The Loopback0 interface was bounced. Please monitor accordingly. "$_cli_result"
Based on the output from the debug event manager action cli command, you can see the actions taking place when the applet is running. Example 29-2 shows the applet being engaged when a user issues the shutdown command on the Loopback0 interface. It also shows that an error occurred when trying to connect to the SMTP server to send the email to the administrator. This is because the SMTP server being used for this test is not configured. Notice that because the $_cli_result keyword was used in the configuration, the output will include the output of any CLI commands that were issued in the applet. In this case, the output of the show interface loopback0 command will be included in the debugging and in the email message.
Example 29-2 Debugging Output of an Event Manager Action
Switch# Switch# configure terminal Enter configuration commands, one per line. End with CNTL/Z. Switch(config)# interface loopback0 Switch(config-if)# shutdown Switch(config-if)# 17:21:59.214: %LINK-5-CHANGED: Interface Loopback0, changed state to administratively down 17:21:59.217: %HA_EM-6-LOG: LOOP0 : DEBUG(cli_lib) : : CTL : cli_open called. 17:21:59.221: %HA_EM-6-LOG: LOOP0 : DEBUG(cli_lib) : : OUT : Switch> 17:21:59.221: %HA_EM-6-LOG: LOOP0 : DEBUG(cli_lib) : : IN : Switch>enable 17:21:59.231: %HA_EM-6-LOG: LOOP0 : DEBUG(cli_lib) : : OUT : Switch# 17:21:59.231: %HA_EM-6-LOG: LOOP0 : DEBUG(cli_lib) : : IN : Switch#show interface loopback0 17:21:59.252: %HA_EM-6-LOG: LOOP0 : DEBUG(cli_lib) : : OUT : Loopback0 is administratively down, line protocol is down 17:21:59.252: %HA_EM-6-LOG: LOOP0 : DEBUG(cli_lib) : : OUT : Hardware is Loopback 17:21:59.252: %HA_EM-6-LOG: LOOP0 : DEBUG(cli_lib) : : OUT : MTU 1514 bytes, BW 8000000 Kbit/sec, DLY 5000 usec, 17:21:59.252: %HA_EM-6-LOG: LOOP0 : DEBUG(cli_lib) : : OUT : reliability 255/255, txload 1/255, rxload 1/255 17:21:59.252: %HA_EM-6-LOG: LOOP0 : DEBUG(cli_lib) : : OUT : Encapsulation LOOPBACK, loopback not set 17:21:59.252: %HA_EM-6-LOG: LOOP0 : DEBUG(cli_lib) : : OUT : Keepalive set (10 sec) 17:21:59.252: %HA_EM-6-LOG: LOOP0 : DEBUG(cli_lib) : : OUT : Last input never, output never, output hang never 17:21:59.252: %HA_EM-6-LOG: LOOP0 : DEBUG(cli_lib) : : OUT : Last clearing of "show interface" counters never 17:21:59.252: %HA_EM-6-LOG: LOOP0 : DEBUG(cli_lib) : : OUT : Input queue: 0/75/0/0 (size/max/drops/flushes); Total output drops: 0 17:21:59.252: %HA_EM-6-LOG: LOOP0 : DEBUG(cli_lib) : : OUT : Queueing strategy: fifo 17:21:59.252: %HA_EM-6-LOG: LOOP0 : DEBUG(cli_lib) : : OUT : Output queue: 0/0 (size/max) 17:21:59.252: %HA_EM-6-LOG: LOOP0 : DEBUG(cli_lib) : : OUT : 5 minute input rate 0 bits/sec, 0 packets/sec 17:21:59.252: %HA_EM-6-LOG: LOOP0 : DEBUG(cli_lib) : : OUT : 5 minute output rate 0 bits/sec, 0 packets/sec 17:21:59.252: %HA_EM-6-LOG: LOOP0 : DEBUG(cli_lib) : : OUT : 0 packets input, 0 bytes, 0 no buffer 17:21:59.252: %HA_EM-6-LOG: LOOP0 : DEBUG(cli_lib) : : OUT : Received 0 broadcasts (0 IP multicasts) 17:21:59.252: %HA_EM-6-LOG: LOOP0 : DEBUG(cli_lib) : : OUT : 0 runts, 0 giants, 0 throttles 17:21:59.252: %HA_EM-6-LOG: LOOP0 : DEBUG(cli_lib) : : OUT : 0 input errors, 0 CRC, 0 frame, 0 overrun, 0 ignored, 0 abort 17:21:59.252: %HA_EM-6-LOG: LOOP0 : DEBUG(cli_lib) : : OUT : 0 packets output, 0 bytes, 0 underruns 17:21:59.252: %HA_EM-6-LOG: LOOP0 : DEBUG(cli_lib) : : OUT : 0 output errors, 0 collisions, 0 interface resets 17:21:59.252: %HA_EM-6-LOG: LOOP0 : DEBUG(cli_lib) : : OUT : 0 unknown protocol drops 17:21:59.252: %HA_EM-6-LOG: LOOP0 : DEBUG(cli_lib) : : CTL : 20+ lines read from cli, debug output truncated 17:21:59.252: %HA_EM-6-LOG: LOOP0 : DEBUG(cli_lib) : : IN : Switch#config terminal 17:21:59.266: %HA_EM-6-LOG: LOOP0 : DEBUG(cli_lib) : : OUT : Enter configuration commands, one per line. End with CNTL/Z. 17:21:59.266: %HA_EM-6-LOG: LOOP0 : DEBUG(cli_lib) : : OUT : Switch(config)# 17:21:59.266: %HA_EM-6-LOG: LOOP0 : DEBUG(cli_lib) : : IN : Switch(config)#interface loopback0 17:21:59.277: %HA_EM-6-LOG: LOOP0 : DEBUG(cli_lib) : : OUT : Switch(config-if)# 17:21:59.277: %HA_EM-6-LOG: LOOP0 : DEBUG(cli_lib) : : IN : Switch(config-if) #shutdown 17:21:59.287: %HA_EM-6-LOG: LOOP0 : DEBUG(cli_lib) : : OUT : Switch(config-if)# 17:21:59.287: %HA_EM-6-LOG: LOOP0 : DEBUG(cli_lib) : : IN : Switch(config-if)#no shutdown 17:21:59.298: %HA_EM-6-LOG: LOOP0 : DEBUG(cli_lib) : : OUT : Switch(config-if)# 17:21:59.298: %HA_EM-6-LOG: LOOP0: I've fallen and I can't get up! 17:22:01.293: %LINK-3-UPDOWN: Interface Loopback0, changed state to up 17:22:11.314: %HA_EM-3-FMPD_SMTP: Error occurred when sending mail to SMTP server: 10.0.0.25 : error in connecting to SMTP server 17:22:11.314: %HA_EM-3-FMPD_ERROR: Error executing applet LOOP0 statement 7.0 17:22:11.314: %HA_EM-6-LOG: LOOP0 : DEBUG(cli_lib) : : CTL : cli_close called.
Another very useful aspect of EEM applets is that CLI patterns can be matched as an event. This means that when certain commands are entered into the router using the CLI, they can trigger an EEM event within an applet. Then the configured actions can take place as a result of the CLI pattern being matched. Example 29-3 uses another common EEM applet to match the CLI pattern “write mem.”. When the applet is triggered, the following actions are invoked:
The router generates a syslog message that says “Configuration File Changed! TFTP backup successful.”
The startup-config file is copied to a TFTP server.
Example 29-3 WR MEM Applet
event manager environment filename Router.cfg event manager environment tftpserver tftp://10.1.200.29/ event manager applet BACKUP-CONFIG event cli pattern "write mem.*" sync yes action 1.0 cli command "enable" action 2.0 cli command "configure terminal" action 3.0 cli command "file prompt quiet" action 4.0 cli command "end" action 5.0 cli command "copy start $tftpserver$filename" action 6.0 cli command "configure terminal" action 7.0 cli command "no file prompt quiet" action 8.0 syslog priority informational msg "Configuration File Changed! TFTP backup successful."
As shown in the previous examples, there are multiple ways to call out specific EEM environment values. The first example illustrates that it’s possible for a user to use a single line to configure the mail environment and send messages with CLI output results. Using the EEM environment variables shown in the second example, users can statically set different settings that can be called on from multiple actions instead of calling them out individually on a single line. Although it is possible to create custom names and values that are arbitrary and can be set to anything, it is good practice to use common and descriptive variables. Table 29-2 lists some of the email variables most commonly used in EEM.
Table 29-2 Common EEM Email Variables
EEM Variable |
Description |
Example |
_email_server |
SMTP server IP address or DNS name |
10.0.0.25 or MAILSVR01 |
_email_to |
Email address to send email to |
|
_email_from |
Email address of sending party |
|
_email_cc |
Email address of additional email receivers |
EEM and Tcl Scripts
Using an EEM applet to call Tcl scripts is another very powerful aspect of EEM. This chapter has covered multiple ways to use EEM applets. You have already seen multiple ways of executing actions, based on the automatic detection of specific events while they are happening. In this section, the focus is on how to call a Tcl script from an EEM applet.
Example 29-4 shows how to manually execute an EEM applet that, in turn, executes a Tcl script that is locally stored in the device’s flash memory. It is important to understand that there are many different ways to use EEM and that manually triggered applets are also very useful tools. Example 29-4 shows an EEM script configured with the event none command, which means there is no automatic event that the applet is monitoring, and this applet runs only when it is triggered manually. To manually run an EEM applet, the event manager run applet-name command must be used, as illustrated in the second part of the output.
Example 29-4 Manually Execute EEM Applet
event manager applet Ping event none action 1.0 cli command "enable" action 1.1 cli command "tclsh flash:/ping.tcl"
Router# event manager run Ping Router# 19:32:16.564: %HA_EM-6-LOG: Ping : DEBUG(cli_lib) : : CTL : cli_open called. 19:32:16.564: %HA_EM-6-LOG: Ping : DEBUG(cli_lib) : : OUT : Router> 19:32:16.568: %HA_EM-6-LOG: Ping : DEBUG(cli_lib) : : IN : Router>enable 19:32:16.578: %HA_EM-6-LOG: Ping : DEBUG(cli_lib) : : OUT : Router# 19:32:16.578: %HA_EM-6-LOG: Ping : DEBUG(cli_lib) : : IN : Router#tclsh flash:/ping.tcl 19:32:16.711: %HA_EM-6-LOG: Ping : DEBUG(cli_lib) : : OUT : Type escape sequence to abort. 19:32:16.711: %HA_EM-6-LOG: Ping : DEBUG(cli_lib) : : OUT : Sending 5, 100-byte ICMP Echos to 192.168.0.2, timeout is 2 seconds: 19:32:16.711: %HA_EM-6-LOG: Ping : DEBUG(cli_lib) : : OUT : !!!!! 19:32:16.711: %HA_EM-6-LOG: Ping : DEBUG(cli_lib) : : OUT : Success rate is 100 percent (5/5), round-trip min/avg/max = 1/1/4 ms 19:32:16.711: %HA_EM-6-LOG: Ping : DEBUG(cli_lib) : : OUT : Type escape sequence to abort. 19:32:16.711: %HA_EM-6-LOG: Ping : DEBUG(cli_lib) : : OUT : Sending 5, 100-byte ICMP Echos to 192.168.0.3, timeout is 2 seconds: 19:32:16.711: %HA_EM-6-LOG: Ping : DEBUG(cli_lib) : : OUT : !!!!! 19:32:16.711: %HA_EM-6-LOG: Ping : DEBUG(cli_lib) : : OUT : Success rate is 100 percent (5/5), round-trip min/avg/max = 1/1/1 ms 19:32:16.711: %HA_EM-6-LOG: Ping : DEBUG(cli_lib) : : OUT : Type escape sequence to abort. 19:32:16.711: %HA_EM-6-LOG: Ping : DEBUG(cli_lib) : : OUT : Sending 5, 100-byte ICMP Echos to 192.168.0.4, timeout is 2 seconds: 19:32:16.711: %HA_EM-6-LOG: Ping : DEBUG(cli_lib) : : OUT : !!!!! 19:32:16.711: %HA_EM-6-LOG: Ping : DEBUG(cli_lib) : : OUT : Success rate is 100 percent (5/5), round-trip min/avg/max = 1/1/3 ms 19:32:16.711: %HA_EM-6-LOG: Ping : DEBUG(cli_lib) : : OUT : Type escape sequence to abort. 19:32:16.711: %HA_EM-6-LOG: Ping : DEBUG(cli_lib) : : OUT : Sending 5, 100-byte ICMP Echos to 192.168.0.5, timeout is 2 seconds: 19:32:16.711: %HA_EM-6-LOG: Ping : DEBUG(cli_lib) : : OUT : !!!!! 19:32:16.711: %HA_EM-6-LOG: Ping : DEBUG(cli_lib) : : OUT : Success rate is 100 percent (5/5), round-trip min/avg/max = 1/1/4 ms 19:32:16.711: %HA_EM-6-LOG: Ping : DEBUG(cli_lib) : : OUT : Type escape sequence to abort. 19:32:16.711: %HA_EM-6-LOG: Ping : DEBUG(cli_lib) : : OUT : Sending 5, 100-byte ICMP Echos to 192.168.0.6, timeout is 2 seconds: 19:32:16.711: %HA_EM-6-LOG: Ping : DEBUG(cli_lib) : : OUT : !!!!! 19:32:16.711: %HA_EM-6-LOG: Ping : DEBUG(cli_lib) : : OUT : Success rate is 100 percent (5/5), round-trip min/avg/max = 1/1/1 ms 19:32:16.711: %HA_EM-6-LOG: Ping : DEBUG(cli_lib) : : CTL : 20+ lines read from cli, debug output truncated 19:32:16.711: %HA_EM-6-LOG: Ping : DEBUG(cli_lib) : : CTL : cli_close called.
For reference, Example 29-5 displays a snippet for the exact content of the ping.tcl script used in the manually triggered EEM applet in Example 29-4. To see the contents of a Tcl script that resides in flash memory, issue the more command followed by the file location and filename. The more command can be used to view all other text-based files stored in the local flash memory as well.
Example 29-5 ping.tcl Script Contents
Router# more flash:ping.tcl
foreach address {
192.168.0.2
192.168.0.3
192.168.0.4
192.168.0.5
192.168.0.6
} { ping $address}
EEM Summary
There are many ways to use EEM. From applets to scripting, the possible use cases can only be limited by an engineer’s imagination. EEM provides on-box monitoring of various different components based on a series of events. Once an event is detected, an action can take place. This helps make network monitoring more proactive rather than reactive and can also reduce the load on the network and improve efficiency from the monitoring system because the devices can simply report when there is something wrong instead of continually asking the devices if there is anything wrong.
Many steps must be taken when onboarding new devices into a network environment. Often, these steps are very time-consuming and repetitive. This section compares the high-level differences between agent-based and agentless automation and configuration management tools. Understanding how the various tools work can greatly help network operators pinpoint the value that each tool can bring to the table. There is a considerable amount of overlap in the tasks or steps various tools can automate. Some tools take similar approaches. However, there are times when the use of multiple tools from different software vendors is appropriate.
Much of the value in using automation and configuration management tools is in moving more quickly than is possible with manual configuration. In addition, automation helps ensure that the level of risk due to human error is significantly reduced through the use of proven and tested automation methods. A network operations team configuring 1000 devices manually by logging into each device individually is likely to introduce misconfigurations—and the process will be very time-consuming. The following are some of the most common and repetitive configurations for which network operators leverage automation tools to increase speed and consistency:
Device name/IP address
Quality of service
Access list entries
Usernames/passwords
SNMP settings
Compliance
Agent-Based Automation Tools
This section covers a number of agent-based tools as well as some of the key concepts to help network operators decide which tool best suits their environment and business use cases.
Puppet
Puppet is a robust configuration management and automation tool. Cisco supports the use of Puppet on a variety of devices, such as Catalyst switches, Nexus switches, and the Cisco Unified Computing System (UCS) server platform. Puppet works with many different vendors and is one of the more commonly used tools used for automation. Puppet can be used during the entire lifecycle of a device, including initial deployment, configuration management, and repurposing and removing devices in a network.
Puppet uses the concept of a puppet master (server) to communicate with devices that have the puppet agent (client) installed locally on the device. Changes and automation tasks are executed within the puppet console and then shared between the puppet master and puppet agents. These changes or automation tasks are stored in the puppet database (PuppetDB), which can be located on the same puppet master server or on a separate box. This allows the tasks to be saved so they can be pushed out to the puppet agents at a later time.
To help you better understand how Puppet functions, Figure 29-2 illustrates the basic communications path between the puppet master and the puppet agents as well as the high-level architecture. The solid lines show the primary communications path, and the dotted lines indicate high availability (which is optional). With high availability, in the event that the master is unreachable, communications can go over the backup path to the master replica, which is a backup master server.

Figure 29-2 High-Level Puppet Architecture and Basic Puppet Communications Path
Puppet allows for the management and configuration of multiple device types at the same time. From a basic operation perspective, puppet agents communicate to the puppet master by using different TCP connections. Each TCP port uniquely represents a communications path from an agent running on a device or node. Puppet also has the capability to periodically verify the configuration on devices. This can be set to any frequency that the network operations team deems necessary. Then, if a configuration is changed, it can be alerted on as well as automatically put back to the previous configuration. This helps an organization standardize its device configurations while simultaneously enforcing a specific set of parameters that may be critical to the devices.
There are three different installation types with Puppet. Table 29-3 describes the scale differences between the different installation options.
Table 29-3 Puppet Installation Modes
Installation Type |
Scale |
Monolithic |
Up to 4000 nodes |
Monolithic with compile masters |
4000 to 20,000 nodes |
Monolithic with compile masters and standalone PE-PostgreSQL |
More than 20,000 nodes |
The typical and recommended type of deployment is a monolithic installation, which supports up to 4000 nodes. However, with regard to deployment use cases, it is helpful to understand that Puppet can scale to very large environments. In these cases, some best practices such as high availability and centralized management may be considered important. Although the architecture is very similar, within large-scale deployments, operations staff may need a master of masters (MoM) to manage the distributed puppet masters and their associated databases; having a MoM greatly simplifies the management of the environments. In addition, large deployments need compile masters, which are simply load-balanced Puppet servers that help scale the number of agents that can be managed. Figure 29-3 shows a typical large-scale enterprise deployment model of Puppet and its associated components.

Figure 29-3 Large-Scale Puppet Enterprise Deployment
Let’s now explore the structure of Puppet. Puppet modules allow for the configuration of practically anything that can be configured manually. Modules contain the following components:
Manifests
Templates
Files
Manifests are the code that configures the clients or nodes running the puppet agent. These manifests are pushed to the devices using SSL and require certificates to be installed to ensure the security of the communications between the puppet master and the puppet agents.
Puppet has many modules available for many different vendors and device types. The focus in this chapter is on a module called cisco_ios, which contains multiple manifests and leverages SSH to connect to devices. Each of these manifests is used to modify the running configuration on Cisco Catalyst devices in some fashion. Manifests can be saved as individual files and have a file extension .pp. Example 29-6 shows an example of a manifest file, named NTP_Server.pp, that configures a Network Time Protocol (NTP) server on a Cisco Catalyst device.
Example 29-6 Puppet NTP_Server.pp Manifest
ntp_server { '1.2.3.4':
ensure => 'present',
key => 94,
prefer => true,
minpoll => 4,
maxpoll => 14,
source_interface => 'Vlan 42',
}
This example shows that the NTP server IP address is configured as 1.2.3.4, and it uses VLAN 42 as the source interface. The line ensure => ‘present’ means that the NTP server configuration should be present in the running configuration of the Catalyst IOS device on which the manifest is running. Remember that Puppet can periodically run to ensure that there is a specific configuration present. The NTP_Server.pp manifest can be run periodically to check for an NTP server configuration.
Puppet leverages a domain-specific language (DSL) as its “programming language.” It is largely based on the Ruby language, which makes it quite simple for network operators to build custom manifests to accomplish their specific configuration tasks without having to be software developers. Example 29-7 shows a manifest file called MOTD.pp that is used to configure a message-of-the-day (MOTD) banner on Catalyst IOS devices.
Example 29-7 Puppet MOTD.pp Manifest
banner { 'default':
motd => 'Violators will be prosecuted',
}
All the modules and manifests used in this chapter can be found on the Puppet Forge website, https://forge.puppet.com. Puppet Forge is a community where puppet modules, manifests, and code can be shared. There is no cost to Puppet Forge, and it is a great place to get started with Puppet. Although this chapter does not discuss installation processes, procedures, or system requirements, you can find that information at Puppet Forge, along with code examples and specifics on how to design and install a Puppet environment from scratch. Many of the same modules, manifests, and code can also be found on www.github.com by searching for Puppet.
Chef
Chef is an open source configuration management tool that is designed to automate configurations and operations of a network and server environment. Chef is written in Ruby and Erlang, but when it comes to actually writing code within Chef, Ruby is the language used.
Configuration management tools function in two different types of models: push and pull. Push models push configuration from a centralized tool or management server, while pull models check in with the server to see if there is any change in the configuration, and if there is, the remote devices pull the updated configuration files down to the end device.
Chef is similar to Puppet in several ways:
Both have free open source versions available.
Both have paid enterprise versions available.
Both manage code that needs to be updated and stored.
Both manage devices or nodes to be configured.
Both leverage a pull model.
Both function as a client/server model.
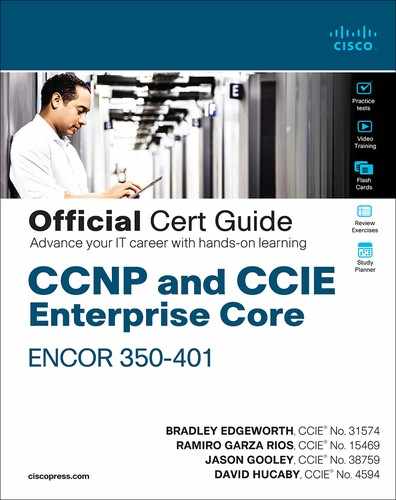
However, Chef’s structure, terminology, and core components are different from those of Puppet. Figure 29-4 illustrates the high-level architecture of Chef and the basic communications path between the various areas within the Chef environment. Although this chapter doesn’t cover every component shown in this architecture, it is important to understand some of the elements that are available.
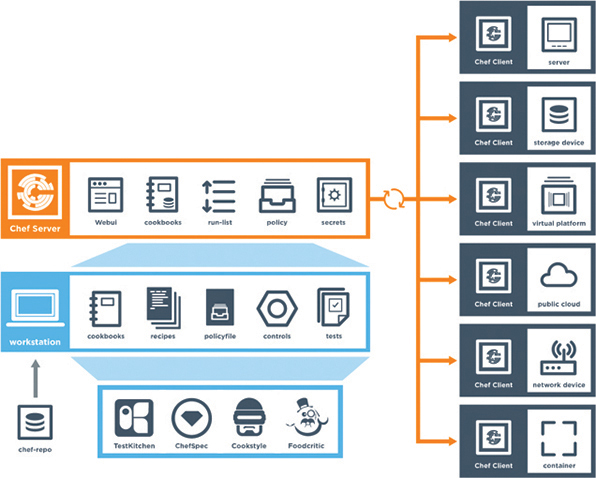
Figure 29-4 High-Level Chef Architecture
You can see from Figure 29-4 that Chef leverages a similar client/server functionality to Puppet. Although the core concepts of Puppet and Chef are similar, the terminology differs. Whereas Puppet has modules and manifests, Chef has cookbooks and recipes. Table 29-4 compares the components of Chef and Puppet and provides a brief description of each component.
Table 29-4 Puppet and Chef Comparison
Chef Components |
Puppet Components |
Description |
Chef server |
Puppet master |
Server/master functions |
Chef client |
Puppet agent |
Client/agent functions |
Cookbook |
Module |
Collection of code or files |
Recipe |
Manifest |
Code being deployed to make configuration changes |
Workstation |
Puppet console |
Where users interact with configuration management tool and create code |
Code is created on the Chef workstation. This code is stored in a file called a recipe. As mentioned previously, recipes in Chef are analogous to manifests in Puppet. Once a recipe is created on the workstation, it must be uploaded to the Chef server in order to be used in the environment. knife is the name of the command-line tool used to upload cookbooks to the Chef server. The command to execute an upload is knife upload cookbookname. The Chef server can be hosted locally on the workstation, hosted remotely on a server, or hosted in the cloud. In addition, all the components can be within the same enterprise network.
There are four types of Chef server deployments:
Chef Solo: The Chef server is hosted locally on the workstation.
Chef Client and Server: This is a typical Chef deployment with distributed components.
Hosted Chef: The Chef server is hosted in the cloud.
Private Chef: All Chef components are within the same enterprise network.
Like the puppet master, the Chef server sits in between the workstation and the nodes. All cookbooks are stored on the Chef server, and in addition to the cookbooks, the server holds all the tools necessary to transfer the node configurations to the Chef clients. OHAI, a service that is installed on the nodes, is used to collect the current state of a node to send the information back to the Chef server through the Chef client service. The Chef server then checks to see if there is any new configuration that needs to be on the node by comparing the information from the OHAI service to the cookbook or recipe. The Chef client service that runs on the nodes is responsible for all communications to the Chef server. When a node needs a recipe, the Chef client service handles the communication back to the Chef server to signify the node’s need for the updated configuration or recipe. Because the nodes can be unique or identical, the recipes can be the same or different for each node. Example 29-8 shows a recipe file constructed in Ruby; recipe files have the filename extension .rb. You can see that the file is very simple to read and interpret.
Example 29-8 Chef demo_install.rb Recipe
#
# Cookbook Name:: cisco-cookbook
# Recipe:: demo_install
#
# Copyright (c) 2014-2017 Cisco and/or its affiliates.
#
# Licensed under the Apache License, Version 2.0 (the "License");
# you may not use this file except in compliance with the License.
# You may obtain a copy of the License at
#
# http://www.apache.org/licenses/LICENSE-2.0
#
# Unless required by applicable law or agreed to in writing, software
# distributed under the License is distributed on an "AS IS" BASIS,
# WITHOUT WARRANTIES OR CONDITIONS OF ANY KIND, either express or implied.
# See the License for the specific language governing permissions and
# limitations under the License.
# In our recipes, due to the number of different parameters, we prefer to align
# the arguments in a single column rather than following rubocop's style.
Chef::Log.info('Demo cisco_command_config provider')
cisco_command_config 'loop42' do
action :update
command '
interface loopback42
description Peering for AS 42
ip address 192.168.1.42/24
'
end
cisco_command_config 'system-switchport-default' do
command 'no system default switchport'
end
cisco_command_config 'feature_bgp' do
command ' feature bgp'
end
cisco_command_config 'router_bgp_42' do
action :update
command '
router bgp 42
router-id 192.168.1.42
address-family ipv4 unicast
network 1.0.0.0/8
redistribute static route-map bgp-statics
neighbor 10.1.1.1
remote-as 99
'
end
cisco_command_config 'route42' do
action :update
command ' ip route 10.42.42.42/32 Null0 '
end
# The following tests 'no' commands that do not
# nvgen when enabled.
# We need to first configure the port-channel interface
# so that it exists before applying the 'no' commands.
cisco_command_config 'port-channel55-setup' do
action :update
command '
feature bfd
interface port-channel55
'
end
cisco_command_config 'port-channel55' do
action :update
command '
interface port-channel55
no switchport
no bfd echo
no ip redirects
'
End
With Chef, the kitchen is a place where all recipes and cookbooks can automatically be executed and tested prior to hitting any production nodes. This is analogous to large companies in the food industry that use test kitchens to make food recipes that will not interfere with other recipes in their production environment. The kitchen allows for not only testing within the enterprise environment but also across many cloud providers and virtualization technologies. The kitchen also supports many of the common testing frameworks that are used by the Ruby community:
Bash Automated Testing System (BATS)
Minitest
RSpec
Serverspec
Puppet and Chef are often seen as interchangeable because they are very similar. However, which one you use ultimately depends on the skillset and adoption processes of your network operations.
SaltStack (Agent and Server Mode)
SaltStack is another configuration management tool, in the same category as Chef and Puppet. Of course, SaltStack has its own unique terminology and architecture. SaltStack is built on Python, and it has a Python interface so a user can program directly to SaltStack by using Python code. However, most of the instructions or states that get sent out to the nodes are written in YAML or a DSL. These are called Salt formulas. Formulas can be modified but are designed to work out of the box. Another key difference from Puppet and Chef is SaltStack’s overall architecture. SaltStack uses the concept of systems, which are divided into various categories. For example, whereas the Puppet architecture has a puppet master and puppet agents, SaltStack has masters and minions.
SaltStack can run remote commands to systems in a parallel fashion, which allows for very fast performance. By default, SaltStack leverages a distributed messaging platform called 0MQ (ZeroMQ) for fast, reliable messaging throughout the networking stack. SaltStack is an event-driven technology that has components called reactors and beacons. A reactor lives on the master and listens for any type of changes in the node or device that differ from the desired state or configuration. These changes include the following:
Command-line configuration
Disk/memory/processor utilization
Status of services
Beacons live on minions. (The minions are similar to the Puppet agents running on nodes.) If a configuration changes on a node, a beacon notifies the reactor on the master. This process, called the remote execution system, helps determine whether the configuration is in the appropriate state on the minions. These actions are called jobs, and the executed jobs can be stored in an external database for future review or reuse.
Another notable difference between Puppet and SaltStack is that instead of using modules and manifests to control state and send configuration changes, SaltStack uses pillars and grains. SaltStack grains are run on the minions to gather system information to report back to the master. This information is typically gathered by the salt-minion daemon. (This is analogous to Chef’s use of the OHAI service.) Grains can provide specifics to the master (on request) about the host, such as uptime for example. Pillars, on the other hand, store data that a minion can retrieve from the master. Pillars can also have certain minions assigned to them, and other minions that are not assigned to a specific pillar would not have access to that data. This means data can be stored for a specific node or set of nodes inside a pillar, and it is completely separate from any other node that is not assigned to this particular pillar. Confidential or sensitive information that needs to be shared with only specific minions can be secured in this way.
In terms of overall scale and management, SaltStack, much like Puppet and Chef, can scale to a very large number of devices. Like Puppet and Chef, SaltStack also has an enterprise version and a GUI; this GUI, called SynDic, makes it possible to leverage the master of masters. Although this section focuses more on the command line delivery of SaltStack, it is important to understand that this tool, like the others, offers some very similar features. Figure 29-5 shows the overall architecture of SaltStack and its associated components. Again, although the components in this architecture are not all covered in this chapter, it is important to understand some of the elements that are available.

Figure 29-5 High-Level SaltStack Architecture
Like Puppet, SaltStack has its own DSL. The SaltStack command structure contains targets, commands, and arguments. The target is the desired system that the command should run. It is possible to target the system by using the MinionID of a minion. It is also very common to target all systems with the asterisk (*), which is a wildcard indicating all systems that are currently managed by SaltStack. Another possibility is to use a combination of the two; for example, Minion* would grab any system that has a MinionID that starts with the word Minion. This is called globbing. The command structure uses the module.function syntax followed by the argument. An argument provides detail to the module and function that is being called on in the command. Figure 29-6 shows the correct SaltStack syntax as well as the power of running a command called cmd.run that executes the ad hoc Linux CLI command ls -l /etc across all SaltStack managed nodes and returning the output of the command to the master.

Figure 29-6 SaltStack CLI Command cmd.run ls -1/etc
Imagine that a network operations team is looking to deploy a new feature on the network and needs a list of all the IP addresses on all the Linux servers in the environment. The team could use cmd.run to achieve this. However, other commands and modules are specifically designed for such use cases. Rather than having to write up all the ad hoc commands necessary to get the desired outputs from all the nodes, the team could leverage something like the network.interfaces command to gather much more data from the disparate systems, such as the MAC address, interface names, state, and IPv4 and IPv6 addresses assigned to those interfaces. Figure 29-7 provides an example of output on a Linux host showing this specific use case.
SaltStack can provide some immediate benefits, especially for operations teams that are used to working in the command-line environment on network and server nodes. A team can easily tie the power of Python scripts into SaltStack to create a very powerful combination. Other tools use Python as well, but which one to use ultimately comes down to what the operations staff is most comfortable with.

Figure 29-7 SaltStack CLI Command network.interfaces
Agentless Automation Tools
This section covers a variety of agentless tools as well as some of the key concepts to help network operators decide which tool best suits their environment and business use cases.
Ansible
Ansible is an automation tool that is capable of automating cloud provisioning, deployment of applications, and configuration management. Ansible has been around for quite some time and was catapulted further into the mainstream when RedHat purchased the company in 2015. Ansible has grown very popular due to its simplicity and the fact that it is open source. Ansible was created with the following concepts in mind:
Consistent
Secure
Highly reliable
Minimal learning curve
Unlike the automation tools covered in the previous section of this chapter, Ansible is an agentless tool. This means that no software or agent needs to be installed on the client machines that are to be managed. Some consider this to be a major advantage of using Ansible compared to using other products. Ansible communicates using SSH for a majority of devices, and it can support Windows Remote Management (WinRM) and other transport methods to the clients it manages. In addition, Ansible doesn’t need an administrative account on the client. It can use built-in authorization escalation such as sudo when it needs to raise the level of administrative control.
Ansible sends all requests from a control station, which could be a laptop or a server sitting in a data center. The control station is the computer used to run Ansible and issue changes and send requests to the remote hosts. Figure 29-8 illustrates the Ansible workflow.
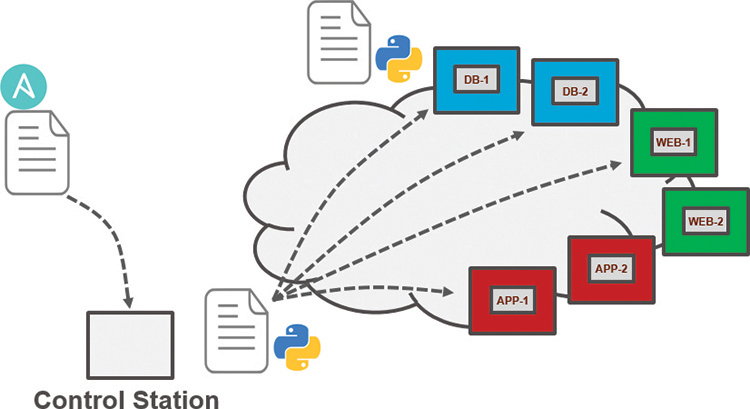
Figure 29-8 Ansible Workflow
Administrators, developers, and IT managers like to use Ansible because it allows for easy ramp-up for users who aim to create new projects, and it sets the stage for long-term automation initiatives and processes to further benefit the business. Automation, by nature, reduces the risk of human error by automatically duplicating known best practices that have been thoroughly tested in an environment. However, automation can be dangerous if it duplicates a bad process or an erroneous configuration. (This applies to any tool, not just Ansible.) When preparing to automate a task or set of tasks, it is important to start with the desired outcome of the automation, and then it’s possible to move on to creating a plan to achieve the outcome. A methodology commonly used or this process is the PPDIOO (Prepare, Plan, Design, Implement, Observe, Optimize) lifecycle, shown in Figure 29-9.
Ansible uses playbooks to deploy configuration changes or retrieve information from hosts within a network. An Ansible playbook is a structured sets of instructions—much like the playbooks football players use to make different plays on the field during a game. An Ansible playbook contains multiple plays, and each play contains the tasks that each player must accomplish in order for the particular play to be successful. Table 29-5 describes the components used in Ansible and provides some commonly used examples of them.
Figure 29-9 The PPDIOO Lifecycle
Table 29-5 Ansible Playbook Structure and Examples
Components |
Description |
Use Case |
Playbook |
A set of plays for remote systems |
Enforcing configuration and/or deployment steps |
Play |
A set of tasks applied to a single host or a group of hosts |
Grouping a set of hosts to apply policy or configuration to them |
Task |
A call to an Ansible module |
Logging in to a device to issue a show command to retrieve output |
Ansible playbooks are written using YAML (Yet Another Markup Language). Ansible YAML files usually begin with a series of three dashes (---) and end with a series of three periods (…). Although this structure is optional, it is common. YAML files also contain lists and dictionaries. Example 29-9 shows a YAML file that contains a list of musical genres.
Example 29-9 YAML List Example
---
# List of music genres
Music:
- Metal
- Rock
- Rap
- Country
...
YAML lists are very easy to read and consume. As you can see in Example 29-9, it is possible to add comments in YAML by beginning lines with a pound sign (#). As mentioned earlier, a YAML file often begins with --- and ends with …; in addition, as you can see in Example 29-9, each line of a list can start with a dash and a space (- ), and indentation makes the YAML file readable.
YAML uses dictionaries that are similar to JSON dictionaries as they also use key/value pairs. Remember from Chapter 28, “Foundational Network Programmability Concepts,” that a JSON key/value pair appears as “key”: “value”; a YAML key/value pair is similar but does not need the quotation marks—key: value. Example 29-10 shows a YAML dictionary containing an employee record.
Example 29-10 YAML Dictionary Example
---
# HR Employee record
Employee1:
    Name: John Dough
    Title: Developer
    Nickname: Mr. DBug
Lists and dictionaries can be used together in YAML. Example 29-11 shows a dictionary with a list in a single YAML file.
Example 29-11 YAML Dictionary and List Example
---
# HR Employee records
-  Employee1:
    Name: John Dough
    Title: Developer
    Nickname: Mr. DBug
    Skills:
      - Python
      - YAML
      - JSON
-  Employee2:
    Name: Jane Dough
    Title: Network Architect
    Nickname: Lay DBug
    Skills:
      - CLI
      - Security
      - Automation
YAML Lint is a free online tool you can use to check the format of YAML files to make sure they have valid syntax. Simply go to www.yamllint.com and paste the contents of a YAML file into the interpreter and click Go. Lint alerts you if there is an error in the file. Figure 29-10 shows the YAML dictionary and list file from Example 29-11 in Lint, with the formatting cleaned up and the comment removed.

Figure 29-10 YAML Lint Example
Ansible has a CLI tool that can be used to run playbooks or ad hoc CLI commands on targeted hosts. This tool has very specific commands that you need to use to enable automation. Table 29-6 shows the most common Ansible CLI commands and associated use cases.
Table 29-6 Ansible CLI Commands
CLI Command |
Use Case |
ansible |
Runs modules against targeted hosts |
ansible-playbook |
Runs playbooks |
ansible-docs |
Provides documentation on syntax and parameters in the CLI |
ansible-pull |
Changes Ansible clients from the default push model to the pull model |
ansible-vault |
Encrypts YAML files that contain sensitive data |
Ansible uses an inventory file to keep track of the hosts it manages. The inventory can be a named group of hosts or a simple list of individual hosts. A host can belong to multiple groups and can be represented by either an IP address or a resolvable DNS name. Example 29-12 shows the contents of a host inventory file with the host 192.168.10.1 in two different groups.
Example 29-12 Ansible Host Inventory File
[routers]
192.168.10.1
192.168.20.1

[switches]
192.168.10.25
192.168.10.26

[primary-gateway]
192.168.10.1
Now let’s look at some examples of Ansible playbooks used to accomplish common tasks. Imagine using a playbook to deploy interface configuration on a device without having to manually configure it. You might take this idea a step further and use a playbook to configure an interface and deploy an EIGRP routing process. Example 29-13 shows the contents of an Ansible playbook called ConfigureInterface.yaml, which you can use to configure the GigabitEthernet2 interface on a CSR 1000V router. By leveraging the ios_config Ansible module, this playbook adds the following configuration to the GigabitEthernet2 interface on the CSR1KV-1 router:
description Configured by ANSIBLE!!!
ip address 10.1.1.1
subnet mask 255.255.255.0
no shutdown
Example 29-13 Ansible ConfigureInterface.yaml Playbook
---
- hosts: CSR1KV-1
  gather_facts: false
  connection: local

  tasks:
   - name: Configure GigabitEthernet2 Interface
     ios_config:
       lines:
         - description Configured by ANSIBLE!!!
         - ip address 10.1.1.1 255.255.255.0
         - no shutdown
       parents: interface GigabitEthernet2
       host: "{{ ansible_host }}"
       username: cisco
       password: testtest
To execute this playbook, the ansible-playbook command is used to call the specific play book YAML file (ConfigureInterace.yaml). Figure 29-11 shows the output from calling the playbook from the Linux shell. The important things to note in the output are the PLAY, TASK, and PLAY RECAP sections, which list the name of the play and each individual task that gets executed in each play. The PLAY RECAP section shows the status of the playbook that is executed. The output in Figure 29-11 shows that one play, named CSR1KV-1, was launched, followed by a task called Configure GigabitEthernet2 Interface. Based on the status ok=1, you know the change was successful; the changed=1 status means that a single change was made on the CSR1KV-1 router.

Figure 29-11 Executing the ConfigureInterface.yaml Playbook
Building out a playbook can greatly simplify configuration tasks. Example 29-14 shows an alternative version of the ConfigureInterface.yaml playbook named EIGRP_Configuration_Example.yaml, with EIGRP added, along with the ability to save the configuration by issuing a “write memory.” These tasks are accomplished by leveraging the ios_command module in Ansible. This playbook adds the following configuration to the CSR1KV-1 router:
On GigabitEthernet2:
description Configured by ANSIBLE!!!
ip address 10.1.1.1
subnet mask 255.255.255.0
no shutdown
On GigabitEthernet3:
description Configured by ANSIBLE!!!
no ip address
shutdown
Global configuration:
router eigrp 100
eigrp router-id 1.1.1.1
no auto-summary
network 10.1.1.0 0.0.0.255
Save configuration:
write memory
Example 29-14 Ansible EIGRP_Configuration_Example.yaml Playbook
---
- hosts: CSR1KV-1

  gather_facts: false
  connection: local

  tasks:
   - name: Configure GigabitEthernet2 Interface
     ios_config:
       lines:
         - description Configured by ANSIBLE!!!
         - ip address 10.1.1.1 255.255.255.0
         - no shutdown
       parents: interface GigabitEthernet2

       host: "{{ ansible_host }}"
       username: cisco
       password: testtest

   - name: CONFIG Gig3
     ios_config:
       lines:
         - description Configured By ANSIBLE!!!
         - no ip address
         - shutdown
       parents: interface GigabitEthernet3

       host: "{{ ansible_host }}"
       username: cisco
       password: testtest

   - name: CONFIG EIGRP 100
     ios_config:
       lines:
         - router eigrp 100
         - eigrp router-id 1.1.1.1
         - no auto-summary
         - network 10.1.1.0 0.0.0.255

       host: "{{ ansible_host }}"
       username: cisco
       password: testtest

   - name: WR MEM
     ios_command:
       commands:
         - write memory

       host: "{{ ansible_host }}"
       username: cisco
       password: testtest
When the playbook is run, the output shows the tasks as they are completed and the status of each one. Based on the output shown in Figure 29-12, you can see that tasks with the following names are completed and return the status changed:
Configure GigabitEthernet 2 Interface
CONFIG Gig3
CONFIG EIGRP 100

Figure 29-12 Executing the EIGRP_Configuration_Example.yaml Playbook
Furthermore, the WR MEM task completes, which is evident from the status ok: [CSR1KV-1]. At the bottom of the output, notice the PLAY RECAP section, which has the status ok=4 and changed=3. This means that out of the four tasks, three actually modified the router and made configuration changes, and one task saved the configuration after it was modified.
Now that the EIGRP_Configuration_Example.yaml playbook has been run against CSR1KV-1, you need to verify the configuration to make sure it was correctly applied. Example 29-15 shows the relevant sections of the startup configuration from CSR1KV-1 to verify the tasks that were applied to the router.
Example 29-15 Relevant startup-config Post Playbook
!
interface GigabitEthernet1
 ip address 172.16.38.101 255.255.255.0
 negotiation auto
 no mop enabled
 no mop sysid
!
interface GigabitEthernet2
 description Configured by ANSIBLE!!!
 ip address 10.1.1.1 255.255.255.0
 negotiation auto
!
interface GigabitEthernet3
 description Configured By ANSIBLE!!!
 no ip address
 shutdown
 negotiation auto
!
router eigrp 100
 network 10.1.1.0 0.0.0.255
 eigrp router-id 1.1.1.1
!
The last task in the playbook is to issue the write memory command, and you can verify that it happened by issuing the show startup-config command with some filters to see the relevant configuration on the CSR1KV-1 router. Figure 29-13 shows the output from the show startup-config | se GigabithEthernet2|net3|router eigrp 100 command.
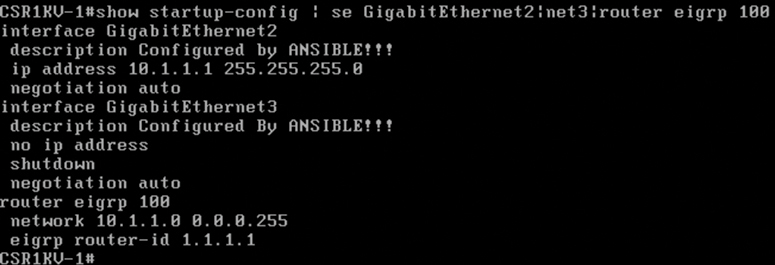
Figure 29-13 Verifying the EIGRP_Configuration_Example.yaml Playbook on CSR1KV-1
Puppet Bolt
Puppet Bolt allows you to leverage the power of Puppet without having to install a puppet master or puppet agents on devices or nodes. Much like Ansible, Puppet Bolt connects to devices by using SSH or WinRM connections. Puppet Bolt is an open source tool that is based on the Ruby language and can be installed as a single package.
In Puppet Bolt, tasks can be used for pushing configuration and for managing services, such as starting and stopping services and deploying applications. Tasks are sharable. For example, users can visit Puppet Forge to find and share tasks with others in the community. Tasks are really good for solving problems that don’t fit in the traditional model of client/server or puppet master and puppet agent. As mentioned earlier in this chapter, Puppet is used to ensure configuration on devices and can periodically validate that the change or specific value is indeed configured. Puppet Bolt allows you to execute a change or configuration immediately and then validate it. There are two ways to use Puppet Bolt:
Orchestrator-driven tasks: Orchestrator-driven tasks can leverage the Puppet architecture to use services to connect to devices. This design is meant for large-scale environments.
Standalone tasks: Standalone tasks are for connecting directly to devices or nodes to execute tasks and do not require any Puppet environment or components to be set up in order to realize the benefits and value of Puppet Bolt.
Individual commands can be run from the command line by using the command bolt command run command name followed by the list of devices to run the command against. In addition to manually running the commands, you can construct scripts that contain multiple commands. You can construct these scripts in Python, Ruby, or any other scripting language that the devices can interpret. After a script is built, you can execute it from the command line against the remote devices that need to be configured, using the command bolt script run script name followed by the list of devices to run the script against. Figure 29-14 shows a list of some of the available commands for Puppet Bolt.
![A screenshot shows the puppet bolt command line. The following command script is mentioned on the screen: "Usage: bolt <subcommand> <action> [options]. A few subcommands are mentioned below.](http://images-20200215.ebookreading.net/1/1/1/9780135262047/9780135262047__ccnp-and-ccie__9780135262047__graphics__29fig14.jpg)
Figure 29-14 The Puppet Bolt Command Line
Puppet Bolt copies the script into a temporary directory on the remote device, executes the script, captures the results, and removes the script from the remote system as if it were never copied there. This is a really clean way of executing remote commands without leaving residual scripts or files on the remote devices.
Much as in the Cisco DNA Center and Cisco vManage APIs, Puppet Bolt tasks use an API to retrieve data between Puppet Bolt and the remote device. This provides a structure for the data that Puppet Bolt expects to see. Tasks are part of the Puppet modules and use the naming structure modulename::taskfilename. Tasks can be called from the command line much like commands and scripts. You use the command bolt task run modulename::taskfilename to invoke these tasks from the command line. The modulename::taskfilename naming structure allows the tasks to be shared with other users on Puppet Forge. A task is commonly accompanied by a metadata file that is in JSON format. A JSON metadata file contains information about a task, how to run the task, and any comments about how the file is written. Often, the metadata file is named the same as the task script but with a JSON extension. This is a standard way of sharing documentation about what a script can do and how it is structured. You can see this documentation by running the command bolt task show modulename::taskfilename at the command line.
SaltStack SSH (Server-Only Mode)
SaltStack offers an agentless option called Salt SSH that allows users to run Salt commands without having to install a minion on the remote device or node. This is similar in concept to Puppet Bolt. The main requirements to use Salt SSH are that the remote system must have SSH enabled and Python installed.
Salt SSH connects to a remote system and installs a lightweight version of SaltStack in a temporary directory and can then optionally delete the temporary directory and all files upon completion, leaving the remote system clean. These temporary directories can be left on the remote systems along with any necessary files to run Salt SSH. This way, the files do not have to be reinstalled to the remote device, which can be useful when time is a consideration. This is often useful on devices that are using Salt SSH more frequently than other devices in the environment.
Another benefit of using Salt SSH is that it can work in conjunction with the master/minion environment, or it can be used completely agentless across the environment. By default, Salt SSH uses roster files to store connection information for any host that doesn’t have a minion installed. Example 29-16 shows the content structure of this file. It is easy to interpret the roster file and many other files associated with Salt SSH because they are constructed in human-readable form.
Example 29-16 Salt SSH Roster File
managed:
       host: 192.168.10.1
       user: admin
One of the major design considerations when using Salt SSH is that it is considerably slower than the 0MQ distributed messaging library. However, Salt SSH is still often considered faster than logging in to the system to execute the commands.
By automating daily configuration tasks, users can gain some of the following benefits:
Increased agility
Reduced opex
Streamlined management
Reduced human error
Comparing Tools
Many organizations face lean IT problems and high turnover, and network engineers are being asked to do more with less. Utilizing some of the tools covered in this chapter can help alleviate some of the pressure put on IT staff by offloading some of the more tedious, time-consuming, and repetitious tasks. A network operator can then focus more on critical mission responsibilities such as network design and growth planning. As mentioned earlier in this chapter, a majority of these tools function very similarly to one another. Table 29-7 provides a high-level comparison of the tools covered in this chapter.
Table 29-7 High-Level Configuration Management and Automation Tool Comparison
Factor |
Puppet |
Chef |
Ansible |
SaltStack |
Architecture |
Puppet masters and puppet agents |
Chef server and Chef clients |
Control station and remote hosts |
Salt master and minions |
Language |
Puppet DSL |
Ruby DSL |
YAML |
YAML |
Terminology |
Modules and manifests |
Cookbooks and recipes |
Playbooks and plays |
Pillars and grains |
Support for large-scale deployments |
Yes |
Yes |
Yes |
Yes |
Agentless version |
Puppet Bolt |
N/A |
Yes |
Salt SSH |
The most important factors in choosing a tool are how the tools are used and the skills of the operations staff who are adopting them. For instance, if a team is very fluent in Ruby, it may make sense to look at Chef. On the other hand, if the team is very confident at the command line, Ansible or SaltStack might be a good fit. The best tool for the job depends on the customer, and choosing one requires a thorough understanding of the differences between the tools and solid knowledge of what the operations team is comfortable with and that will play to their strengths.
Exam Preparation Tasks
As mentioned in the section “How to Use This Book” in the Introduction, you have a couple of choices for exam preparation: the exercises here, Chapter 30, “Final Preparation,” and the exam simulation questions in the Pearson Test Prep Software Online.
Review All Key Topics
Review the most important topics in the chapter, noted with the key topics’ icon in the outer margin of the page. Table 29-8 lists these key topics and the page number on which each is found.
Table 29-8 Key Topics for Chapter 29
Key Topic Element |
Description |
Page |
Paragraph |
EEM applets and configuration |
|
Section |
Puppet |
|
Section |
Chef |
|
Section |
SaltStack (agent and server mode) |
|
Section |
Ansible |
|
Section |
Puppet Bolt |
|
Section |
SaltStack SSH (server-only mode) |
|
High-Level Configuration Management and Automation Tool Comparison |
Complete Tables and Lists from Memory
There are no memory tables in this chapter.
Define Key Terms
Define the following key terms from this chapter and check your answers in the Glossary: