4. Stoichiometry
If you are thinking about someone while reading this book, you are most definitely in love.
—Tim Newberger Undergraduate ChE Student W2013
Overview. In Chapter 2, we carried out the sizing and sequencing of flow reactors given the reaction rate, –rA, as a function of conversion X. To find –rA = f(X) is a two-step process. In Chapter 3, we described (Step 1) how the rate of reaction, –rA, is related to concentration and temperature, that is, –rA = [kA(T)fn(CA, CB ...)]. In this chapter, we show how concentration can be related to conversion (Step 2), Ci = g(X), and once we do that, we will have –rA = f(X) and can design a multitude of reaction systems. We will use stoichiometric tables, along with the definitions of concentration, to find the concentration as a function of conversion.
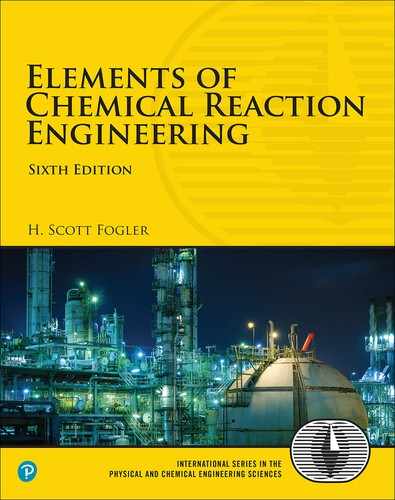
For batch systems the reactor is most always rigid, so V = V0, and one then uses the stoichiometric table to express concentration as a function of conversion: CA = NA/V0 = CA0(1 – X).
For liquid-phase flow systems, the volumetric flow rate is considered to be constant, υ = υ0, and CA = (FA0/υ0)(1 – X) = CA0(1 – X).
For gas-phase flow systems, the process becomes more complicated, as the volumetric flow rate for gases can vary with conversion, temperature, and pressure, and we need to develop the relationship relating υ and X, that is, υ = υ0(1+ɛX)(P0/P)(T/T0) and thus
For most gas–solid catalyst reactions, the rate laws are typically written in terms of partial pressures, which can also be written in terms of conversion.
After completing this chapter, you will be able to write the rate of reaction as a function of conversion and calculate the equilibrium conversion for both batch and flow reactors.
Now that we have shown how the rate law can be expressed as a function of concentrations, we need only express concentration as a function of conversion and sequence in order to carry out calculations similar to those presented in Chapter 2 to size reactors. If the rate law depends on more than one species, we must relate the concentrations of the different species to each other. This relationship is most easily established with the aid of a stoichiometric table. This table presents the stoichiometric relationships between reacting molecules for single reactions. That is, it tells us how many molecules of one species will be formed during a chemical reaction when a given number of molecules of another species disappears. These relationships will be developed for the general reaction
Recall that we have already used stoichiometry to relate the relative rates of reaction for Equation (2-1):
This stoichiometric relationship relating reaction rates will be used in Chapters 6 and 8.
In formulating our stoichiometric table, we shall take species A as our basis of calculation (i.e., the limiting reactant) and then divide through by the stoichiometric coefficient of A
in order to put everything on a basis of “per mole of A.”
Next, we develop the stoichiometric relationships for reacting species that give the change in the number of moles of each species (i.e., A, B, C, and D).

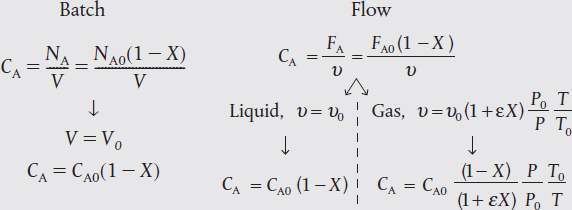
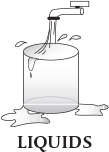
Figure 4-1 Batch reactor. (Schematic with special permission by Renwahr.) (http://encyclopedia.che.engin.umich.edu/Pages/Reactors/Batch/Batch.html)
4.1 Batch Reactors (BRs)
Batch reactors (BRs) are primarily used for the production of specialty chemicals and to obtain reaction rate data in order to determine reaction-rate laws and rate-law parameters such as k, the specific reaction rate.
Figure 4-1 shows a starving artist’s rendition of a batch system in which we will carry out the reaction given by Equation (2-2). At time t = 0, we will open the reactor and place a number of moles of species A, B, C, and D, and inerts I (NA0, NB0, NC0, ND0, and NI0, respectively) into the reactor and then of course close the port hole.
Species A is our basis of calculation, and NA0 is the number of moles of A initially present in the reactor. After a time t, NA0X moles of A are consumed in the system as a result of the chemical reaction, leaving (NA0 – NA0X) moles of A in the system. That is, the number of moles of A remaining in the reactor after a conversion X has been achieved is
NA = NA0 – NA0X = NA0(1 – X)
We now will use conversion in a similar fashion to express the number of moles of B, C, and D in terms of conversion.
To determine the number of moles of each species remaining after NA0X moles of A have reacted, we form the stoichiometric table (Table 4-1). This stoichiometric table presents the following information:
TABLE 4-1 STOICHIOMETRIC TABLE FOR A BATCH SYSTEM
Species |
Initially (mol) |
Change (mol) |
Remaining (mol) |
A |
NA0 |
−(NA0X) |
NA = NA NA0 – NA0X |
B |
NB0 |
||
C |
NC0 |
||
D |
ND0 |
||
I (inerts) |
NI0 |
– |
NI = NI0 |
Totals |
NT0 |
|
Batch Reactor
Column 1: the species in the reaction
Column 2: the number of moles of each species initially present
Column 3: the change in the number of moles brought about by reaction
Column 4: the number of moles remaining in the system at time t
Components of the stoichiometric table
To calculate the number of moles of species B remaining at time t, we recall that at time t the number of moles of A that have reacted is NA0X. For every mole of A that reacts, b/a moles of B must react; therefore, the total number of moles of B that have reacted is
Because B is disappearing from the system, the sign of the “change” is negative. NB0 is the number of moles of B initially in the system. Therefore, the number of moles of B remaining in the system, NB, at a time t, is the number of moles of B initially minus the moles of B that have reacted and is given in the last column of Table 4-1 as
The complete stoichiometric table delineated in Table 4-1 is for all species in the general reaction
Let’s take a look at the totals in the last column of Table 4-1. The stoichiometric coefficients in parentheses represent the change in the total number of moles per mole of A reacted. Because this term occurs so often in our calculations, it is given the symbol δ:
The parameter δ
Definition of δ
The total number of moles can now be calculated from the equation
NT = NT0 + δ(NA0X)
We recall from Chapters 1 and 3 that the kinetic rate law (e.g., ) is a function solely of the intensive properties of the reacting system (e.g., temperature, pressure, concentration, and catalysts, if any). The reaction rate, –rA, usually depends on the concentration of the reacting species raised to some power. Consequently, to determine the reaction rate as a function of conversion, X, we need to know the concentrations of the reacting species as a function of conversion, X. Let’s do it!
We want Cj = hj (X)
4.1.1 Batch Concentrations for the Generic Reaction, Equation (2-2)
The concentration of A is the number of moles of A per unit volume
Batch concentration
After writing similar equations for B, C, and D, we use the stoichiometric table to express the concentration of each component in terms of the conversion X:
Because almost all batch reactors are solid vessels, the reactor volume is constant, so we can take V =V0, then
Constant Volume, V = V0
We will soon see that Equation (4-6) for constant-volume batch reactors also applies to continuous-flow liquid-phase systems.
We further simplify these equations by defining the parameter Θi, which allows us to factor out NA0 in each of the expressions for concentration
with
Feed
Equalmolar:
ΘB = 1
Stoichiometric:
for an equalmolar feed ΘB = 1 and for a stoichiometric feed ΘB = b/a.
Continuing for species C and D
Concentration for constant-volume batch reactors and for liquid-phase continuous-flow reactors
For constant-volume batch reactors, for example, steel containers V = V0, we now have concentration as a function of conversion. If we know the rate law, we can now obtain –rA = f(X) to couple with the differential mole balance in terms of conversion in order to solve for the reaction time, t, to achieve a spec-ified conversion, X.
For liquid-phase reactions taking place in solution, the solvent usually dominates the situation. For example, most liquid-phase organic reactions do not change density during the course of the reaction and represent still another case for which the constant-volume simplifications apply. As a result, changes in the density of the solute do not affect the overall density of the solution significantly and therefore it is essentially a constant-volume reaction process, V = V0 and υ = υ0. Consequently, Equations (4-6)–(4-9) can be used for liquid-phase reactions as well as constant-volume (V = V0) gas-phase reactions. An important exception to this general rule exists for some polymerization processes.
For liquids V = V0 and υ = υ0
To summarize for constant-volume batch systems and for liquid-phase reactions, we can use a rate law for Reaction (2-2) such as –rA = kACACB to obtain = f(X); that is,

Substituting for the given parameters k, CA0, and ΘB, we can now use the techniques in Chapter 2 to size the CSTRs and PFRs for liquid-phase reactions.
Example 4–1 Expressing Cj = hj (X) for a Liquid-Phase Batch Reaction
Soap is necessary to clean such things as dirty softball and soccer players’ uniforms, dirty hands, and foul mouths. Soap consists of the sodium and potassium salts of various fatty acids, such as oleic, stearic, palmitic, lauric, and myristic acids. The saponification reaction for the formation of soap from aqueous caustic soda and glyceryl stearate is
3NaOH(aq) (C17 H35COO)3C3 H5 → 3C17 H35COONa + C3 H5(OH)3
Letting X represent the conversion of sodium hydroxide (the moles of sodium hydroxide reacted per mole of sodium hydroxide initially present), set up a stoichiometric table expressing the concentration of each species in terms of its initial concentration and the conversion, X.
Solution
Because we have taken sodium hydroxide as our basis of calculation, we divide through by the stoichiometric coefficient of sodium hydroxide to put the reaction expression in the form
Choosing a basis of calculation
We may next perform the calculations shown in Table E4-1.1. Because this reaction is a liquid-phase reaction, the density ρ is considered to be constant; therefore, V = V0
TABLE E4-1.1 STOICHIOMETRIC TABLE FOR LIQUID-PHASE SOAP REACTION
Species |
Symbol |
Initially |
Change |
Remaining |
Concentration |
NaOH |
A |
NA0 |
–NA0 X |
NA0 (1 – X) |
CA0 (1 – X) |
(C17 H35COO)3C3 H5 |
B |
NB0 |
|||
C17 H35COONa |
C |
NC0 |
NA0 X |
NA0(ΘC + X) |
CA0(ΘC + X |
C3 H5(OH)3 |
D |
ND0 |
|||
Water (inert) |
I |
N10 |
– |
N10 |
CI0 |
Totals |
NT0 |
0 |
NT = NT0 |
Stoichiometric table (batch)
Analysis: The purpose of this example was to show how the generic reaction in Table 4-1 is applied to a real reaction and how to develop the corresponding stoichiometric table.
Example 4–2 What Is the Limiting Reactant?
Having set up the stoichiometric table in Example 4-1, one can now readily use it to calculate the concentrations at a given conversion. If the initial mixture consists of sodium hydroxide at a concentration of 10 mol/dm3 (i.e., 10 mol/L or 10 kmol/m3) and glyceryl stearate at a concentration of 2 mol/dm3, what are the concentrations of glycerol stearate, B, and of glycerine, D, when the conversion of sodium hydroxide is (a) 20% and (b) 90%?

Glyceryl Stearate (Chapter 2 AWFOS–S2)
Solution
Only the reactants NaOH and (C17 H35COO)3C3 H5 are initially present; therefore, ΘC = ΘD = 0.
For 20% conversion of NaOH
For 90% conversion of NaOH
Let us find CB
Oops!! Negative concentration—impossible! What went wrong?
Analysis: We purposely chose the wrong basis of calculation to make the point that we must choose the limiting reactant as our basis of calculation!! Ninety-percent conversion of NaOH is not possible because glyceryl stearate is the limiting reactant and is used up before 90% of the NaOH can be reacted. Glyceryl stearate should have been our basis of calculation and therefore we should not have divided the reaction as written by the stoichiometric coefficient of 3. It’s always important to make sure you learn something from a mistake, such as choosing the wrong basis of calculation. There is no such thing as failure, unless one fails to learn from it.
The basis of calculation must be the limiting reactant.
#LifeLesson!
4.2 Flow Systems
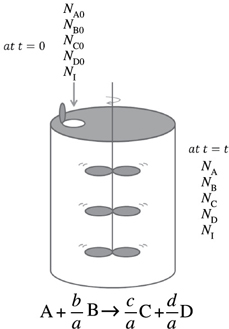
The form of the stoichiometric table for a continuous-flow system (see Figure 4-2) is virtually identical to that for a batch system (Table 4-1), except that we replace Nj0 by Fj0 and Nj by Fj (Table 4-2). Again taking A as the basis, we divide Equation (2-1) through by the stoichiometric coefficient of A to obtain
Figure 4-2 Flow reactor.
TABLE 4-2 STOICHIOMETRIC TABLE FOR A FLOW SYSTEM
Species |
Feed Rate to Reactor (mol/time) |
Change within Reactor (mol/time) |
Effluent Rate from Reactor (mol/time) |
A |
FA0 |
–FA0X |
FA = FA0 (1 – X) |
B |
FB0 = ΘBFA0 |
||
C |
FC0 = ΘCFA0 |
||
D |
FD0 = ΘDFA0 |
||
I |
FI0= ΘIFA0 |
– |
FI = FA0θI |
Totals |
FT0 |
||
FT = FT0 + δFA0 X |
Stoichiometric table for a flow system
where
and ΘC, ΘD, and ΘI are defined similarly
and, as before,
4.2.1 Equations for Concentrations in Flow Systems
For a flow system, the concentration CA at a given point can be determined from the molar flow rate FA and the volumetric flow rate υ at that point:
Definition of concentration for a flow system
Units of υ are typically given in terms of liters per second, cubic decimeters per second, or cubic feet per minute. We now can write the concentrations of A, B, C, and D for the general reaction given by Equation (2-2) in terms of their respective entering molar flow rates (FA0, FB0, FC0, FD0), the conversion, X, and the volumetric flow rate, υ.
We now focus on determining the volumetric flow rate, υ.
4.2.2 Liquid-Phase Concentrations
For liquids, the fluid volume change with reaction is negligible when no phase changes are taking place. Consequently, we can take
υ = υ0
Then
For liquids
CA = CA0(1 – X)
Therefore, for a given rate law we have –rA = g(X)
and so forth, for CC and CD.
Consequently, using any one of the rate laws in Chapter 3, we can now find –rA = f(X) for liquid-phase reactions. However, for gas-phase reactions the volumetric flow rate most often changes during the course of the reaction because of a change in the total number of moles or a change in temperature or pressure. Hence, one cannot always use Equation (4-13) to express concentration as a function of conversion for gas-phase reactions. No worries. In the next section we will sort this out.
4.2.3 Gas-Phase Concentrations
In our previous discussions, we considered primarily systems in which the reaction volume or volumetric flow rate did not vary as the reaction progressed. Most batch and liquid-phase and some gas-phase systems fall into this category. There are other systems, though, in which either V or υ does vary, and these will now be considered.
A situation where one encounters a varying flow rate occurs quite frequently in gas-phase reactions that do not have an equal number of product and reactant moles. For example, in the synthesis of ammonia
N2 + 3H2 ⇄ 2NH3
4 mol of reactants gives 2 mol of product. In flow systems where this type of reaction occurs, the molar flow rate will be changing as the reaction progresses. Because equal numbers of moles occupy equal volumes in the gas phase at the same temperature and pressure, the volumetric flow rate will also change.

#We’reGood The same stoichiometric table holds for both liquid-phase and gas-phase reactions.
In the stoichiometric tables presented on the preceding pages, it was not necessary to make assumptions concerning a volume change in the first four columns of the table (i.e., the species, initial number of moles or molar feed rate, change within the reactor, and the remaining number of moles or the molar effluent rate). All of these columns of the stoichiometric table are independent of the volume or density, and they are identical for constant-volume (constant-density) and varying-volume (varying-density) situations. Only when concentration is expressed as a function of conversion does variable density enter the picture.
Flow Reactors with Variable Volumetric Flow Rate. To derive the concentrations of each species in terms of conversion for a gas-phase flow system, we shall start by using the relationships for the total concentration. The total concentration, CT, at any point in the reactor is the total molar flow rate, FT, divided by the volumetric flow rate, υ (cf. Equation (4-10)). In the gas phase, the total concentration is also found from the gas law, CT = P/ZRT. Equating these two relationships gives
At the entrance to the reactor
Taking the ratio of Equation (4-14) to Equation (4-15) and assuming negligible changes in the compressibility factor occur, that is, Z ≅ Z0, during the course of the reaction, we have upon rearrangement
Gas-phase reactions
We can now express the concentration of species j for a flow system in terms of its flow rate, Fj, the temperature, T, and total pressure, P.
Use this gas-phase concentration equation for membrane reactors (Chapter 6) and for multiple reactions (Chapter 8).
The total molar flow rate is just the sum of the molar flow rates of each of the species in the system and is
We can also write Equation (4-17) in terms of the mole fraction of species j, yj, and the pressure ratio, p, with respect to the initial or entering conditions, that is, sub “0”
The molar flow rates, Fj, are found by solving the mole balance equations. The concentration given by Equation (4-17) will be used for measures other than conversion when we discuss membrane reactors (Chapter 6) and multiple gas-phase reactions (Chapter 8).
Now, let’s express the concentration in terms of conversion for gas flow systems. From Table 4-2, the total molar flow rate can be written in terms of conversion and is
FT = FT0 + FA0 δX
We divide this equation through by FT0
Then
where yA0 is the mole fraction of A at the inlet (i.e., (FA0/FT0)), and where δ is given by Equation (4-1) and ɛ is given by
Relationship between δ and ɛ
Equation (4-21) holds for both batch and flow systems. To interpret ɛ, let’s rearrange Equation (4-20) at complete conversion (i.e., X = 1 and FT = FTf)
Interpretation of ɛ
Substituting for (FT/FT0) in Equation (4-16) for the volumetric flow rate, υ, we have
Gas-phase volumetric flow rate
The concentration of species j in a flow system is
The molar flow rate of species j is
Fj = Fj0 + vj (FA0X) = FA0= (Θj + vjX)
where vj is the stoichiometric coefficient for species j, which is negative for reactants and positive for products. For example, for the reaction
νA = –1, νB = –b/a, νC = c/a, νD = d/a, and Θj = Fj0/FA0.
Substituting for the gas volumetric flow rate, υ, using Equation (4-23) and for Fj, we have
Rearranging
Gas-phase concentration as a function of conversion
Recall that yA0 = FA0/FT0, CA0 = yA0CT0, and ɛ is given by Equation (4-21) (i.e., ɛ = yA0δ).
The stoichiometric table for the gas-phase reaction (2-2) is given in Table 4-3.
TABLE 4-3 CONCENTRATIONS IN A VARIABLE-VOLUME GAS FLOW SYSTEM
At last!
We now have
Cj = hj (X)
and
–rA = g(X)
for variable-volume gas-phase reactions.
One of the major objectives of this chapter is to learn how to express any given rate law –rA as a function of conversion. The schematic diagram in Figure 4-3 helps to summarize our discussion on this point. The concentration of the reactant species B in the generic reaction is expressed as a function of conversion in both flow and batch systems for various conditions of temperature, pressure, and volume.
At last, by coupling Table 4-3 with the rate law for single gas-phase reactions, we obtain what we needed and used in Chapter 2 to size and sequence flow reactors, that is,
–rA = f(X)
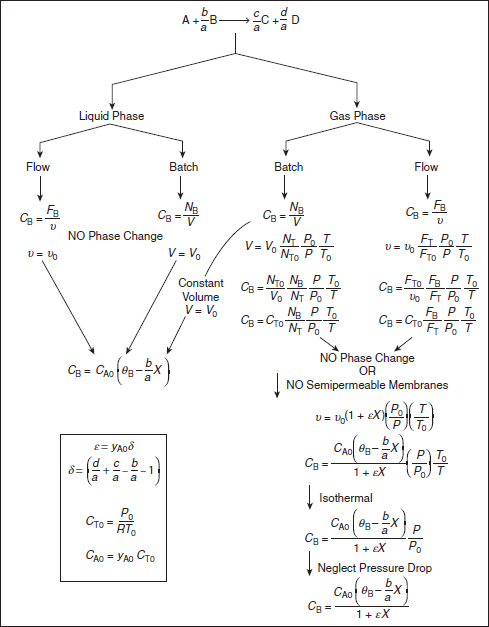
Figure 4-3 Expressing concentration as a function of conversion.
Example 4–3 Determining Cj = hj (X) for a Gas-Phase Reaction
A mixture of 28% SO2 and 72% air is charged to a flow reactor in which is oxidized.
2SO2 + O2 → 2SO3
First, set up a stoichiometric table using only the symbols (i.e., Θi, Fi ).
Next, prepare a second table evaluating the species concentrations as a function of conversion for the case when the total pressure is 1485 kPa (14.7 atm) and the temperature is constant at 227°C.
Evaluate the parameters and make a plot of each of the concentrations SO2, SO3, N2 as a function of conversion.
Solution
Stoichiometric table. Taking SO2 as the basis of calculation, we divide the reaction through by the stoichiometric coefficient of our chosen basis of calculation
The stoichiometric table is given in Table E4-3.1.
TABLE E4-3.1 STOICHIOMETRIC TABLE FOR
Species
Symbol
Initially
Change
Remaining
SO2
A
FA0
–FA0X
FA FA0 (1 – X)
O2
B
FB0 = ΘBFA0
SO3
C
0
+FA0X
FC = FA0X
N2
I
FI0 = ΘIFA0
–
FI = FI0 = ΘIFA0
Totals
FT0
Expressing the concentration as a function of conversion. From the definition of conversion, we substitute not only for the molar flow rate of SO2 (A) in terms of conversion but also for the volumetric flow rate as a function of conversion
Recalling Equation (4-23), we have
Neglecting pressure drop in the reaction, P = P0, yields
Neglecting pressure drop, P = P0, that is,
If the reaction is also carried out isothermally, T = T0, we obtain
υ = υ0(1 + ɛX)
Isothermal operation, T = T0
Similarly for B also with T = T0 and P = P0 (i.e., p = 1)
Parameter evaluation and plots of concentrations as a function of conversion. The inlet concentration of A is equal to the inlet mole fraction of A multiplied by the total inlet molar concentration. The total concentration can be calculated from an equation of state such as the ideal gas law. Recall that yA0 = 0.28, T0 = 500 K, and P0 = 1485 kPa.
The total concentration at constant temperature and pressure is

We now evaluate ɛ.
Initially, 72% of the total number of moles is air containing 21% O2 and 79% N2, along with 28% SO2.
Substituting for CA0 and ɛ in the species concentrations:
The concentrations of different species at various conversions are calculated in Table E4-3.2 and plotted in Figure E4-3.1. Note that the concentration of is changing even though it is an inert species in this reaction!! #Seriously?
TABLE E4-3.2 CONCENTRATION AS A FUNCTION OF CONVERSION
Ci (mol/dm3) |
||||||
Species |
X = 0.0 |
X = 0.25 |
X = 0.5 |
X = 0.75 |
X = 1.0 |
|
SO2 |
CA = |
0.100 |
0.078 |
0.054 |
0.028 |
0.000 |
O2 |
CB = |
0.054 |
0.043 |
0.031 |
0.018 |
0.005 |
SO3 |
CC = |
0.000 |
0.026 |
0.054 |
0.084 |
0.116 |
N2 |
CI = |
0.203 |
0.210 |
0.218 |
0.227 |
0.236 |
Total |
CT = |
0.357 |
0.357 |
0.357 |
0.357 |
0.357 |

Figure E4-3.1 Concentration as a function of conversion.
Note: Because the volumetic flow rate varies with conversion, υ = υ0(1 – 0.14X), the concentration of inerts (N2) is not constant.
Now we could use techniques presented in Chapter 2 to size reactors.
We are now in a position to express –rA as a function of X and use the techniques in Chapter 2 to size and sequence reactors. However, we will use a better method to solve CRE problems, namely a Table of Integrals (Appendix A) or the Polymath, MATLAB, Wolfram, or Python software, discussed in the next chapter.
Analysis: In this example, we first formed a stoichiometric table in terms of molar flow rates. We then showed how to express the concentrations of each species in a gas-phase reaction in which there is a change in the total number of moles. Next, we plotted each species concentration as a function of conversion and noted that the concentration of the inert, N2, was not constant but increased with increasing conversion because of the decrease in the total molar flow rate, FT, with conversion.
As previously mentioned many, if not most, rate laws for catalyst reactions are given in terms of partial pressures. Luckily, partial pressures are easily related to conversion with the aid of the ideal gas law and Equation (4-17).
The following equation is used when the mole balance is written in terms of molar flow rates:
However, when the mole balance is written in terms of conversion, we use Equation (4-25):
For example, the rate law for the hydrodemethylation of toluene (T) to form methane (M) and benzene (B) given by Equation (10-80) on page 483 can now be written in terms of conversion.
T + H2 → M + B
If you haven’t decided which computer to buy or borrow, or don’t have your integral tables, I suppose you could resort to the graphical techniques in Chapter 2 and use a Levenspiel plot, versus X, to achieve a specified conversion of toluene. However, that may put you at a severe disadvantage as other chemical reaction engineers will be using software packages (e.g., Poly-math) to solve chemical reaction engineering problems.
Example 4–4 Expressing the Rate Law for SO2 Oxidation in Terms of Partial Pressures and Conversions
The SO2 oxidation discussed in Example 4-3 is to be carried out over a solid platinum catalyst. As with almost all gas–solid catalytic reactions, the catalytic rate law is expressed in terms of partial pressures instead of concentrations. The rate law for this SO2 oxidation was found experimentally to be1
1 O. A. Uychara and K. M. Watson, Ind. Engrg. Chem, 35, 541.
where Pi (kPa, bar, or atm) is the partial pressure of species i.
The reaction is to be carried out isothermally at 400°C. At this temperature, the rate constant k per gram of catalyst (g-cat), the adsorption constants for O2 () and SO2 (), and the pressure equilibrium constant, KP, were experimentally found to be
k = 9.7 mol SO2/atm3/2/h/g-cat
The total pressure and the feed composition (e.g., 28% SO2) are the same as in Example 4-3. Consequently, the entering partial pressure of SO2 is 4.1 atm. There is virtually no pressure drop in this reactor.
Write the rate law as a function of conversion evaluating all other parameters.
Prepare a Levenspiel plot by sketching the reciprocal rate [1/(−rA)] as a function of X up to the equilibrium conversion Xe, and note where the rate goes to zero and [1/(–rA)] goes to infinity.
Solution
Part (a)
No Pressure Drop and Isothermal Operation
For SO2
First we need to recall the relationship between partial pressure and concentration, followed by the relationship between concentration and conversion. Because we know how to express concentration as a function of conversion, we therefore know how to express partial pressure as a function of conversion.
For no pressure drop P = P0, that is, p = 1
For SO3
For O2
From Example 4-3
ΘB = 0.54
Factoring out in Equation (E4-4.5) gives
From Equation (E4-3.5)
Substitute for the partial pressure in the rate-law equation (E4-4.1)
with k = 9.7 mol SO2/atm3/2/h/g-cat PSO2,0 = 4.1 atm, = 8.3 atm 3/2
Part (b)
We can now use Equation (E4-4.8) to plot the reciprocal rate as a function of X as shown in Figure E4-4.1 to design a packed-bed catalytic reactor. We note at the equilibrium conversion, Xe, the reciprocal rate goes to infinity. We could now use a Levenspiel plot to find the catalyst weight W in a packed-bed reactor (PBR) to achieve a specified conversion.
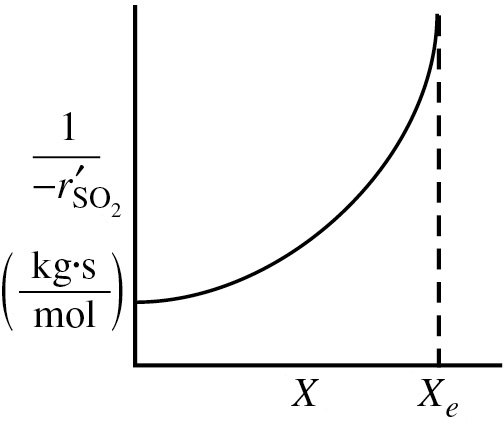
Figure E4-4.1 Reciprocal rate of SO2 oxidation as a function of conversion.
Levenspiel plots are useful for conceptually visualizing the differences in reactor sizes and the sequencing of reactors. However, we will see in Chapter 5 that using numerical software packages are so much better ways to solve for the catalysis weight, W, than using Levenspiel plots. For example, we would couple Equation (E4-4.8) with Equation (2-17) and use an ordinary differential equation (ODE) solver, such as Polymath or MATLAB, to find the conversion X as a function of catalyst weight W. So, be sure to buy, rent, or borrow a laptop computer before attempting to solve the problems in Chapter 5 and beyond.
Analysis: In most heterogeneous catalytic reactions, rate laws are expressed in terms of partial pressures instead of concentration. However, we see that through the use of the ideal gas law we could easily express the partial pressure as a function of concentration then use the stoichiometric table and conversion in order to express the rate law as a function of conversion. In addition, for most all heterogeneous reactions you will usually find a term like (1 + KAPA + KBPB + . . .) in the denominator of the rate law, as will be explained in Chapter 10.
4.3 Reversible Reactions and Equilibrium Conversion
Thus far in this chapter, we have focused mostly on irreversible reactions. The procedure one uses for the isothermal reactor design of reversible reactions is virtually the same as that for irreversible reactions, with one notable exception: the maximum conversion that can be achieved at the reaction temperature is the equilibrium conversion, Xe. In the following example, it will be shown how our algorithm for reactor design is easily extended to reversible reactions.
Need to first calculate Xe
Example 4–5 Calculating the Equilibrium Conversion
The reversible gas-phase decomposition of nitrogen tetroxide, N2O4, to nitrogen dioxide, NO2,
N2O4 ⇄ 2NO2
Nitrogen Tetroxide
is to be carried out at constant temperature. The feed consists of pure N2O4 at 340 K and 202.6 kPa (2 atm). The concentration equilibrium constant, KC, at 340 K is 0.1 mol / dm3 and the rate constant and the rate constant is 0.5 min–1.
Set up a stoichiometric table and then calculate the equilibrium conversion of N2O4 in a constant-volume batch reactor.
Set up a stoichiometric table and then calculate the equilibrium conversion of N2O4 in a flow reactor.
Assuming the reaction is elementary, express the rate of reaction solely as a function of conversion for a flow system and for a batch system.
Determine the CSTR volume necessary to achieve 80% of the equilibrium conversion.
Solution
N2O4 ⇄ 2NO2
A ⇄ 2B
At equilibrium, the concentrations of the reacting species are related by the relationship dictated by thermodynamics (cf. see Equation (3-10) and Appendix C).
Batch system—constant volume, V = V0.
TABLE E4-5.1 STOICHIOMETRIC TABLE FOR BATCH REACTOR
Species
Symbol
Initially
Change
Remaining
N2O4
A
NA0
–NA0X
NA = NA0(1 – X)
NO2
B
0
+2NA0X
NB = 2NA0X
NT0 = NA0
NT = NT0 + NA0X
Living Example Problem
For batch systems Ci = Ni/V
At equilibrium in a batch reactor, X = Xeb, we substitute Equations (E4-5.2) and (E4-5.3) into Equation (E4-5.1)
(math-math-math-math) to get
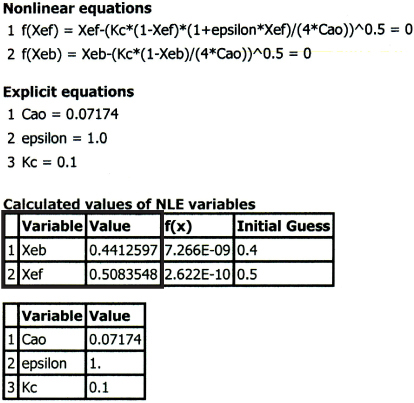
We will use the software package Polymath to solve for the equilibrium conversion and let Xeb represent the equilibrium conversion in a constant-volume batch reactor. Equation (E4-5.4) written in Polymath format becomes
f(Xeb) = Xeb – [Kc* (1 – Xeb)/(4*Cao)] ^0.5
The Polymath program and solution are given in Table E4-5.2.
When looking at Equation (E4-5.4), you probably asked yourself, “Why not use the quadratic formula to solve for the equilibrium conversion in both batch and flow systems?” That is from Equation (E4-5.4) we would have
and from Equation (E4-5.8) we would have
There is a Polymath tutorial in the Summary Notes for Chapter 1 on the CRE Web site.
The answer is that future problems will be nonlinear and require Polymath solutions; therefore, this simple exercise increases the reader’s ease in using Polymath.
TABLE E4-5.2 POLYMATH PROGRAM AND SOLUTION FOR BOTH BATCH AND FLOW SYSTEMS
Polymath Tutorial Chapter 1

As seen in Table E4-5.2, the equilibrium conversion in a constant-volume batch reactor (Xeb) is
Note: A tutorial on Polymath can be found in the summary notes for Chapter 1 and on the CRE Web site (www.umich.edu/~elements/6e/tutorials/Polymath_LEP_tutorial.pdf).
Flow system. The stoichiometric table is the same as that for a batch system except that the number of moles of each species, Ni, is replaced by the molar flow rate of that species, Fi.
For constant temperature and pressure, the volumetric flow rate υ = υ0(1 + ɛX), is and the resulting concentrations of species A and B are
TABLE E4-5.3 STOICHIOMETRIC TABLE FOR CONTINUOUS-FLOW REACTOR
Species
Symbol
Entering
Change
Leaving
N2O2
A
FA0
–FA0X
FA = FA0(1–X)
NO2
B
0
+2FA0X
FB = 2FA0X
FT = FA0
FT = FT0 + FA0 X
At equilibrium, X = Xef, we can substitute Equations (E4-5.5) and (E4-5.6) into Equation (E4-5.1) to obtain the expression
Simplifying gives
Rearranging to use Polymath yields
For a flow system with pure N2O4 feed, ɛ = yA0 δ = 1(2–1)=1.
We shall let Xef represent the equilibrium conversion in a flow system. Equation (E4-5.8) written in the Polymath format becomes
This solution is also shown in Table E4-5.3 .
Note that the equilibrium conversion in a flow reactor (i.e., Xef = 0.51), with no pressure drop, is greater than the equilibrium conversion in a constant-volume batch reactor (Xeb = 0.44). Recalling Le Châtelier's principle, can you suggest an explanation for this difference in Xe? This example is continued in Problem P4-1A (a). Be sure to use Wolfram and/or Python in the Living Example Problems (LEPs) to see how the ratio (Xeb/Xef ) varies with ɛ and CT0.
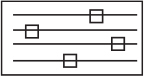
LEP Sliders
Rate laws. Assuming that the reaction follows an elementary rate law, then
For a constant volume (V = V0) batch system
Here, CA = NA/V0 and CB = NB/V0. Substituting Equations (E4-5.2) and (E4-5.3) into the rate law, we obtain the rate of disappearance of A as a function of conversion
–rA =f(X) for a batch reactor with V = V0
For a flow system
Here, CA = FA/υ and CB = FB/υ with υ = υ0 (1 + ɛX). Consequently, we can substitute Equations (E4-5.5) and (E4-5.6) into Equation (E4-5.9) to obtain
–rA = f (X) for a flow reactor
As expected, the dependence of reaction rate on conversion, that is, –rA = f(X), for a constant-volume batch system (i.e., Equation (E4-5.10)) is different than that for a flow system (Equation (E4-5.11)) for gas-phase reactions.
If we substitute the values for CA0, KC, ɛ, and kA = 0.5 min–1 in Equation (E4-5.11), we obtain –rA solely as a function of X for the flow system.
We can now use Equation (E4-5.12) to prepare our Levenspiel plot to find either the CSTR or PFR volume.
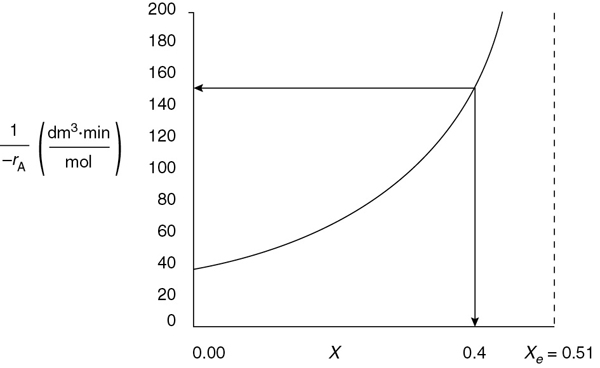
Figure E4-5.1 Levenspiel plot for a flow system.
Xe = 0.51
We see as we approach equilibrium, Xe = 0.51, –rA goes to zero and (1/–rA) goes to infinity.
CSTR volume. Just for fun (and this really is fun), let’s fast forward and calculate the CSTR reactor volume necessary to achieve 80% of the equilibrium conversion of 51% (i.e., X = 0.8Xe = (0.8)(0.51) = 0.4) for a molar feed rate of A of 3 mol/min.
Plotting the reciprocal of Equation (E4-5.12) to obtain Levenspiel plot as we did in Chapter 2, it can be seen in Figure E4-5.1 when X = 0.4 then as
then for FA0 = 3 mol/min

Keeping an eye on things to come
A quicker way to find the CSTR volume, rather than drawing a Levenspiel plot, is to simply evaluate Equation (E4-5.12) at X = 0.4
Using Equation (2-13), we can now find the reactor volume
The CSTR volume required to achieve 40% conversion is 0.171 m3. See Problem P4-1A (b) to calculate the PFR volume.
Analysis: The purpose of this example was to calculate the equilibrium conversion first for a constant-volume batch reactor in part (a), and then for a constant pressure flow reactor in part (b). One notes that there is a change in the total number of moles in this reaction and, as a result, these two equilibrium conversions (batch and flow) are not the same!! We next showed in part (c) how to express –rA = f(X) for a reversible gas-phase reaction. Here we noted that the equations for the reaction-rate laws as a function of conversion, that is, –rA = f(X), are different for batch and flow reactors. Finally, in Part (d) having –rA = f(X), we specified a molar flow rate of A (i.e., 3.0 mol A/min) and calculated the CSTR volume necessary to achieve 40% conversion. We did this calculation to give insight to the types of analyses we, as chemical reaction engineers, will carry out as we move into similar but more complex calculations in Chapters 5 and 6.
4.4 And Now... A Word from Our Sponsor–Safety 4 (AWFOS–S4 The Swiss Cheese Model)
The Swiss Cheese Model shown in Figure 4-4 is another risk assessment tool, one that offers a deeper understanding into the layers of protection for chemical processes. This section (i.e., 4.4) is presented to give an overview of the model while the Process Safety Across the Chemical Engineering Curriculum Web site (http://umich.edu/~safeche/swiss_cheese.html) gives more in-depth explanation. A layer of protection is either a preventative action put in place to reduce the chance that an incident will occur, or a mitigating action put in place to lessen the severity of an accident. These layers of protection can include using inherently safer designs, following proper lab procedures, wearing adequate personal protective equipment (PPE), and having an emergency response plan.
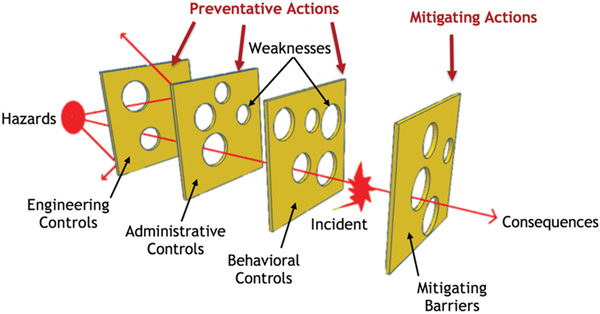
Figure 4-4 Swiss Cheese Model.
Even with the different levels or layers of protection, represented in Figure 4-4 as Swiss cheese slices, there is a possibility that a hazard will result in an incident. For an incident to occur, there must be vulnerability in each layer of protection, represented by holes in the slices of cheese. A hole is a weakness in that layer of protection (e.g., a backup cooling system, a faulty pressure relief valve). The size and number of holes in the cheese represent the relative lack of reliability of that layer. This model illustrates the importance of having redundant and strong protective layers so that hazards do not pass through multiple protective actions undetected and unresolved.
Understanding and implementing each protective level is important when running a chemical process. Table 4-4 shows and discusses each of the three control “cheese” slices (i.e., Engineering, Administrative, and Behavioral) while Table 4-5 shows and discusses the mitigating barriers.
TABLE 4-4 PREVENTATIVE ACTIONS
Engineering Controls |
Administrative Controls |
Behavioral Controls |
Engineering controls involve preventative actions that are designed into the system, for example, pressure relief valves on heat exchangers. |
Administrative controls involve managerial actions taken to ensure everyone involved in the process possesses the same knowledge of the established safety procedures, for example, Management of Change (MoC) procedures: Before making a change to a process, employees are required to identify, review, and approve modifications to ensure changes are implemented safely. |
Behavioral controls focus on actions that individuals can take to prevent an accident from occurring by using proper tools, and following lab procedures, MoC and safety checklists as instructed. |
TABLE 4-5 MITIGATING ACTIONS
Mitigating Barriers |
These barriers focus on actions that lessen the severity or impact of an accident, for example, having an emergency response plan, wearing personal protective equipment (PPE), or the installation of a fire suppression system. |
Engineering Controls, Administrative Controls, and Behavioral Controls represent Preventative Actions designed to reduce the likelihood of an incident occurring, while Mitigating Barriers represent Mitigating Actions designed to lessen the impact or severity of an incident. It’s important to recognize that all of these layers of protection will have some weaknesses.
The main purpose of the Swiss Cheese Model is to visualize the vulnerability and how a hazard may be able to pass through the many different preventative actions in place.
Further Reading on the Swiss Cheese Model:
Board, U.S. Chemical Safety and Hazard Investigation. Fire at Praxair St. Louis: Dangers of Propylene Cylinders. Washington DC, 2006.
D. Hatch, P. McCulloch, and I. Travers. “Visual HAZOP,” Chem. Eng., (917), 27–32 (2017, November).
USCSB. “CSB Safety Video: Dangers of Propylene Cylinders.” Online video clip. YouTube, 10 October 2007. Web. 8 May 2018.
Closure. Having completed this chapter, you should be able to write the rate law solely in terms of conversion and the reaction-rate parameters, (e.g., k, KC) for both liquid-phase and gas-phase reactions. Once expressing –rA = f(X) is accomplished, you can proceed to use the techniques in Chapter 2 to calculate reactor sizes and conversion for single CSTRs, PFRs, and PBRs, as well as those connected in series. However, in Chapter 5 we will show you how to carry out these calculations much more easily by instead using a Table of Integrals or software such as Polymath, MATLAB, Python, or Wolfram without having to resort to Levenspiel plots. After studying this chapter, you should also be able to calculate the equilibrium conversion for both constant-volume batch reactors and for constant-pressure flow reactors. We have now completed the following building blocks of our CRE tower.

In Chapter 5, we will focus on the fourth and fifth blocks: Combine and Evaluate. In Chapter 5, we will focus on the combine and evaluation building blocks, which will then complete our algorithm for isothermal chemical reactor design.
The CRE Algorithm
Summary
The stoichiometric table for the reaction given by Equation (S4-1) being carried out in a flow system is
In the case of ideal gases, Equation (S4-3) relates volumetric flow rate to conversion.
Batch reactor constant volume: V = V0
Flow systems: Gas:
Liquid: ()
Species
Entering
Change
Leaving
A
FA0
–FA0X
FA0(1 = X)
B
FB0
C
FC0
D
FD0
I
FI0
- - -
FI0
Totals
FT0
δFA0X
FT = FT0 +δFA0X
Definitions of δ and ɛ: For the general reaction given by Equation (S4-1), we have
and
For incompressible liquids or for batch gas-phase reactions taking place in a constant volume, V = V0, the concentrations of species A and C in the reaction given by Equation (S4-1) can be written as
Equations (S4-7) and (S4-8) also hold for gas-phase reactions carried out in constant-volume batch reactors.
For gas-phase reactions in continuous-flow reactors, we use the definition of concentration (CA = FA/υ) along with the stoichiometric table and Equation (S4-3) to write the concentration of A and C in terms of conversion.
In terms of gas-phase molar flow rates, the concentration of species i is
Equation (S4-11) must be used for membrane reactors (Chapter 6) and for multiple reactions (Chapter 8).
Many catalytic rate laws are given in terms of partial pressure, for example,
The partial pressure is related to conversion through the stoichiometric table. For any species “i” in the reaction
For species A
Substituting in the rate law
CRE Web Site Materials (http://www.umich.edu/~elements/6e/04chap/obj.html#/)
Interactive Computer Games (http://umich.edu/~elements/6e/icm/index.html) Quiz Show II Jeopardy (http://umich.edu/~elements/6e/icm/kinchal2.html). A Jeopardy Game competition between AIChE student chapters is held at the annual AIChE meeting.

Questions and Problems
The subscript to each of the problem numbers indicates the level of difficulty: A, least difficult; D, most difficult.
A = • B = ▪ C = ♦ D = ♦♦
Questions
Q4-1A QBR (Question Before Reading). What are the differences in writing the concentrations as a function of conversion for gas-phase and liquid-phase reactions?
Q4-2A i>clicker. Go to the Web site (http://www.umich.edu/~elements/6e/04chap/iclicker_ch4_q1.html) and view at leave five i>clicker questions. Choose one that could be used as is, or a variation thereof, to be included on the next exam. You also could consider the opposite case, explaining why the question should not be on the next exam. In either case, explain your reasoning.
Q4-3A Example 4-1. Would the example be correct if water were considered an inert? Explain.
Q4-4A Example 4-2. How would the answer change if the initial concentration of glyceryl stearate were 3 mol/dm3? Rework Example 4-2 correctly using the information given in the problem statement.
Q4-5A Example 4-3. Under what conditions will the concentration of the inert nitrogen be constant? Plot Equation (E4-5.2) in terms of (1/–rA) as a function of X up to value of X = 0.99. What did you find?
Q4-6A Can you name the English rock group that was famous worldwide in the 1970s and 1980s and whose lead singer was Freddie Mercury? The group had a resurgence in 2019 when Adam Lambert took over for Freddie, who had died in 1991. Hint: See Problem P5-22A.
Q4-7A What did you learn from the Swiss Cheese Model (e.g., make a list)?
Q4-8A Go to the LearnChemE screencast link for Chapter 4 (http://www.umich.edu/~elements/6e/04chap/learn-cheme-videos.html).
View one or more of the screencast 5- to 6-minute videos and write a two-sentence evaluation.
What did the screencast do well and what could be improved?
Q4-9A AWFOS–S4 Swiss Cheese Model.
What is the main purpose of implementing the Swiss Cheese Model in a workplace?
Categorize engineering controls, administrative controls, behavioral controls, and mitigating barriers as preventative actions or mitigating actions. List an example of each.
What happens when all of the weaknesses/vulnerabilities in the controls/barriers line up?
What was the takeaway lesson from this safety section?
Computer Simulations and Experiments
P4-1A (a) Example 4-4: SO2 Oxidation
Wolfram and Python
Vary ΘB and observe the change in reaction rate. Go to the extremes and explain what is causing the curve to change the way it does.
Vary the parameters and list the parameters that have the greatest and the least effect on the reaction rate.
Write a set of conclusions about the experiments you carried out by varying the sliders in parts (i) through (iii).
Polymath
Using the molar flow rate of SO2 (A) of 3 mol/h and Figure E4-4.1, calculate the fluidized bed (i.e., CSTR catalyst weight) necessary for 40% conversion.
Next, consider the entering flow rate of SO2 is 1000 mol/h. Plot (FA0/–rA) as a function of X to determine the fluidized bed catalyst weight necessary to achieve 30% conversion, and 99% of the equilibrium conversion, that is, X = 0.99 Xe.
(b) Example 4-5: Equilibrium Conversion
Using Figure E4-5.1 and the methods in Chapter 2, estimate the PFR volume for 40% conversion for a molar flow rate of A of 5 dm3/min.
Using Figure E4-5.1 and the methods in Chapter 2, estimate the time to achieve 40% conversion in a batch reactor when the initial concentration is 0.05 mol/dm3.
Wolfram and Python
What values of KC and CA0 cause Xef to be the farthest away from Xeb?
What values of KC and CA0 will cause Xeb and Xef to be the closest together?
Observe the plot of the ratio of as a function of yA0. Vary the values of KC and CT0. What conclusions can you draw?
Write a set of conclusions from your experiment (i) through (vi).
Interactive Computer Games
P4-2A Load the Interactive Computer Games (ICG) Kinetic Challenge from the CRE Web site. Play the game and then record your performance number for the module that indicates your mastering of the material. Your professor has the key to decode your performance number. ICG Kinetics Challenge Performance # ______________.
A Jeopardy Game competition between AIChE student chapters is held at the annual AIChE meeting. You might find one of these questions asked.
Kinetics Challenge II
Rate |
Law |
Stoich |
100 |
100 |
100 |
200 |
200 |
200 |
300 |
300 |
300 |
Problems
P4-3A The elementary reversible reaction
2A ⇄ B
is carried out in a flow reactor where pure A is fed at a concentration of 4.0 mol/dm3. If the equilibrium conversion is found to be 60%,
What is the equilibrium constant, KC if the reaction is a gas-phase reaction? (Ans: Gas: KC = 0.328 dm3/mol)
What is the KC if the reaction is a liquid-phase reaction? (Ans: Liquid: KC = 0.469 dm3/mol)
Write =rA solely as a function of conversion (i.e., evaluating all symbols) when the reaction is an elementary, reversible, gas-phase, isothermal reaction with no pressure drop with kA = 2 dm6/mol•s and KC = 0.5 all in proper units.
Repeat (c) for a constant-volume batch reactor.
P4-4B Stoichiometry. The elementary gas reaction
2A + B → C
is carried out isothermally in a PFR with no pressure drop. The feed is equal molar in A and B, and the entering concentration of A is 0.1 mol/dm3. Set up a stoichiometric table and then determine the following.
What is the entering concentration (mol/dm3) of B?
What are the concentrations of A and C (mol/dm3) at 25% conversion of A?
What is the concentration of B (mol/dm3) at 25% conversion of A? (Ans: CB = 0.1 mol/dm3)
What is the concentration of B (mol/dm3) at 100% conversion of A?
If at a particular conversion the rate of formation of C is 2 mol/min/dm3, what is the rate of formation of A at the same conversion?
Write =rA solely as a function of conversion (i.e., evaluating all symbols) when the reaction is an elementary, irreversible, gas-phase, isothermal reaction with no pressure drop with an equal molar feed and with CA0 = 2.0 mol/dm3 at, kA = 2 dm6/mol•s.
What is the rate of reaction at X = 0.5?
P4-5A Set up a stoichiometric table for each of the following reactions and express the concentration of each species in the reaction as a function of conversion, evaluating all constants (e.g., =, =). Next, assume the reaction follows an elementary rate law, and write the reaction rate solely as a function of conversion, that is, –rA = f(X).
For the liquid-phase reaction

the entering concentrations of ethylene oxide and water, after mixing the inlet streams, are 16.13 and 55.5 mol/dm3, respectively. The specific reaction rate is k = 0.1 dm3/mol · s at 300 K with E = 12500 cal/mol.
After finding –rA = f(X), calculate the CSTR space-time, τ, for 90% conversion at 300 K and also at 350 K.
If the volumetric flow rate is 200 liters per second, what are the corresponding reactor volumes? (Ans: At 300 K: V = 439 dm3 and at 350 K: V = 22 dm3)
For the isothermal gas-phase pyrolysis
C2H6 → C2H4 = H2
pure ethane enters a flow reactor at 6 atm and 1100 K, with ΔP = 0. Set up a stoichiometric table and then write –rA = f(X). How would your equation for the concentration and reaction rate, that is, –rA = f(X), change if the reaction were to be carried out in a constant-volume batch reactor?
For the isothermal, isobaric, catalytic gas-phase oxidation
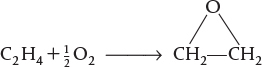
the feed enters a PBR at 6 atm and 260°C, and is a stoichiometric mixture of only oxygen and ethylene. Set up a stoichiometric table and then write as a function of partial pressures. Express the partial pressures and as a function of conversion for (1) a fluidized batch reactor and (2) a PBR. Finally, write solely as a function of the rate constant and conversion.
Set up a stoichiometric table for the isothermal, catalytic gas-phase reaction carried out in a fluidized CSTR.


The feed is stoichiometric and enters at 6 atm and 170°C. What catalyst weight is required to reach 80% conversion in a fluidized CSTR at 170°C and at 270°C? The rate constant is defined with respect to benzene and υ0 = 50 dm3/min.
First write the rate law in terms of partial pressures and then express the rate law as a function of conversion. Assume ΔP ≡ 0.
P4-6A Orthonitroanaline (an important intermediate in dyes—called fast orange) is formed from the reaction of orthonitrochlorobenzene (ONCB) and aqueous ammonia (see explosion in Figure E13-2.1 in Example 13-2).
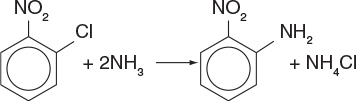
The liquid-phase reaction is first order in both ONCB and ammonia with k = 0.0017 m3/kmol · min at 188°C with E = 11273 cal/mol. The initial entering concentrations of ONCB and ammonia are 1.8 and 6.6 kmol/m3, respectively (more on this reaction in Chapter 13).
Set up a stoichiometric table for this reaction for a flow system.
Write the rate law for the rate of disappearance of ONCB in terms of concentration.
Explain how parts (a) and (b) would be different for a batch system.
(d) Write –rA solely as a function of conversion.
–rA = ______ What is the initial rate of reaction (X = 0)
at 188°C? –rA = ______ at 25°C? –rA = ______ at 288°C? –rA = ______ What is the rate of reaction when X = 0.90
at 188°C? –rA = ______ at 25°C? –rA = ______ at 288°C? –rA = ______ What would be the corresponding CSTR reactor volume at 25°C to achieve 90% conversion and at 288°C for a feed rate of 2 dm3/min
at 25°C? V = ______ at 288°C? V = ______
P4-7B OEQ (Old Exam Question). Consider the following elementary gas-phase reversible reaction to be carried out isothermally with no pressure drop and for an equal molar feed of A and B with CA0 = 2.0 mol/dm3.
2A + B ⇄ C
What is the concentration of B initially? CB0 = ____ (mol/dm3)
What is the limiting reactant? ______
What is the exit concentration of B when the conversion of A is 25%? CB = _____ (mol/dm3)
Write –rA solely as a function of conversion (i.e., evaluating all symbols) when the reaction is an elementary, reversible, gas-phase, isothermal reaction with no pressure drop with an equal molar feed and with CA0 = 2.0 mol/dm3, kA = 2 dm6/mol2•s, and KC = 0.5 all in proper units –rA = ____.
What is the equilibrium conversion?
What is the rate when the conversion is
0%?
50%?
0.99 Xe?
P4-8B OEQ (Old Exam Question). The gas-phase reaction
is to be carried out isothermally first in a flow reactor. The molar feed is 50% H2 and 50% N2, at a pressure of 16.4 atm and at a temperature of 227°C.
Construct a complete stoichiometric table.
Express the concentrations in mol/dm3 of each for the reacting species as a function of conversion. Evaluate CA0,δ, and ɛ, and then calculate the concentrations of ammonia and hydrogen when the conversion of H2 is 60%. (Ans: )
Suppose by chance the reaction is elementary with . Write the rate of reaction solely as a function of conversion for (1) a flow reactor and for (2) a constant-volume batch reactor.
P4-9B OEQ (Old Exam Question). There were 820 million pounds of phthalic anhydride produced in the United States in 1995. One of the end uses of phthalic anhydride is in the fiberglass of sailboat hulls. Phthalic anhydride can be produced by the partial oxidation of naphthalene in either a fixed or a fluidized catalytic bed. A flow sheet for the commercial process is shown below. Here, the reaction is carried out in fixed bed reactor with a vanadium pentoxide catalyst packed in 25 mm diameter tubes. A production rate of 31,000 tons per year would require 15,000 tubes.

Assume the reaction is first order in oxygen and second order in naphthalene with kN = 0.01 dm6/mol2/s.
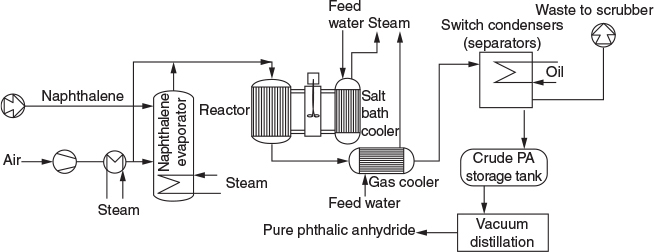
Adapted from Process Technology and Flowsheet Volume II. Reprints from Chemical Engineering, McGraw Hill Pub. Co., p. 111.
Set up a stoichiometric table for this reaction for an initial mixture of 3.5% naphthalene and 96.5% air (mol %), and use this table to develop the relations listed in parts (b) and (c). The initial/entering pressure and temperature are P0 = 10 atm and T0 = 500 K.
Express the following solely as a function of the conversion of naphthalene, X for a constant-volume isothermal batch reactor V = V0. (1) The concentration of O2, CO2. (2) The total pressure P. (3) The rate of reaction, –rN. (4) Then calculate the time to achieve 90% conversion.
Repeat (b) for an isothermal flow reactor to find CO2, volumetric flow rate and the reaction rate –rN as a function of conversion.
What CSTR and PFR volumes are necessary to achieve 98% conversion of naphthalene for an entering volumetric flow rate of 10 dm3/s.
Write a few sentences about the above flow sheet to manufacture phthalic anhydride.
P4-10B OEQ (Old Exam Question). The elementary reversible reaction
2A ⇄ B
is carried out isothermally in a flow reactor with no pressure drop and where pure A is fed at a concentration of 4.0 mol/dm3. If the equilibrium conversion is found to be 60%
What is the equilibrium constant, KC, if the reaction occurs in the gas phase?
What is the KC if the reaction is a liquid-phase reaction?
P4-11B Consider the elementary gas-phase reversible reaction is carried out isothermically
A ⇄ 3C
Pure A enters at a temperature of 400 K and a pressure of 10 atm. At this temperature, KC = 0.25(mol/dm3)2. Write the rate law and then calculate the equilibrium conversion for each of the following situations:
The gas-phase reaction is carried out in a constant-volume batch reactor.
The gas-phase reaction is carried out in a constant-pressure batch reactor.
Can you explain the reason why there would be a difference in the two values of the equilibrium conversion?
P4-12B Repeat parts (a)–(c) of Problem P4-11B for the reaction
3A ⇄ C
Pure A enters at 400 K, 10 atm and the equilibrium constant is KC = 2.5 (dm3/mol)2.
Compare the equilibrium conversions in Problems P4-11B and P4-12B. Explain the trends, for example, is Xe for constant pressure always greater than Xe for constant volume? Explain the reasons for the similarities and differences in the equilibrium conversions in the two reactions.
P4-13C OEQ (Old Exam Question). Consider a cylindrical batch reactor that has one end fitted with a frictionless piston attached to a spring (Figure P4-13C). The reaction
A + B → 8C
with the rate law

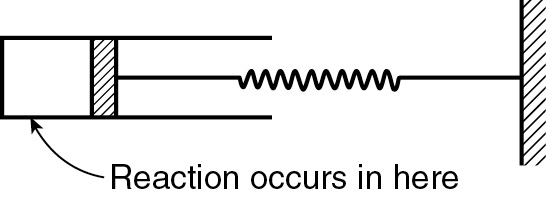
Figure P4-13C
is taking place in this type of reactor.
Write the rate law solely as a function of conversion, numerically evaluating all possible symbols. (Ans: –rA = 5.03 × 10⁻⁹ [(1 − X)3/(1 + 3X)3/2] lb mol/ft3·s.)
What is the conversion and rate of reaction when V = 0.2 ft3? (Ans: X = 0.259, –rA = 8.63 × 10⁻¹⁰ lb mol/ft3·s.)
Additional information:
Equal moles of A and B are present at t = 0
Initial volume: 0.15 ft3
Value of k1: 1.0 (ft3/lb mol)2=s·–1
The spring constant is such that the relationship between the volume of the reactor and pressure within the reactor is
V = (0.1)(P) (V in ft3, P in atm)
Temperature of system (considered constant): 140°F
Gas constant: 0.73 ft3·atm/lb mol·°R
Supplementary Reading
Further elaboration of the development of the general balance equation may be found on the CRE Web site www.umich.edu/~elements/6e/index.html and also may or may not be found in
G. KEILLOR AND T. RUSSELL, Dusty and Lefty: The Lives of the Cowboys (Audio CD), St. Paul, MN: Highbridge Audio, 2006.
R. M. FELDER, R. W. ROUSSEAU, and L. G. Bullard, Elementary Principles of Chemical Processes, 4th ed. Global Edition, Singapore: John Wiley & Sons Singapore PTE Ltd., 2017, Chap. 4.