
Chapter 10
Data Orchestration
I always try not to overload my music with orchestration and to use only those instruments that are absolutely necessary.
—Abel Korzeniowski
The term data orchestration has gained popularity among many groups, including cloud and datacenter specialists who deal with lots of data. This increasing popularity of data orchestration is due to challenges that have occurred as data increases in volume and velocity. One challenge is expecting an analyst to be able to view and understand large amounts of data. Even tools such as security information and event management (SIEM) can quickly overwhelm an analyst with event data, the alarms for which represent consolidated events that take time to investigate. Another challenge is choosing the best response to an event when there are many factors to consider, mixed with too many events occurring at once that need prompt attention. As public cloud and threat intelligence resources are introduced into the SOC, more effort is required to tune data, leading to more work based on technology upkeep. These types of challenges are causing SOCs to experience a reduction in productivity, the response to which is to invest heavily in data orchestration.
Chapter 5, “Centralizing Data,” covered various types of data that SOCs can leverage as well as how to centralize that data to simplify visibility across multiple tools. What Chapter 5 did not cover is how to take action on that data. This chapter focuses on how to put data to use through automation and orchestration. The security industry calls this security orchestration, automation, and response (SOAR), which integrates the data collection concepts covered in Chapter 5 and the incident response concepts covered in Chapter 8, “Threat Hunting and Incident Response,” and focuses on automating through orchestration. This chapter also covers required concepts and skills necessary to leverage SOAR technology such as playbooks and DevOps. There is a lot involved with SOAR technology, which this chapter breaks down into more digestible modules.
Note
In this chapter, you will also see coverage of cross-layered detection and response (XDR), which has many of the same capabilities offered by SOAR technology.
Before defining what SOAR is, a logical place to start is to look at what is involved with data orchestration, a fundamental component of SOAR.
Introduction to Data Orchestration
A key takeaway from Chapter 5 and Chapter 7, “Threat Intelligence,” is that the value of data is judged based on how it is used and understood. Data is used and understood based on its situational context. A basic example of the concept can be seen in John Boyd’s OODA loop, which is a strategy for responding to events. The OODA loop states that one observes, orients, decides, and acts based on feedback, meaning (in this book’s example) how a SOC responds to a situation. Feedback, as referenced by the OODA loop, means applying the context of new data received to adjust one’s response, which can be interpreted as viewing the available data from security tools, threat intelligence, and input from SOC analysts. Simply put, a SOC needs to obtain the right data to understand and respond to a situation properly. Figure 10-1 shows a simple OODA loop diagram.
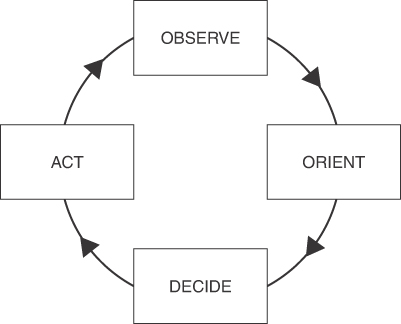
FIGURE 10-1 OODA Loop Diagram
Chapter 5 covered how to consume various types of data, including leveraging a SIEM solution to be a centralized view of data. What Chapter 5 did not cover is how to take action based on the feedback—the act part of the OODA loop. Many SOCs are finding that their processes for collecting and interpreting data are ineffective for keeping up with the number of cases that they are responsible for, leading to very slow responses to requests and delayed reactions to events. As a result of this problem, SOCs are seeking solutions that enable their SOC services to improve their efficiency by providing quicker and more effective responses. This demand for improving responsiveness to events is what led to the creation of the SOAR market.
To further explain where the SOAR market came from and demystify the different industry tools that can fall under an orchestration-based solution set, you need to understand the difference between SIEM, SOAR, and XDR. Many vendors mix and match the terms SIEM, SOAR, and XDR in their marketing campaigns, causing a lot of confusion regarding which capabilities to expect from their solutions. To demystify which of the different industry tools a true SOAR solution should include, and to further explain what gave rise to the SOAR market, the sections that follow address these industry terms using vendor-agnostic language.
Comparing SIEM and SOAR
The SOAR market actually is a subset of a market focused on the value derived from a combination of a SIEM and SOAR solution. There are a few reasons for this. First, SIEM technology predates SOAR technology—SOAR was created in response to the deficiencies in SIEM solutions. A SIEM solution allows a SOC to centralize data, but adding a SOAR solution extends what a SIEM solution can do. Capabilities offered by adding a SOAR solution include case management, orchestration, automation, and response. Most SOAR products do not store data, meaning they require a SIEM solution for a place to store data and retrieve data commonly referred to as a data lake.
To summarize the difference between a SIEM and SOAR solution, the primary focus of a SIEM solution is collecting and analyzing data, mostly in the form of logs, which are stored in a data lake for access by SOC analysts. SIEM solutions also interpret data-based patterns, establish behavioral baselines, and have machine learning training sets that help to simplify searching data. SOAR solutions focus on grouping existing data from the SIEM solution and converting alarms into a single case, which is handled using the playbook concept and improved with automation and orchestration. Table 10-1 highlights the common features and focus areas for SIEM and SOAR solution.
TABLE 10-1 SIEM and SOAR Solution Common Features
SIEM |
SOAR |
Collects logs |
Consolidates indicators of compromise (IOCs) in cases |
Syslog based |
Alert and IOC focused |
Automates commands |
Automates playbooks (such as Ansible and Puppet) |
Optimized for true and raw event search |
Suited for hunting suspicious activities |
Integrates with vulnerability scans |
Integrates with third-party threat feeds |
Incorporates user behavior analytics |
Automates processes for testing for false positives |
Many organizations are investing in a SIEM/SOAR solution combination to receive the value from combining these technologies. As a response to the market demand, many SIEM solution vendors have acquired or developed SOAR solution capabilities. Splunk acquired Phantom for its SOAR solution. IBM added the SOAR solution platform named Security Resilient to complement its SIEM solution known as QRadar. In both examples, the SIEM solution is required for the SOAR technology to function. Exabeam is an example of an offering that does not have this requirement—one solution does both. The specifics of how SIEM/SOAR solution capabilities are offered will vary by vendor.
The Rise of XDR
As the market demand for the SIEM/SOAR solution combination increased, another security market came into the mix. Some endpoint-focused security tools vendors found that antivirus capabilities such as pattern matching using threat signatures weren’t capable of detecting complex malware. Also, the same endpoint-focused security vendors found that the capabilities for responding to antivirus needed improvement. Over time, the endpoint detection and response (EDR) market developed, representing what the SIEM/SOAR solution market can do but only from an endpoint viewpoint. With an EDR offering, a SOC can collect endpoint logs, monitor the endpoint for the three key security detection capabilities (signature, behavior, and anomaly), and respond using orchestration and automation through the use of the EDR endpoint client.
In response to the increase in demand for the SIEM/SOAR solution combination, some EDR vendors started to add capabilities outside of the endpoint—performing EDR but on email, applications, networks, and anywhere else they could expand their capabilities. Eventually, some EDR tools were able to offer similar value as the SIEM/SOAR solution combination by extending EDR to other systems. Those vendors rebranded their offering from EDR to “extended” detection and response, more commonly referred to as cross-layered detection and response (XDR).
Each vendor’s specific capabilities will be slightly different, however. When a vendor claims to offer an XDR, it is referring to offering similar capabilities to what a SIEM and SOAR solution can offer, which are the following:
Collecting logs and other data for centralized display of data
Deduplication and correlation of events
Consolidation of IOCs in cases using case management capabilities
Support for multiple system types
Automation and orchestration
Various methods of response
SIEM vendors have adapted their product marketing to emphasize either a SIEM/SOAR value or an XDR value. For example, LogRhythm has a substantial share of the SIEM market but today markets several of its products as XDR solutions. Other SIEM solution market share leaders, such as Splunk, focus on the SIEM/SOAR solution combination value, which is very similar to how an XDR solution is marketed from a capabilities viewpoint.
That is a high-level explanation of where SOAR solutions fit into the data collection and event response market. The next section delves into SOAR, which is followed by a section covering EDR/XDR. You’ll be introduced to examples of popular enterprise offerings that relate back to common capabilities found across the SOAR and XDR solution market. You can find additional coverage of SIEM in Chapter 5.
Security Orchestration, Automation, and Response
SOAR solutions are built on four engines as defined by Gartner:
Workflow and collaboration
Ticket and case management
Orchestration and automation
Threat intelligence management
The fusion of these capabilities improves SOC productivity and incident response times by bringing together people, process, and technology. As such, these engines also provide an ideal basis for a robust security stack.
Data orchestration is the foundation of a SOAR solution and is defined as the automation of data-driven processes from end to end, including preparing data, making decisions based on that data, and taking actions based on those decisions. Automation does bring up some interesting questions such as:
Can every aspect regarding your response to events be automated?
Will automation lead a reduction of jobs within the SOC?
Are the robots taking over the world?
The answer to all of these questions is emphatically no. People are needed to address complex decisions.
Automation is ideal for simple repetitive tasks—it can address freeing up time for an analyst to deal other work. Automation is also only one part of a successful response to an event. Orchestration combines well-structured processes (often referred to as playbooks) with automation to deliver the result of a faster and more effective response. Some tasks in the overall orchestration can be automated while others that require human manual efforts will not be automated.
There is a ton of value from leveraging orchestration technology, which is why many SOCs are investing heavily in this technology space. A summary of specific technical value points offered by SOAR-type tools is as follows (these topics are the focus for this chapter):
Playbook automation: Automate a series of tasks with one or more tools
Context enrichment: Bring data from different tools into useful context
Enhanced investigation: See how security sources relate to an event
Key performance indicators (KPIs) business intelligence: Capture trends to prove return on investment (ROI) in security tools, processes, and personnel
Case management: Ensure the lifecycle of an event is properly managed
Collaboration: Allow for collaboration across different teams within and outside the SOC
All these value points are dependent on an existing solid foundation for SOC processes. If a SOC’s services are not mature and function in a sporadic manner, orchestration will not provide any value. The reality of orchestration is that it will leverage whatever is available, including existing problems, meaning orchestration can make things less effective by automating your problems unless those problems are first addressed.
Note
If your dataset has problems, orchestration will just automate those problems! You must first ensure the process works before you attempt to speed it up.
SOAR Example: Phantom
The best way to understand SOAR concepts is by exploring a SOAR product as an example. This section uses Phantom by Splunk to better explain each concept. Know that many industry leaders in the SOAR solution market offer similar features, but the specifics vary based on the vendor. Also know that many of the commercial SOAR features can be developed by using open-source options; however, commercial SOAR solutions are more user friendly, have simpler plug-and-play configuration, and offer various levels of support from the vendor that you wouldn’t get with an open-source option.
Splunk is a market leader for SIEM solutions with a heavy focus on its self-developed application community. Splunk saw the need to add SOAR features and acquired Phantom back in 2018. Like many SOAR offerings, Phantom as a SOAR requires a SIEM solution in order for it to have data, meaning Splunk customers looking to add SOAR capabilities must stand up a separate Phantom system.
Note
All SOAR offerings do not require a SIEM; however, this is a very common design in the industry. Make sure to consider how many systems need to be stood up to perform SIEM and SOAR functionality as you evaluate a vendor’s offering.
The best place to start is by exploring the main Phantom dashboard. Figure 10-2 shows the Splunk Phantom dashboard.

FIGURE 10-2 Splunk Phantom Main Dashboard Example
The top widgets in the Phantom dashboard focus on core SOAR solution features. Resolved events represents any events that have been addressed by a playbook or analyst. Following that are stats regarding how fast a case is resolved, because the focus of a SOAR solution is speeding up and improving how events are resolved. Stats include everything from time to dollars saved by the SOAR solution. As you can see, the focus of Phantom is not identifying events, like you would expect with a SIEM solution; instead, this SOAR solution heavily focuses on case management and saving money through orchestration and automation.
Case Management Example Using Phantom
Case management means dealing with the entire lifecycle of an event, from recognizing an event is occurring, to tracking how the event is handled, and eventually closing out the case once all steps of a playbook have been executed successfully. If multiple incidents are found related to an event, the SOAR case management feature needs to add those incidents to ensure the entire event is handled during the case management process. Case management can also include other forms of data enrichment designed to help the analysts assigned to the case be more effective at responding to an event.
Figure 10-3 shows the Splunk Phantom case management dashboard. The top widgets focus on the number of events, severity of events, what cases are new, open, or closed, and who the case owners are. To better navigate the cases handled by an organization, search features enable a SOC manager to pull up previous cases, track how cases are being managed, and search for other key terms in relation to what has been or is being handled in Splunk Phantom.

FIGURE 10-3 Splunk Phantom Case Management Dashboard Example
Playbook Example Using Phantom
One important concept to understand is playbooks (covered in more detail throughout the chapter). It is common for enterprise SOAR solutions to include a wealth of playbook templates to help organizations match common tasks that can be automated in a prebuilt template. Phantom has many templates that can and should be customized for your SOC use. A new playbook can also be either uploaded or built from scratch. Figure 10-4 shows the search area in Phantom for viewing the playbook templates that are available.
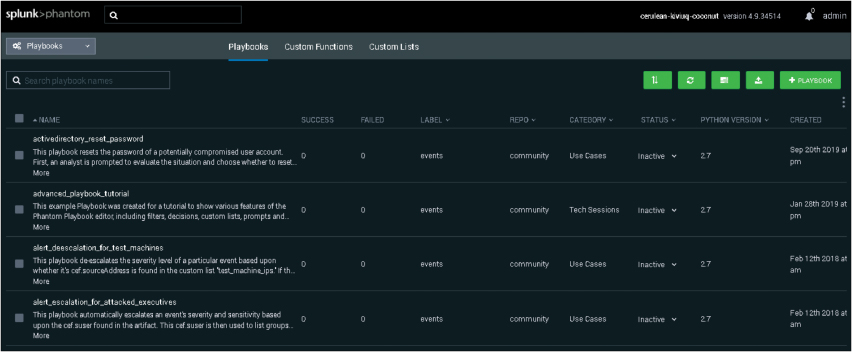
FIGURE 10-4 Splunk Phantom Playbook Template List Example
Figure 10-5 shows an example of what Phantom playbook looks like when you open it up. For this example, I have clicked into a playbook template focused on responding to a compromised email. Phantom uses the industry-standard workflow symbols, including a start icon, decision diamond, and rectangles representing actions that are taken. This format makes it easy for a SOC analyst of any skill level to view and understand what steps to take in response to an email compromise. The section “Playbook Components” later in this chapter covers these symbols in more depth.

FIGURE 10-5 High-Level Splunk Phantom Playbook Example
Figure 10-6 shows a zoomed-in look at the first part of the Phantom playbook template for an email compromise. Boxes that have an orange border represent steps that have not been configured properly, which means this playbook cannot be run until these items are resolved. This makes sense based on how this workflow is designed to deal with a specific organization’s response to email compromise. Your SOC must identify some specific datapoints that relate only to your organization, such as who should be alerted, what should be done when a potential email compromise is seen, and what represents an email compromise.
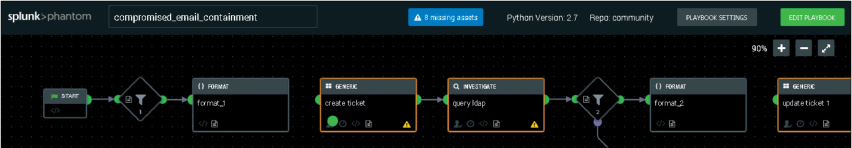
FIGURE 10-6 Zoomed-in Phantom Playbook Example
In this example, one area that needs to be completed is identification of who is responsible to investigate an email compromise. If this is left blank, the logic of the workflow can’t identify who should receive an alarm when an event occurs, which is why this is a mandatory step to establish before this playbook can take action. Phantom offers workflow wizards that walk analysts through the steps of setting up playbook templates, explaining what is needed for required steps as well as why these steps are required, dramatically reducing the chance of creating a broken playbook.
DevOps Example Using Phantom
Commercial SOARs simplify the playbook creation process; however, that does not mean programming is completely removed. It is common for enterprise SOAR solutions to help simplify playbook creation by using templates, wizards, and prebuilt functions that can be called upon; however, a certain type of programming called DevOps must be done in order for a workflow to be created. Figure 10-7 shows an example of clicking into the “create ticket” function in the Phantom email compromise playbook template.

FIGURE 10-7 Phantom Example of DevOps Coding
Notice Phantom brings up the code associated with generating a ticket; wizards and other built-in tools can help an analyst quickly adjust the code to meet the organization’s needs. As with most programming languages, Phantom includes a debugger (Playbook Debugger), which will flag errors found in a playbook’s code and attempt to highlight which line of code is causing the problem. This example emphasizes why DevOps skillsets are increasing in demand as well as why DevOps skills are viewed as a different skillset than general programming experience with programming languages such as C++ or Pearl. The focus of this type of programming skillset is to understand workflow objectives and write code that can accomplish those objectives using the most efficient and accurate method possible. Another way to say this is that this type of programming combines the goal of IT operations and software development. The section, “DevOps Programming,” later in the chapter, takes a closer look at this type of programming.
The previous examples just scratch the surface of what a SOC can do with an enterprise SOAR solution such as Splunk Phantom. Key points to take away from this use case are as follow:
SOAR solutions focus on concepts such as managing cases and time saved.
Playbooks can be manual, but the value of a SOAR is automating steps when it’s appropriate.
Automation can be achieved using templates and wizards; however, some programming is needed.
Programming in a SOAR solution is a different type of programming focused on making technology work with other technology rather than creating something new.
SOAR solutions do not focus on data mining or event management like a SIEM solution offers but are great for event consolidation, which can be part of a playbook. For example, when a specific event occurs, the SOC can launch a playbook action.
The next topic to examine closer is EDR and XDR solutions as they offer similar value as what a SIEM/SOAR solution combination can offer. You’ll have a close look at a market leader in the EDR market to give you a feel of where XDR came from.
Endpoint Detection and Response
So far, the discussion of SIEM and SOAR solution concepts has used examples of automation at the network layer with a focus on the workflow of playbooks. Automation can also relate to endpoints and software. The National Institute of Standards (NIST) published NIST Interagency Report (NISTIR) 8011, Automation Support for Security Control Assessments, which goes into detail of a specific methodology on how to test and automate cybersecurity concerns around software automation. In other words, NISTIR 8011 addresses questions regarding how to audit automation software. Table 10-2 lists some common attack methods documented in NISTIR 8011 and the corresponding mitigation processes.
TABLE 10-2 NISTIR 8011 Attack Methodologies
Attack Method |
Mitigation Process |
Internal Entry |
Block local access: restrict admin access and software installation privileges |
Insider Attacks |
Reduce and disallow software to run unless previously authorized |
Gain a Foothold |
Restrict software installation |
Land and Expand |
Reduce existing vulnerabilities on systems and enforce segmentation between networks. |
Endpoint security vendors have taken on the challenge to address these concerns in a similar manner as the SOAR market, including offering case management, playbooks, automation, and orchestration, commonly categorized as endpoint detection and response (EDR). Like a SOAR playbook, an EDR playbook considers the entire lifecycle of an event, including who is responsible for performing what actions and what should be accomplished before a case is closed.
EDR Example: CrowdStrike
One example of a popular EDR enterprise solution offering comes from CrowdStrike, known as Falcon. Falcon is a cloud-delivered EDR solution that leverages an agent installed on an endpoint. CrowdStrike Falcon offers endpoint antivirus capabilities mixed with automation and orchestration of event management; advanced threat prevention using various forms of data enrichment and threat intelligence; and some endpoint device control capabilities, all of which are based on what type of licensing is purchased and how the system is configured.
Figure 10-8 shows an example of the CrowdStrike Falcon dashboard. The first key datapoint to notice is the heavy focus on detecting events. There are widgets covering the number of endpoints that have been infected by all accumulated events, the secure hash algorithms (SHAs) associated with identified malware, what type of tactics are used by the malware, and the most recent events. EDR operates similarly to SIEM solution with regard to events; the difference with EDR solution is that the scope is limited to endpoints.
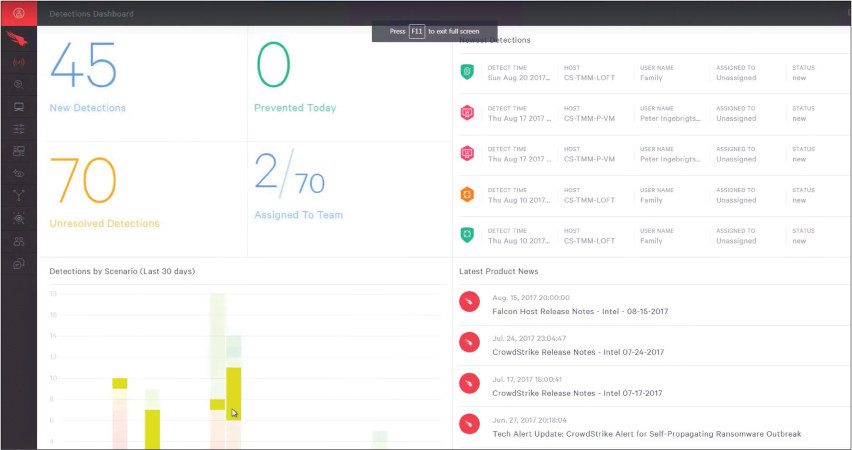
FIGURE 10-8 CrowdStrike Falcon Dashboard Example
Events are displayed in a graphic format in Falcon so that the analyst can track the lifecycle of the event from start to remediation. Figure 10-9 shows an example of an event in Falcon that started through Microsoft Outlook and launched through notepad.exe. Each step of the attack can be analyzed to help the SOC analyst understand what occurred, why the action is malicious, and what should be done to prevent additional actions taken by the threat—in other words, prevent an outbreak. This approach to developing a graphic view of each step taken by malware during an event is very common in EDR solution platforms.
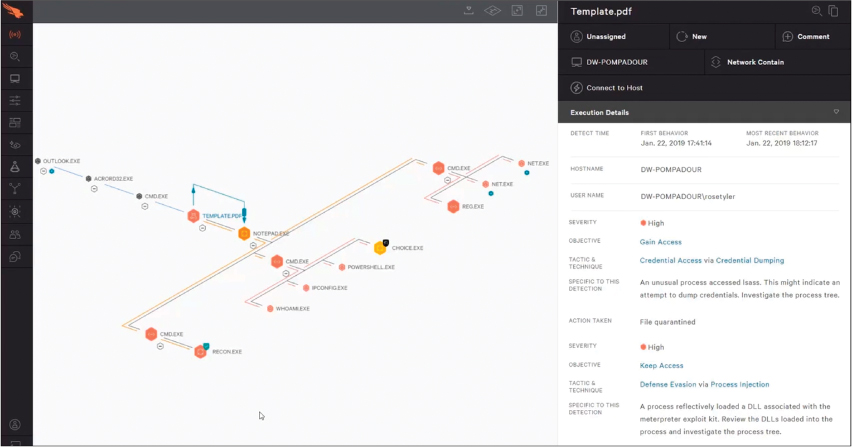
FIGURE 10-9 Falcon Event Graph Example
Actions can be taken leveraging the Falcon agent installed on the endpoint, including pushing scripts, manually pushing commands, or executing programs. From the interface shown in Figure 10-9, you can view details on why a step is potentially malicious by clicking into a notation in the attack timeline. Figure 10-10 shows an example of clicking into the details explaining why a file is identified as malicious, including relating it to a known threat actor. It is common for enterprise EDR solutions to provide much more detail about threats than host-based antivirus offerings because EDR solution vendors include in the solutions far more capabilities than signature-based pattern matching.

FIGURE 10-10 CrowdStrike Falcon Example of Event Details
Responding to endpoint threats is important, but EDR offerings are limited to endpoints. This is why many EDR vendors have looked beyond the endpoint to meet the market demand for capabilities offered in a SIEM/SOAR solution combination. As previously introduced, this new breed of EDR solution that can support more than endpoints is the extended detection and response (XDR) solution marketspace. From a capability standpoint, an XDR solution has very similar capabilities to the previously covered SIEM and SOAR solution capabilities, so I am not including an XDR solution demo here. In other words, XDR solutions offer the same general features as a SIEM/SOAR solution combination.
At this point, you should understand what SIEM, SOAR, EDR, and XDR solution are and what they can do based on the provided technology examples. The rest of the chapter covers concepts that apply to what both a SOAR and an XDR solution can offer. One important value these technologies can provide to your SOC is the capability to develop and enforce repeatable responses to specific events. To build repeatable responses, you need to create playbooks.
Playbooks
Every SOC with an incident response service has some form of planned response when an incident occurs that could impact the organization the SOC is protecting. That plan might be very basic and reactive, such as sending an expert to investigate the situation. More mature plans cover everything from how potential events are identified to who is notified, how new cases are tracked, what actions should be taken based on the event type, and what is needed to recover. As with any SOC service, higher-maturity services have repeatable processes that provide all members of the organization with a clear understanding of their responsibilities before, during, and after a security incident. In short, a playbook is a representation of a standardized SOC process.
A playbook is a linear-style checklist of required steps and actions that are followed to successfully respond to a specific incident type and threat. Playbooks not only support implementation of automation but also help to keep the incident response program consistent, predictable, and measurable, which enables organizations to meet and comply with regulatory frameworks such as NIST SP 800-61 R2 or the EU General Data Protection Regulation (GDPR). The contents of playbooks are a combination of what can be automated with manual tasks performed by humans and systems. Basically, a playbook is the entire end-to-end response to an incident. This is why I pointed out that automation is a subset of orchestration: orchestration involves everything in a playbook.
Playbook Components
The security industry uses common components or symbols when developing and representing playbooks. Components of a playbook are represented as parts of a workflow diagram so that any person can understand how the workflow should occur from start to finish. The list that follows provides an explanation of each playbook component. Be aware that components can vary slightly among playbook creators.
Initiating condition: The event that triggers the start of the playbook. An initiating condition is required to know when to launch a playbook.
Process steps: The actions performed during each step of the playbook. Steps can include generating responses, authorizing responses, and quarantining something, to name a few common examples. There must be at least one process step or a playbook doesn’t provide any value.
End state: The end goal and final step of the playbook. The end state represents the desired outcome based on predefined conditions that have been met.
Workflow diagrams use some variation of the symbols shown in Figure 10-11. Start and end states are represented by ovals, while rectangles and diamonds make up process steps. Steps are connected by arrows showing how the workflow should occur. The diamond represents decisions, such as the answer to a yes or no question, while rectangles are specific steps that are taken and must be completed before moving to the next step.
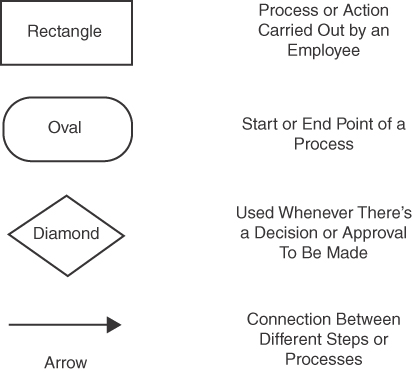
FIGURE 10-11 Workflow Symbols Defined
Constructing Playbooks
Well-built playbooks accommodate all situations, including when a step fails by sending the workflow back to a previous step until all steps have been accomplished to move forward. Figure 10-12 is an example of a playbook.
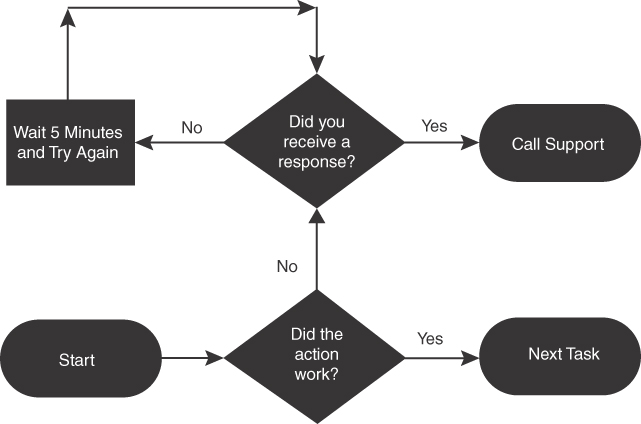
FIGURE 10-12 Sample Playbook Workflow
As shown in Figure 10-12, the question in the bottom diamond asks “Did the action work?” A response of yes sends the workflow forward to the next task, while a response of no sends the workflow to another question, “Did you receive a response?”, which has another set of yes and no options. Workflows can have more than one start state and end state as well as infinite loops. As an example of more than one end state, Figure 10-12 shows that the workflow can lead to an end state of either calling IT support or proceeding to the next task. An example of an infinite loop is “Wait 5 minutes and try again”; until a response is received, the workflow continues looping in the wait period. The actions in the diagram in Figure 10-12 can be summarized generically as you do some action, and if it works, you do the next task; if the action fails and you get a response, you call support; if the action fails and you don’t get a response, you wait until you get an error message, and once you have that message, you call support.
Incident Response Consortium
The Incident Response Consortium (IRC) at https://www.incidentresponse.com is one of many resources you can use to find playbook templates and is a great resource I will use to teach you playbook best practices. I have already referenced the IRC in Chapters 3, 6 and 8. The IRC approach to developing playbooks is based on different parts of the lifecycle of responding to a specific type of incident. The following is a summary of the steps of IRC’s playbook lifecycle. These are common steps within the lifecycle of developing and delivering SOC services.
Prepare: Actions taken to prepare the SOC for a certain type of incident
Detect: Actions and tools set up to detect a certain type of incident
Analyze: Actions used to analyze a potential type of incident
Contain: Actions implemented to prevent the spread or outbreak of an incident
Eradicate: Actions involved with removing the risk/negative impact associated with a specific incident
Recover: Actions deployed to return the organization back to normal operations post incident
Post-Incident Handling: Steps regarding lessons learned to improve the playbook
Playbook Examples: Malware Outbreak
Let’s review a few playbooks found under the IRC’s recommendations for handling a malware outbreak. Figure 10-13 shows the Prepare playbook for a malware incident taken from IRC’s templates. This is a great starting point not only to learn about developing playbooks, but also to understand what is expected for a playbook regarding malware outbreaks. According to IRC’s format, there are different playbooks for other parts of the malware lifecycle such as detecting and analyzing malware; however, IRC recommends that you first prepare the SOC for dealing with malware following the “Prepare” focused playbook. This means that at this point of the malware response lifecycle, you do not have a service established within your SOC and will follow this prepared playbook to develop a malware response service based on IRC’s recommended process.

FIGURE 10-13 IRC’s Prepare Playbook for Malware Outbreak
Looking at the malware prepare playbook, it starts with the task Determine Core Ops Team & Define Roles, in which the SOC assigns a vulnerability manager, a threat manager, and a risk manager. You must complete this step before moving forward. Taking this step first makes sense because a SOC service needs a leader before it can take any further actions. This playbook enforces this concept. Next, the playbook has the SOC Determine Extended Team & Define Roles, which again must be done before the SOC can move forward. This task recognizes that the manager of each service identified in the first task needs the support and representation of other departments in the organization to help develop a coordinated response to a malware outbreak. Next, this playbook tasks the SOC with defining escalation paths, which will leverage the team that was previously constructed in the previous tasks. In summary, this playbook states that preparing escalation documentation is the focus of the Prepare step of the malware outbreak playbook. These documents will identify who is involved with a malware outbreak program and what their escalation path would look like—in other words, determining when each party is engaged and their assigned roles as the malware outbreak playbook is further developed. The IRC is basically saying that roles must be assigned and documented before any other actions can be taken.
Next, let’s move forward in time regarding the malware lifecycle playbook list and dig into the Analyze malware outbreak playbook, shown in Figure 10-14.
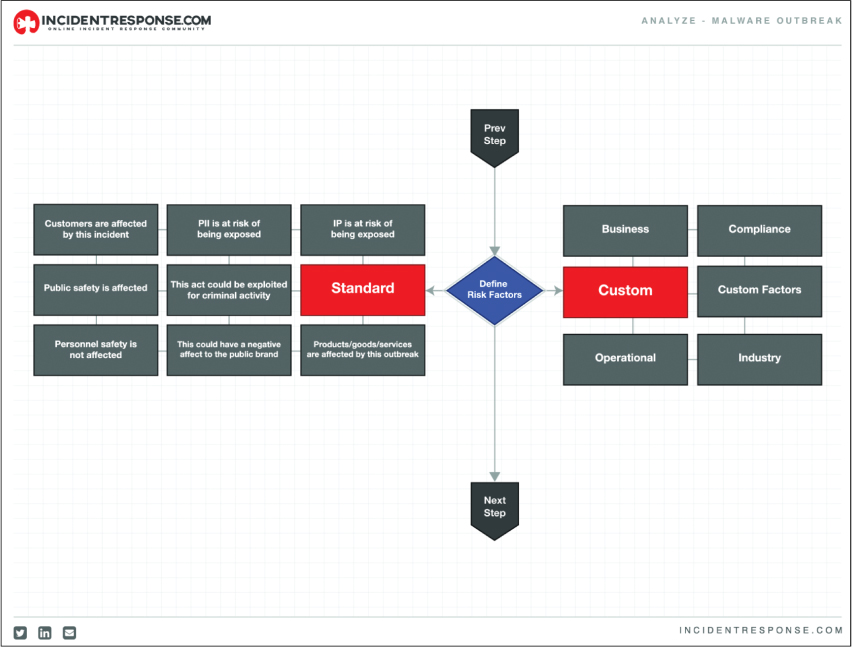
FIGURE 10-14 IRC’s Analyze Playbook for Malware Outbreak
The first step of the analyze playbook is executing the previous playbook covering how to detect any potential detected threats. This means the assumption is that you have detected a possible malware outbreak and you are now launching this playbook to start the analysis process to determine if it is a real threat or false positive. This playbook starts with a diamond that has the analyst define the risk factors associated with the detected threat. On the left are standard industry factors to consider, while on the right are what this playbook calls “custom” checks, which can be based on specific factors such as operation, industry, or compliance factors. Keep in mind that the risk evaluation process can be manually computed or automation can be used to speed up the process. Regardless of approach, this analyze playbook defines what factors must be considered and calculated before the analyst is permitted to move to the next playbook, which would be how the SOC would respond through containing the threat.
Key point
Check out https://www.incidentresponse.com/playbooks/ to see more playbook templates from IRC.
In addition to playbook resources such as the IRC, playbook templates are available in some security tools. Regardless of the source, no template will represent everything required for your specific needs. You are expected to customize a template based on your unique technology, architecture, available skillsets, policies, and procedures.
Playbooks are a critical prerequisite for automation. At first, all playbook steps are manual and should be well vetted to ensure the process continuously delivers a desired result. The IRC includes a final playbook within the malware outbreak playbook category called Post-Incident Handling, which has the focus on improving previous playbooks based on lesson-learned actions targeting discovering what works and doesn’t work with playbooks that are put into action. Maybe adjustments within the steps used within the Detect playbook could be made. Maybe new tools are needed to improve the Eradication playbook. No playbook will be perfect, but as repeated success is seen, that playbook will be ready to consider applying automation.
Note
Mature SOCs can have dozens of playbooks as procedures are formalized, converted into a playbook, and implemented as part of a SOC service. I recommend to start creating playbooks for fundamental services, such as responding to common events, because your SOC will have experience with the event and be able to outline what the playbook should look like. Examples include responding to malware outbreaks, responding to stolen passwords, and dealing with unauthorized devices accessing the network.
Automation
Playbooks can be manually implemented; however, the real value from developing playbooks is derived by applying automation when applicable. Security-based automation can be defined as the execution of a series of actions with the purpose of detecting, investigating, and remediating cyberthreats with or without human intervention. The result of successfully applying automation is that it frees up your SOC staff from doing tedious and mundane tasks so that they can prioritize their time on more complex tasks. Automation can also improve response time and guarantee action is taken on specific events. For example, if a system connects to the network, automated responses can include initiating a vulnerability scan of the system and, if a critical vulnerability is found, denying or limiting that system’s access to the network and sending an alert to the SOC. Without automation, manual execution of the playbook would require that a SOC member identify that a new system is connecting to the network, provision it limited access, manually initiate the vulnerability scanning process, and, if a vulnerability is found, pass the alert about the vulnerability to the vulnerability management service and wait for them to respond, all of which delay the new system’s full access to the network.
I recall earlier in my career working for a U.S. government agency that stated “All new devices must be scanned by IT”; however, IT would only scan systems when either they identified them or when a new system owner called IT regarding having their device scanned. Due to the lack of automated enforcement, many new systems would connect and not be scanned. Automation removes the SOC from having to monitor for newly connected devices, launching vulnerability scanning against those systems, and applying network access based on the results of the vulnerability scan. Figure 10-15 represents this example workflow to accommodate new systems connecting to the network as a playbook. The icons in red represent what is being automated in this example. Notice in this example that most steps can be automated, leading to a lot of saved time!

FIGURE 10-15 Example of Automated Playbook for Vulnerability Compliance Enforcement
Automating Playbooks
There are different approaches to automate each step represented in the Figure 10-15 playbook. Provisioning access is commonly automated using a network access control (NAC) technology. Vulnerability scanning can be triggered based on the event of a device connecting to the network, identified either through monitoring switch connection states, such as leveraging link-up traps, or through direct integration with a NAC technology. A SIEM, vulnerability scanner, and NAC technology can be configured to generate alerts based on any of these actions, and those alerts can include notifying parties responsible for delivering the services described by this playbook.
Figure 10-16 shows an example of this configuration with Cisco Identity Services Engine (ISE), a NAC technology, working with Nexpose, a vulnerability scanner by Rapid7. Figure 10-16 shows a Cisco ISE policy stating that if a system connects to the network and Rapid7 Nexpose identifies that it has a threat ranked as a CVSS score of greater than 7, then enforce the Quarantine policy. The Quarantine policy could mean moving the system to a different network, applying access control lists to limit what the system can connect to, or even removing the system from the network. This setup automates the response to when a system has a vulnerability, which saves the SOC time and ensures the same response is issued anytime this situation occurs.

FIGURE 10-16 Cisco ISE Configured with Rapid7 Nexpose Example
Another example is using the same Cisco ISE network access control technology to automate the response of threats seen by an internal IDS/IPS. Figure 10-17 shows rules in Cisco Firepower, a next-generation firewall with IPS capabilities, configured to be automatically enforced by Cisco ISE. Figure 10-17 shows that Cisco Firepower is set up to look for malware and, if a malware event occurs, automatically instruct Cisco ISE to move the associated endpoint to the Quarantine policy. Once again, the SOC can save time by automating this response and can be assured that the response is repeatable, regardless of the time of day. This ensures trust that the same response is consistently delivered.

FIGURE 10-17 Cisco Firepower Configuration Rule Example
Common Targets for Automation
Almost every task can take on some form of automation based on how repeatable and complex the task can be. In fact, instead of restricting automation to specific features that the vendor must build and maintain, many vendors are including application programming interfaces (APIs) and other open platforms that support almost any type of automation to occur through specialized programming known as DevOps. (DevOps was introduced earlier in the context of SOAR and will be covered in more detail later in the “DevOps Programming” section.) However, there are several common tasks that are ideal candidates for automation.
The following tasks are prime targets for automation:
Identity and access management
Patch management
Unsophisticated malware detection
Data protection
Reputation lookups
Risk scoring
Blocking users
Reporting thresholds
Notification and task assignments
Launching remediation tools
Automating specific responses such as blocking or shutting down services
Automation Pitfalls
In contrast to the previous list, there are certain tasks you will not want to automate. More complicated tasks that require decisions based on human behavior or generally complex tasks will have too many variables to map out into a playbook. An example is responding to social engineering attacks. There are certain defense mechanisms that are possible to automate; however, social engineering is based on deception, which can be difficult to predict. Social engineering attacks can target email, social media, or even occur over a phone call. Penetration testing is another example of a task that continuously adjusts based on data obtained from the attacker’s reconnaissance and must consider both technology and human factors of the target, leading to hundreds of potential variables that are impossible to predict.
My recommendation is to attempt to create a playbook diagram of a process before considering automation. You will quickly find if a workflow is too complex for automation based on the number of outcomes required to completely capture what needs to be covered within the playbook. Looking back at the IRC playbooks, you should take the same approach they prescribe regarding breaking complex playbooks into smaller, more focused playbooks. By taking that approach, even the most complex tasks can be isolated into smaller, more digestible playbooks.
Playbook Workflow
Building automation is based on workflow. A workflow is a combination of multiple tasks, and automation is executing those tasks in a more efficient manner. Relating the workflow concept to playbooks, think of a workflow as how all the tasks (regardless of whether they are automated) are executed, ensuring that the playbook is properly followed so the playbook generates repeatable results. Automation of each step in a workflow can be accomplished using raw scripting; however, some SOAR tools offer a drag-and-drop, template-based approach. You can also leverage existing integrations, such as the Cisco ISE, Rapid7 Nexpose, and Cisco Firepower examples previously covered. Drag-and-drop templates found in many SOAR and XDR offerings provide a simple visualization of workflow, which allows the analyst to choose which steps of the workflow can be automated.
Workflow Example 1: Cisco SecureX
This example looks at building a workflow in Cisco SecureX. Cisco SecureX offers SOAR capabilities that include developing and automating playbooks. The left side of Figure 10-18 shows a workflow of a playbook with the purpose of sending a URL to be evaluated by a cloud security sandbox service called Cisco Secure Malware Analytics (formally Cisco Threat Grid).
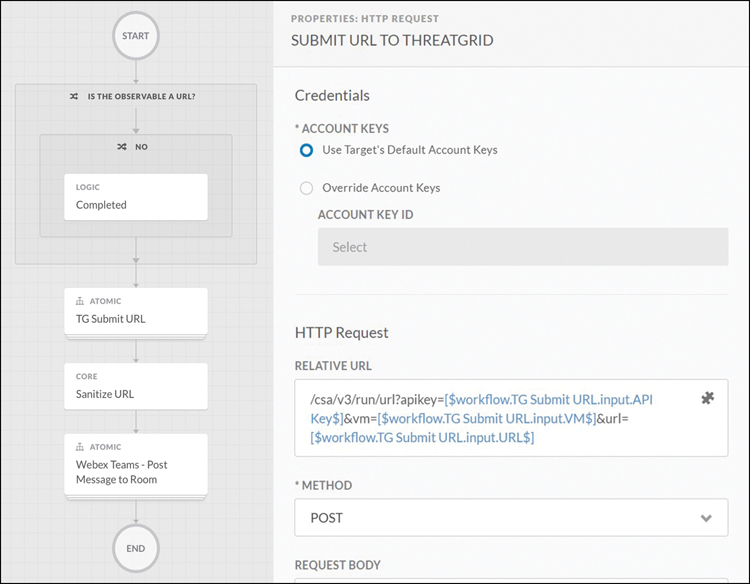
FIGURE 10-18 Cisco SecureX Orchestration Example
This workflow starts with validating if the data being submitted is a URL. If it is, the workflow continues to the next step. If the URL provided is not a URL, a logic completed step is launched, which kills the workflow. The analyst configured this as a response to when the wrong data type is inputted to avoid the workflow crashing or causing an unwanted response. Keep this concept in mind as you review developing workflows. It might seem tedious to add checks for the wrong input during each step, but the end result will be a much more robust and effective workflow.
If the right data is provided, a URL in this case, that URL is submitted to Cisco Secure Malware Analytics using the authorized account information. Think of this step as automating the task of a SOC analyst copying a URL, logging into Cisco Secure Malware Analytics, navigating to where a URL is inputted to be evaluated, pasting that URL, and submitting it to be evaluated. This entire process can be done manually, but why do that if it can be automated, ensuring the same response occurs every time? Automation not only speeds up the process but removes the possibility of the analyst mistyping the URL being submitted, mistyping the login information to access Cisco Secure Malware Analytics, or clicking the wrong thing while trying to find where to submit the URL. Automation makes this entire process easier!
Finally, once the URL is submitted, a result is pulled and sent to a SOC social space, such as a message board or dashboard dedicated to monitoring alerts. Once again, this automation saves the analyst time regarding waiting for the response, copying the results from Cisco Secure Malware Analytics, opening the SOC social space, and pasting the results into that space. Each of these smaller tasks might not seem like a huge effort to perform manually, but think about having to do them 500 times in one day. If you consider all the steps and possible issues that could occur, regardless of how minor they can be, automating this entire process can add up to hours of time savings, resulting in a more efficient SOC service. A more important result is removing these tedious tasks from an analyst’s workload, not only making the analyst’s job much more enjoyable but also enabling the analyst to focus on more complex tasks that require human intervention. I’ve found over time that the reason many unhappy SOC analysts don’t like their job is that the majority of their tasks are repetitive and mundane!
On the right side of Figure 10-18 is the configuration of the workflow step “TG Submit URL” representing how to configure and make the process of submitting the URL to Cisco Secure Malware Analytics function properly. In order for this step to work, a few actions need to be taken correctly, such as logging into the Cisco Threat Grid system to prove you are authorized to submit URLs. This can be accomplished by using an API that automates the process of proving your SOC has a subscription to a commercial lookup service. Another action that must occur is going to the proper web source and delivering the URL in question. Configuration options for workflow widgets in enterprise SOAR products are built this way to simplify creating automation of steps of a playbook with properly functioning logic. Similar to programming code, vendors develop workflow templates that include validation of what is entered to reduce the chance that a workflow will not provide the desire results. Without these checks, inputting something other than a URL for this example workflow would cause unwanted results.
Figure 10-19 shows an example of the options to validate that a workflow configuration is correct in Cisco SecureX.

FIGURE 10-19 Example Workflow Validation and Run Options
Workflow Example 2: Splunk Phantom
Playbook workflows function in a specific order. It is important to have each step of the playbook launch in the correct order or you will not get the expected result. Many times, variables in a workflow are dependent on items being executed before the variables can function properly. Looking back at the last workflow example, if the login credentials were sent to Cisco Secure Malware Analytics prior to inputting the URL that needed to be researched, the remote source (Cisco Secure Malware Analytics) would not see the login and would view the request as one coming from an unauthorized party, leading to an error message.
Figure 10-20 shows Splunk Phantom’s use of workflow when running a playbook. Notice the timeline at the bottom of this playbook, which shows when steps of the workflow are executed in the playbook. When a workflow step is complete, a checkmark is added, indicating that step’s data can be accessed to see the results as well as be used by future steps in the playbook.

FIGURE 10-20 Splunk Phantom Workflow Execution Example
Many enterprise tools that offer template-based workflow programming are designed with the goal of simplifying open-source, industry-recognized programming languages. This brings us to another approach to accomplishing workflows, which is building the automation from scratch or modifying existing workflow templates using the code they make available. To use this approach, you need to understand workflow programming (the ability to configure servers using a programming language).
If you were hoping orchestration technologies would eliminate the need for coding skills, you’re going to be disappointed, because the orchestration market is encouraging more programming requirements for the future IT professional. This leads us to the conversation about DevOps.
DevOps Programming
There are many programming language options for developing an application. According to Applitools (https://applitools.com), the five most common programming languages used to build simple scripts are Java, Python, JavaScript, C/C++, and Perl. Any of these languages can be used to develop scripts that can automate existing steps or add new functionality to improve steps within a playbook. By searching the Internet, you can find hundreds of tutorials, program snippets, and even drag-and-drop tools that simplify the programming process, all aimed at helping you develop a program.
Note
My personal opinion is that Python is the best popular programming language to start learning if your goal is to use your skills in a SOC to automate security tools. Whatever language you choose to learn, the underlying concepts are applicable to all languages.
The focus of traditional programming languages is to build programs. This is not the same focus as what IT operations hope to achieve with programming. IT operations care about configuration management—using programming to automate workflows by enabling tools to work together in a more streamlined fashion. This is why the industry has created a separate practice that focuses on orchestration representing the combination of software development and IT operations, commonly called DevOps.
DevOps bridges the gap between development and operations, which is key to improving playbooks. Think of DevOps as using programming skills to apply automation between steps of a playbook to improve the workflow of that playbook. This means you want to use APIs and other capabilities that already exist in tools rather than writing a program from scratch, which leads to a whole different set of coding skills and software development lifecycle.
In the DevOps world, tools like Puppet and Ansible are better suited for creating automation compared to writing a program using a traditional programming language. There are also platforms such as wikis that are built from the ground up with workflow in mind and are much better options than developing a similar platform from scratch. DevOps aims to customize what has already been created for your needs (rather than creating from scratch) as well as improve the data management process. This focus addresses some of the biggest challenges with the traditional data management process that tends to be slow and siloed. Let’s look more closely at those challenges.
Data Management
Data management is the process of ingesting, storing, organizing, and maintaining the data created and collected by your organization. Chapter 5 covered different data formats, how to collect data, and how to optimize it for your SOC. Effective data management is a crucial piece of running a successful SOC. The goal of proper data management is to make the data accurate, available, and accessible to all required parties.
Figure 10-21 represents a strong data management practice. First, the SOC must identify what data is required for its services. The combination of this data that the SOC can use can be viewed as the SOC’s data architecture (all of the desired data that is useful to the SOC). The SOC uses data models to map workflows and relationships in datasets so that information can be organized to meet the SOC’s needs. As data is generated or collected by the SOC, that data is processed and stored in a database. The database holding the SOC’s data can be installed within the SOC or provisioned through cloud storage. As more data is collected and stored by the SOC, data is integrated by the SOC tools, which allows for the SOC to perform analysis across multiple datasets. To ensure data accuracy, the SOC must check for errors or inconsistencies so they resolve any problems using data cleaning tasks. Finally, any data governance policies developed by the SOC are applied to ensure data is stored and used in compliance with any requirements as well as kept consistent across systems.
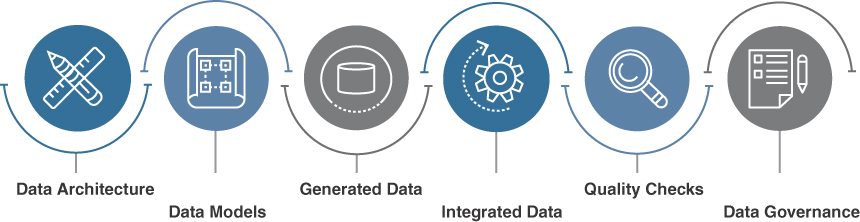
FIGURE 10-21 Data Management Model Example
Traditional methods to store and share data tend to be slow due to protocols used for sharing data and limited capabilities regarding how different tools share data. Today’s data tends to not be homogeneous, meaning it doesn’t fit easily into a relational schema based on rows in tables. Modern applications must process data that includes records, documents, video, text, and semantic triples in a variety of formats including XML, JSON, txt, and binary. The SOC needs a way to overcome data format challenges and quickly abstract what is required for the mission at hand. Data also needs to be shared more quickly and more often to allow multiple systems to share their insight on an event.
DevOps brings agile operations to the SOC, which can greatly improve the data retrieval stage in the data analysis process. Data models can be enforced using a data modeling language that allows for any data type to be converted into an understandable text-file format. Data integration can be dramatically improved by enabling tools to share with other tools rather than forcing all data to be centrally stored before it can be retrieved. Automation can be used to remove steps in the collection, processing, storage, and sharing steps, which has the cumulative effect of reducing the required data custodian tasks involved with managing large datasets. As a result, the SOC can work with larger datasets more quickly, leading to more productive SOC services.
There are a few fundamental DevOps concepts that you need to be familiar with to properly grasp the value of DevOps. First, you need to know how DevOps can work with different datasets. This includes understanding file formats and data modeling languages. You also need to know how automation can be used to enable tools to share data with other tools as well as how to reduce manual steps when collecting, processing, storing, and sharing data. In the sections that follow, you will learn how to build your own DevOps lab as well as consult many DevOps resources you can use to gain a better understanding of how DevOps can improve your SOC.
The first fundamental DevOps topic you need to understand is text-file formats. DevOps is all about working with existing tools, which means that you will be sharing data and commands between tools. You must understand how to communicate with another tool in order to have the receiving tool understand what is being said. This makes text-file formats an essential ingredient of DevOps programming.
Text-File Formats
DevOps requires tools that have an open platform, meaning the tools are based on open standards and thus can be integrated with other tools that are based on those standards. In the past, many security vendors didn’t support open platforms, meaning their tools would not work with any third-party tools. Closed platforms are becoming extremely unpopular in the security community because every organization needs to leverage multiple security vendors to accomplish all of their security needs. SOCs expect security tools to support an open platform and will specify open platform support as one of the requirements for purchase.
In order for tools to be open, they must understand how to communicate with each other. The technology industry has developed standards for this purpose, enabling vendors to know what to support in order to be accepted as an open platform that can function within the DevOps community. One type of standard specifies how data must be formatted for tools to be able to communicate. A data format is what it sounds like, which is the arrangement of data fields for a specific shape. Let’s say I want to present a file that gives a quick summary of this book to my daughter. That file format could look like the following, which is easy for my daughter to read and understand:
The book ID is 1
The author is Joey Muniz
The title is The Modern Security Operations Center
It is a technology book
A summary of the book is a technical journey to understanding a SOC
This file format is easy for any human to read, but what about computers? Computers consider aspects such as whitespace, the case of characters, and many other factors that humans don’t care about. This data can cause a computer to see this file different than intended. This is why it is important to understand the data format being used. By understanding the format, the system will know how to handle everything from text to whitespace as well as have expectations for certain key words and characters.
Next, let’s look at the most common data formats used in DevOps environments.
Common Data Formats
In the DevOps world, three common formats that computers understand for data are XML, JSON, and YAML. It doesn’t matter which option you use as long as the systems in play support it. If a system supports all three formats, then the decision of which format you should use comes down to which you are most comfortable using. There isn’t a best option—the choice between using XML, JSON, and YAML is based on if the systems being used support the format and which you decide to use.
Regardless of the data format you choose, expect to see the following concepts:
Objects: Objects represent characteristics of something you are referencing. For example, an object can be this book and characteristics are that it’s a technology book and its author is Joey Muniz.
Keys/values: Keys label a value type, while the value itself is the data. An example is the term time, the value for which can be 4:20.
Arrays (or list notation): An array is a list of options. For example, the recipe for an apple pie can be a list of ingredients that include sugar, apples, flour, butter, cinnamon, and a pie crust.
The sections that follow review each of these common data formats.
XML
Extensible Markup Language (XML) is a very popular method to use to format data. As its name implies, XML was designed to be extensible, meaning generic enough for a wide variety of applications. The look and feel of XML should make you think of a web page design, as that was XML’s original intent when created. XML is somewhat human readable and simple to create. A “< >” tag tells the operating system to open a section in XML and a “</>” tag represents to close a section. XML is a common way to encode data for APIs, which makes being able to read XML useful to IT pros looking to master automation.
The following code converts the plaintext file example I created for my daughter into the XML data format. Notice the list concept is represented in XML as <tag> to start the list and </> to end the list.
<? xml version="1.0" encoding="UTF-8" ?>
   <books>
      <book bookID="1">
         <lead>Joey Muniz</lead>
         <title>The Modern Security Operations Center</title>
         <genre>Technology</genre>
         <desc>A technical journey to understanding a SOC</desc>
      </book>
   </books>
JSON
JavaScript Object Notation (JSON) is a popular option for encoding API data. If you query a RESTful API using HTTP(S), the response you see will likely be in JSON format. Even though “JavaScript” is in the JSON name, JSON works with a wide variety of languages and applications. The format of JSON is different from XML but also is coded in a human-readable format. JSON heavily uses curly brackets ({ }) rather than the angle brackets (< >) used in XML, but the overall data structure is very similar to XML. JSON is also somewhat human readable and easy to understand and format.
The next bit of code is the same file example from the previous XML section but now formatted in JSON. Notice how the key value uses the “:” tag and lists are indicated in JSON by square brackets ([ ]).
{
   "books":{
      "book":[
      "author":"Joey Muniz",
      "title":"The Modern Security Operations Center",
      "genre":"Technology",
      "desc":"A technical journey to understanding a SOC",
      "_bookID":"1"
      ]
   }
}
YAML
YAML (representing the recursive acronym YAML Ain’t Markup Language) is a much more human-friendly data serialization standard for all programming languages based on the makeup of bits and pieces of other languages. This means YAML can be used with other programming languages, typically with the purpose to write configuration files. YAML is a superset of JSON, meaning it can do everything JSON can do. To break down how YAML relates to other popular programming languages, YAML uses scalars, lists, and associative arrays based on how they are used in Perl. YAML uses the document separator ---, which is also used in the Multipurpose Internet Mail Extensions (MIME) standard. YAML escape sequences are similar to C and whitespace wrapping is done exactly like you would do with HTML. Due to these overlapping characteristics with popular programming languages, YAML can be used with nearly any application that needs to transmit and store data.
The next big of code is converting the previous XML and JSON example code into YAML.
---
- books:
      book:
- author:Joey Muniz
- title:The Modern Security Operations Center
- genre:Technology
- desc:A technical journey to understanding a SOC
- bookID:1
I’ll further explain YAML based on how it is used by Ansible, which is a tool covered later in the “Ansible” section. The first key concept to know about YAML is its core components. The contents of a YAML file define a single data structure that is composed of nested nodes, which means the whitespaces matter. The most common special characters in YAML you need to know are the following:
: Used between key/value pairs
- Denotes a sequence entry, meaning a list item
# starts a comment
Note
There are other special characters in YAML that you need to be aware of so that you don’t enter one incorrectly and cause YAML to fail to parse your data. See https://www.tutorialspoint.com/yaml/yaml_syntax_characters.htm for more information on YAML special characters.
The basic structure of a YAML file is a hash map, which is a data structure that implements an associative array (a structure that can map keys to values). An example of this hash map/key value system is mapping Jenny to the value 8675309. When I reference Jenny, I can abstract the value 8675309, making 8675309 a characteristic of Jenny. This concept applies to most data formats, including XML and JSON.
Much like other programming languages such as Python, YAML uses indentations to denote a change in scope level, which makes whitespaces significant. You can see a similar characteristic in the previous XML and JSON examples with a subset concept, such as the title of the book is indented with whitespace while the main topic (books) is not indented, allowing the understanding that the title is part of the book concept.
The following is a second YAML code snippet example that demonstrates these basic YAML programming concepts. Notice the - depicts a sequence entry, : is used between key values as well as to start the do statement, and # is used for comments to explain what each part of the code does.
#This program will divide one number by another
- divider:
    do:
      divide:
        - dividend: ${input1}
        - divisor: ${input2}
    publish:
      - answer: ${quotient} #Answer represents the result of the division
    navigate: [{ILLEGAL: FAILURE}, {SUCCESS: printer}]
Let’s look at a third example YAML file that can be run in Ansible to better understand YAML programming logic and see a more complicated YAML program. This YAML program represents a playbook that has two parts. The first part focuses on updating web servers, while the second part updates database servers.
---
- name: Update web servers
  hosts: webservers
  remote_user: root

  tasks:
  - name: Ensure apache is at the latest version
    ansible.builtin.yum:
      name: httpd
      state: latest
  - name: Write the apache config file
    ansible.builtin.template:
      src: /srv/httpd.j2
      dest: /etc/httpd.conf

- name: Update db servers
  hosts: databases
  remote_user: root

  tasks:
  - name: Ensure postgresql is at the latest version
    ansible.builtin.yum:
      name: postgresql
      state: latest
  - name: Ensure that postgresql is started
    ansible.builtin.service:
      name: postgresql
      state: started
Notice that --- starts the program. The next part calls out variables, also known as hash maps. For example, when the remote_user info is referenced, the value of “root” is pulled. The tasks section tells the program what to do. Feel free to load this program into Ansible after I walk you through how to set up your Ansible environment later in this chapter.
If you want to run this YAML example or any playbook in Ansible, you need to use the command ansible-playbook playbook.yml -f 10. I recommend checking out YAML tutorials and trying out very simple program examples before attempting to develop your own code. Later in this chapter, you will learn how to build your own SOAR lab using Ansible. Ansible is based on YAML, meaning it’s an application that builds YAML files as you use it. This also means you are expected to be able to program in YAML if you plan to use Ansible.
Note
Ansible provides a tutorial for understanding YAML at https://docs.ansible.com/ansible/latest/reference_appendices/YAMLSyntax.html.
Understanding the details of this YAML program or the previous examples is not important at this point. The three YAML examples were intended to show you that YAML is easy to read and follow regardless of your programming background, to give you a general idea of how YAML is structured, and to enable you to recognize YAML code, which you are likely to run into as you learn more about DevOps.
Note
There are many good free YAML programming tutorials available on the Internet. One example is the Tutorials Point tutorial at https://www.tutorialspoint.com/yaml/index.htm.
Data Modeling
Another DevOps concept that is important is data modeling, which is different from what YAML, JSON, and XML offer as data formats. YANG is viewed as a data modeling language used to model configuration and state data. This means YANG defines data schemas that JSON or XML must follow. Think of YANG as a guardrail as well as a translator setting the rules for what is allowed and translating what is allowed into an understood format. Anything that falls outside of the guardrail will be rejected, forcing only approved formatted data to be translated, sent, or received. This is critical for accommodating the various data formats the SOC will encounter as it leverages data from different internal and external databases.
When working with a device that supports YANG data stores, a specific XML or JSON encoded message would be deemed valid or invalid based on YANG models. YANG can be used with other protocols; however, it is most commonly used with the Network Configuration Protocol (NETCONF). The reason for this is that YANG provides a way to show how configurations are modeled, while NETCONF is a protocol that can modify them.
Figure 10-22 provides a dataflow example of the YANG serializer’s capability of encoding and decoding arbitrary structures into something like XML or JSON. For decoding, YANG pulls data into memory and decodes it to a data node. Once data is ready to be encoded, it is encoded from a data node back to a data stream such as XML or JSON. As you can see from this example, data modeling allows for data to be converted into a desired data format such as JSON or XML.

FIGURE 10-22 YANG Serializer Flowchart
NETCONF
To best explain NETCONF, first consider the Simple Network Management Protocol (SNMP), which has been the traditional method used by network administrators for monitoring and modifying configurations. An example of using SNMP is pulling status from a running device or pushing a change such as changing an interface VLAN. Certain versions of older NAC technology would use SNMP as a way to push changes to switch ports. SNMP is not going away anytime soon; however, SNMP is not optimized for automation, leading to the need of a more programmable version of SNMP as network administrators want to explore DevOps concepts. NETCONF provides programmability based on a simple, standards-based, and robust API to read and modify configurations ideal for orchestration.
NETCONF follows a traditional client/server model using remote procedure calls (RPCs). Server configurations are stored in a NETCONF configuration datastore that follows a YANG-defined data format. To query or modify data, a client sends an XML-based RPC over one of the supported secure transfer methods, and the server replies with XML-encoded data. You can reference RFC 6241 to get a better understanding of NETCONF operations, which are defined by YANG. Figure 10-23 represents the YANG NETCONF process.

FIGURE 10-23 Example DevOps Communication with YANG and NETCONF
RESTCONF
A protocol similar to NETCONF (not a replacement) is RESTCONF. RESTCONF uses the RESTful HTTP interface that can be used to query and configure devices with NETCONF configuration datastores. RESTCONF is an HTTP-based protocol that supports both JSON and XML, whereas NETCONF uses just XML. When you leverage RESTCONF with a scripting language like Python, you can automate a wide variety of network administration tasks.
To see examples of NETCON and RESTCONF used with YANG, check out the Cisco DevNet GitHub at https://github.com/CiscoDevNet. One example is a script that can provision or delete a VLAN interface on an existing interface that is connected to an upstream switch using a 802.1Q trunk. (You can find this example script at https://github.com/CiscoDevNet/restconf-examples/tree/master/restconf-samplecode/vlans.)
DevOps Tools
So far, you’ve learned a lot of general DevOps fundamental concepts, including file formats and data modeling. Now let’s look at different types of DevOps tools that help you to create orchestration and automation in your SOC services. DevOps is a fundamental component of enabling SOAR capabilities.
It is common to start your DevOps journey by creating playbooks and applying various DevOps techniques to different steps of a workflow based on a desired outcome. Maybe you want to push changes to switches when an event occurs. Maybe you want to send alerts to specific team members when security tools identify a potential malware outbreak. How you leverage DevOps to develop SOAR capabilities, ranging from case management to automated response, depends on what tools you have available and what is the best option to accommodate your workflow.
DevOps Targets
The following list highlights aspects of playbooks that are ideal for applying the DevOps concepts covered in Chapter 9. There are many other good use cases; however, these use cases are very common areas to which DevOps programming is applied to simplify elements of common workflows.
Analysis of code and configurations: Analyze code or configurations so that the team can quickly identify potential vulnerabilities or problems
Submitting changes: Allow for anybody to submit changes to increase productivity yet ensure all changes meet compliance
Monitor compliance: Continuously validate that the SOC is following all policies and procedures and can collect data to prove compliance when requested
Investigate threats: Collect what is needed for an analyst or an automated system to provide the quickest yet most effective response to an incident
Vulnerability management: Identify and manage IT-related vulnerabilities in the organization
Training and enforcing security: Ensure security practices are enforced and offer notifications to encourage more secure behavior
Delivering value from DevOps does not always require creating a new tool or coding a script. Suppose you need to change the switch port of a switch when an event occurs. A SOC could first manually use a port security approach and later either leverage a vendor tool such as NAC or rely on a programmer to create a program that is triggered when a certain event occurs. That program could be part of a script that is executed in a SOAR platform, representing the automation of steps in a playbook. That program could also be a dedicated tool that is called upon by the SOAR to perform the changes to the switch. It all depends on what tools your SOC has available and what is the best approach to accomplish each SOC service goal.
DevOps tools can essentially be broken down into two different categories of functionality—manual tools and automation tools. Keep in mind that both manual and automated tools are designed to provide configuration management and improve the workflow of playbooks but use different approaches to accomplish this goal. Both tool options can also work with a SOAR or be part of a SOAR’s feature set.
Manual DevOps
Manual DevOps tools can provide three main areas of value to a SOC. The first is knowledge management—the ability to create an accessible knowledge base and make it searchable. Doing so allows the accumulated wisdom to be replicated to other teams, which supports more effective responses to similar situations. As fantastic as this concept sounds, you need the right tool to benefit from this approach of knowledge sharing. I have seen knowledge management tools not properly utilized, leading to huge forums of data that take users hours to crawl through to find what they are looking for. I highly recommend evaluating how created content is organized and referenced. ChatOps, covered later in this chapter, make this concept even more interesting by enabling you to quickly reference material by voice. A SOC analyst can simply pull information without having to touch a keyboard.
The second key area of value that manual DevOps tools can provide is streamlining a SOC’s incident management service. The first value point, knowledge management, impacts this value point because a well-built knowledge management system will improve how a SOC executes playbooks according to its incident management established processes. I highly recommend any SOC with incident response management services convert playbooks into a knowledge management system, which is a very common practice found in mature SOCs around the world.
The third value from manual DevOps tools is their ability to leverage automation. I use the word “leverage” because manual DevOps tools do not offer automation capabilities such as what I’ve referenced in this chapter when speaking about building automation. Manual DevOps tools launch existing automation scripts such as asking a ChatOps tool to run something rather than spending time within a ChatOps tool writing an automation script.
There is a lot of value in having manual DevOps tools launch scripts. Automation leads to repeatable results and control over how automation is launched, which keeps the workflow functioning properly. For example, if a common situation is reported in a wiki, a DevOps programmer could write a script that automates the suggested response and post a link in the wiki for others to benefit from when they encounter the same situation. The wiki tool would not be used to create the script but rather to host a link to the script as part of a suggested response.
The DevOps manual tool categories of wikis and ChatOps are both based on manual processes, but they enhance the workflow of playbooks in slightly different ways as described in the sections that follow.
Wikis
Wikis are hypertext publications composed of collaborative edits and are managed by their own audiences via web browsers. When a SOC develops a playbook and applies a wiki tool, steps not only can be documented with responses to predicted questions, but can also be adjusted as the playbook is put into action, allowing for continuous improvement. Wikis are focused on process management and information flow across the course of an action designed for a SOC analyst to reference as a playbook is executed similar to a manual covering how to use a tool.
Regardless of the platform you choose, wikis must be programmed and maintained to avoid responses becoming obsolete as various aspects of the playbook change over time. Figure 10-24 is a screenshot of a fresh install of MediaWiki, which shows what the basic platform looks like. To get an idea of what is involved with installing MediaWiki on Linux, for example, check out the configuration guide at https://www.linuxtechi.com/install-mediawiki-on-linux/.

FIGURE 10-24 New Installation of MediaWiki
The following lists are popular wiki platform options to consider for your SOC:
MediaWiki: Free tool that Wikipedia was built on. MediaWiki facilitates effective management of a wide range of information types with easy to insert and edit options using any database such as Oracle, PostgreSQL, SQLite, or MySQL.
Confluence: A commercial wiki option providing management of tasks through managed ticketing functionality. SOC analysts can create, edit, assign, and track tasks with the Confluence tool.
TikiWiki: A business-focused platform for developing blogs, forums, wikis, and calendars.
DokuWiki: A free option for document management, where you can save your documents as files rather than saved within a database. This means documents are plaintext format, allowing for various read and create options.
ChatOps
ChatOps tools are designed to increase collaboration through simplified communication similar to wikis but with a focus on communication rather than creating dynamic workflows based on documenting steps on a wiki forum. ChatOps systems provide instant message options as well as ways to document and reference conversations, allowing for ongoing improvement of processes based on daily activity. Unlike wikis, where workflows are configured, ChatOps workflows are built based on communication that occurs. SOCs around the world have found ChatOps to be an essential tool to improve communication and increase documentation of the workflow of a playbook.
ChatOps automates tasks using a quasi-intelligent, conversational interface to query information and initiate scripts that perform repetitive tasks. A great example with similar functions is Amazon Alexa. Using a voice-activated system, you can launch tasks to connected devices, including turning on/off the alarm system for your house, turning on/off lights, and playing music. As you use Amazon Alexa, it learns your behaviors and is able to recommend things based on what you do, representing a form of machine learning.
There are a handful of industry-recognized free and commercial ChatOps options to consider. The following are some of the more popular options:
Cisco Webex Teams: Cisco’s version of ChatOps bringing together messaging, file sharing, video meetings, whiteboarding, calling, and other tools targeting improving teamwork.
Microsoft Teams: Microsoft’s business-oriented communication and collaboration platform. Tools include messaging, file sharing, video meeting, and other collaboration tools.
HipChat: Ticket-based chat system that allows for creation of groups for easy collaboration. HipChat offers public or private rooms, exchanging files, and URLs to streamline team collaboration. Both free and paid options are available.
Slack: A popular platform for facilitating team conversations while also allowing the creation of private or public channels. There are both paid and free options of Slack.
Automated DevOps
Building automation leads us to the other major category of DevOps tools, those that are designed for creating automation rather than just referencing existing automation. There are many variations of automation tools, but in the world of DevOps, the most popular ones provide configuration management capabilities, which means they are designed to deploy, configure, and manage servers. All applications have some form of a settings menu for configuration management, so the concept of configuring servers shouldn’t be new to you. What makes DevOps special is that it offers automation across any vendor to improve the workflow of a playbook.
When it comes to market share for DevOps automation tools, Ansible, Puppet, Chef, Jenkins, SaltStack, and Microsoft Endpoint Configuration Manager are all popular options. Many DevOps training programs leverage Ansible, which tends to fall in the top five DevOps automation options used in organizations and is open source, which makes it easy to acquire for testing purposes.
The next section shows you how to build a basic Ansible environment to practice DevOps configurations. Enterprise offerings can be easier to use and typically provide more features, including wizards and plug-and-play programming; however, Ansible can be more flexible because it is open source, and it’s a great tool for learning how a SOAR functions.
The following provides a brief summary of Ansible and other popular DevOps automation tools:
Ansible: Ansible is an open-source software provisioning, configuration management, and application deployment tool enabling infrastructure as code. Ansible runs on most Unix systems but can configure both Unix and Microsoft systems. You will learn how to configure Ansible on a Linux system in the following section.
Chef: Chef is another popular-open source automation software that uses build blocks to configure systems similar to recipes in a cookbook, which is how it got its name. Chef is used for infrastructure automation and can help reduce manual and repetitive tasks for infrastructure management.
Jenkins: Jenkins is an open-source automation tool built for continuous-integration purposes. Jenkins offers hundreds of plugins to support building, deploying, and automating most projects.
SaltStack: SaltStack is a configuration management and orchestration tool that helps in the deployment of dynamic applications and general-purpose infrastructure they run on.
Puppet: Puppet is another open-source configuration management and deployment tool. The value of Puppet is its capability to spread automation across an organization.
The best way to learn a concept is to see it in action through hands-on experience. Next, I’ll walk you through how to build a basic Ansible setup. I’ll also show you automation examples and provide resources for further learning. Let’s get started!
DevOps Lab Using Ansible
One good way to wrap together all of the topics I covered around playbooks, automation of workflows, and programming workflows is through hands-on experience. A very popular automation tool you can use for this purpose is Ansible. Ansible calls itself a universal language used to develop repeatable playbooks. Ansible functions in an agentless format using Secure Shell (SSH) and network traffic; however, some specific software and hardware manufactures offer plugin enhancements, but these are optional.
Ansible allows SOC teams to create Ansible playbooks. An Ansible playbook is essentially a configuration file for Ansible, written in YAML, that is a set of tasks, device settings, and configurations that happen in a sequence specified by the creator of the playbook, hence a workflow. Playbooks can be simple tasks, such as backing up configurations, or as complicated as setting up multiple network devices, servers, VLANs, and firewall rules. Because the steps in the Ansible playbook are automated, the workflow is improved, giving time back to the SOC analyst as well as ensuring a repeatable delivery is executed and tracked by Ansible.
Note
Check out https://www.ansible.com/ for more details on what Ansible can do for your SOC.
Installing Ansible
The first thing you need to do for your SOAR lab is install Ansible. You can run Ansible on a variety of operating systems, but most SOCs I’ve encountered run it on a Linux system. For purposes of this example, I will explain how to install Ansible on Ubuntu Linux. You should not have any issues running Ansible on any recent version of Ubuntu, but I recommend validating the minimal required specs at https://docs.ansible.com.
The first Ansible installation step is to perform basic housekeeping of your system. For Linux, you do this by running update and upgrade commands on your Ubuntu system. The fastest way to do this is to run the command sudo app-get update -y && sudo apt-get upgrade -y. Once the update is complete, you will want to check that Ansible is not already installed on the system. You can do this by issuing the command ansible --version from the terminal. You should receive a message stating the program is not installed.
Next, run the command sudo apt-get install software-properties-common, which installs some standard libraries and shares software Ansible uses. It’s possible the update you ran to prepare your system will have updated and installed this software, so don’t worry if there is nothing to update or run after running the software-properties-common command.
Next, add the Ansible repository to your operating system by issuing the command sudo apt-add-repository ppa:ansible/ansible. You may be prompted to accept user agreements, which you must accept to proceed. The final step is to install the Ansible software by issuing the command sudo apt-get install ansible. You can verify the installation is complete by using the command ansible --version.
A summary of the installation steps is as follows:
sudo app-get update -y && sudo apt-get upgrade -y
ansible –version
sudo apt-get install software-properties-common
sudo apt-add-repository ppa:ansible/ansible
sudo apt-get install ansible
ansible –version
Setting Up Ansible
Ansible, by default, is installed under /etc/ansible. The first file you will examine is the Ansible hosts file. The Ansible hosts file works exactly like the system OS file, which means it resolves hostnames that Ansible interacts with to their IP addresses. Even if you have DNS or predefined hosts files on your system, you still need to set up the Ansible hosts file. Think of the Ansible hosts file as the inventory of useable systems that Ansible has access to configure. Figure 10-25 shows the my host file.
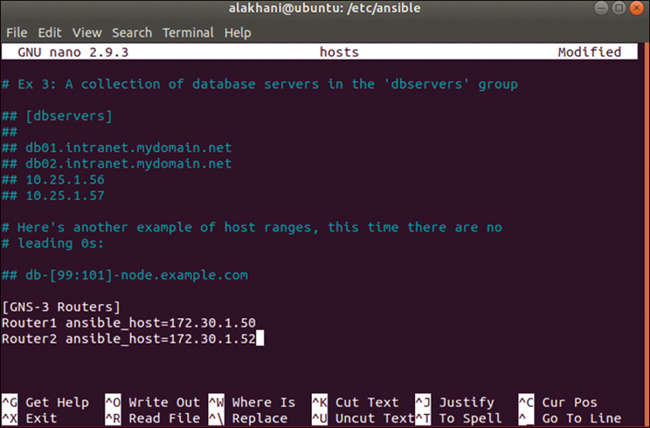
FIGURE 10-25 Ansible Hosts File
For this example, I have created a group for my routers and have named that group GNS-3_Routers (you want to avoid spaces, if possible, in your names). I also have two different entries under the group I named GNS-3_Routers. Ansible is known for its scaling features, and this is one of the ways it achieves that. Any playbook that is called by Ansible that uses these specific group names as defined in my hosts file will know which systems to reference. In my example, I only have two hosts, but it is not uncommon to find Ansible groups containing thousands of hosts. At this point, your basic Ansible installation is complete and you are ready to create your first playbook.
Ansible Playbooks
After you populate the Ansible hosts file, you are ready to create your first Ansible playbook. Remember that an Ansible playbook is a configuration file in YAML format representing a set of tasks you want to perform. The first and most common task needed for automating a workflow is accessing a system. It is common for a SOC to set up an SSH digital certificate for Ansible to authenticate to the device it is accessing during an automated workflow step. You can also use usernames and passwords, but certificates are more common. This can be accomplished leveraging the YAML program language.
To see how this works, let’s examine a basic Ansible playbook that allows me to back up Cisco routers I have already defined in my example Ansible hosts file. The following code is an example of my playbook that accomplishes this goal. If the YAML format seems confusing to follow or understand, look back earlier in this chapter for my brief overview of YAML, which explains the core components of what to expect in a YAML file.
---
- hosts: Router1
  gather_facts: true
  connection: local
  tasks:
   - name: show run
   ios_command:
   commands:
     - show run
     host: "{{ ansible_host }}"
     username: admin
     password: cisco
     register: config

  - name: save output to /etc/ansible/router_backups/
  copy:
  content: "{{ config.stdout[0] }}"
  dest: " /etc/ansible/router_backups/ show_run_{{ inventory_hostname }}.txt"
Looking at this example, the first thing to notice is how the file starts with three dashes. Remember that every YAML file starts with three dashes to inform the computer that this is a YAML file. Next, there is a single dash followed by a space and the word hosts. This is where you enter the name of a host that is referenced in the Ansible inventory. The “connection: local” line indicates that an SSH connection is sourced from this server, meaning the server running Ansible. When you are running larger Ansible deployments, you might want connections to be sourced from different geographic regions to improve efficiency. This is a key point. Recall from earlier in this chapter that one key value from a SOAR is reducing task overhead by leveraging more effect searches. This is an example of how time can be saved through tactical device access built into the automation.
The tasks and commands part of the previous configuration file is the most critical part of the configuration file because it includes the actual commands I want to run. When you see things in brackets or double brackets, they represent variables. You can replace those variables with the name of the system you are connecting to. For example, you might decide to run this playbook on a hundred hosts but want Ansible to automatically name the backup configuration file as the same name as the host being evaluated. Figure 10-26 shows the example playbook file in the Nano text editor.
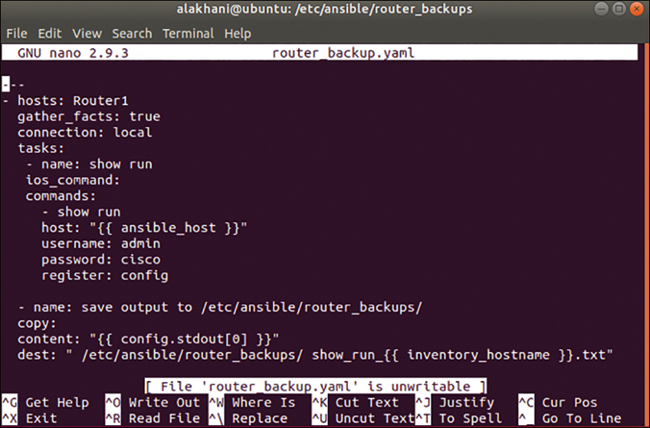
FIGURE 10-26 Executed Ansible Playbook Example
There are many resources you can access to obtain more Ansible playbook examples. The purpose of walking through Ansible is for you to get a feel of setting up and developing a basic playbook using an open-source SOAR that can automate a simple task such as backing up a router configuration. If you need to brush up on your YAML programming skills, look back to the YAML section in this chapter for references to YAML tutorials provided by the creators of Ansible.
Note
Colin McCarthy of many useful Ansible playbook examples on his GitHub repository, located at https://github.com/colin-mccarthy/ansible-playbooks-for-cisco-ios.
Now that you have a SOAR lab that you can use to practice DevOps concepts, you need a task to automate. One extremely popular task to automate is blueprinting an endpoint, meaning pulling details about an endpoint. This task is extremely useful for various SOC services, including vulnerability management so that you know what to scan for vulnerabilities, as well as incident response so that you know what is occurring on a system impacted by an incident. Next, I’ll work through how to use Osquery to perform endpoint blueprinting. You can use your Ansible lab to automate this process.
Blueprinting with Osquery
Guidelines such as NIST 800-53 Rev4 CM-11 outline a need for identifying what is installed and running on systems within an organization. Identifying what is installed and running on host systems is sometimes referred to as establishing a blueprint of that system. Blueprinting queries what hardware and software are in your environment and attempts to understand the capabilities related to what is collected. This is slightly different from the baselining concept referenced earlier in this book, which develops an understanding of what is considered normal and looks to identify outliers. Compiling a blueprint of the organization’s managed endpoints enables the SOC to have visibility into endpoints so compliance to security standards can be monitored and enforced.
The goal of blueprinting is to identify systems that do not meet corporate standards for security, proactively address vulnerabilities, understand what is operating in the environment, including applications installed on systems, and map out an overview of risk associated with what is connected within an organization. It is common for security tools such as vulnerability scanners, SIEM/SOARs, and NAC technology to include variations of blueprinting capabilities.
The use case in this section presents Osquery, an open-source tool for investigating metadata from endpoints. If you want to query an operation, such as a specific PowerShell command, Osquery allows you to build predefined rules to search for such functions. Many EDR offerings have similar functionality. Among the values offered by Osquery are its ability to be customized, scalability options, use of common languages, and industry support.
In order for Osquery to function, an organization must have control of the systems on the network, including having administrative privileges and having the ability to install software. It is common practice for organizations to use orchestration tools such as Ansible, Puppet, and Chef to push out and deploy Osquery, which makes Osquery a great use case to understand and test with your Ansible lab. Osquery can provide event information such as new accounts being created on a system, failed login events, the creation of files, and what processes are running on a system. The real power of Osquery’s visibility, however, is grouping what is seen together into a potential risk, such as flagging when PowerShell is launched after an Excel file is executed. Next, I will walk through a simple Osquery installation so that you can add this tool to your lab.
Note
The website https://osquery.io/schema/ has a list of the schemas supported for each version of Osquery. This gives you an idea of all the data being collected from endpoints.
Running Osquery
There are two different approaches to installing and running Osquery. One option is to deploy a centralized managed and reporting method. The other option is a standalone method. For simplicity, I will walk through the standalone install option on Ubuntu. Step one is to go to the Osquery website, https://osquery.io/, and click the Downloads menu. On the Downloads page, you have the option to choose which version you want to download. Always make sure to use the latest version available.
Note
The Release Type option offers the choice of an official release or a debug version. The debug version is targeted for software developers.
Next, choose one of the download options: macOS, Linux, RPM, Debian, or Windows. For purposes of this example, I downloaded the Debian version of Osquery. To install what I downloaded, I opened a terminal, navigated to the folder where the Osquery package was downloaded, and used the command dpkg -i osquery, as shown in Figure 10-27.
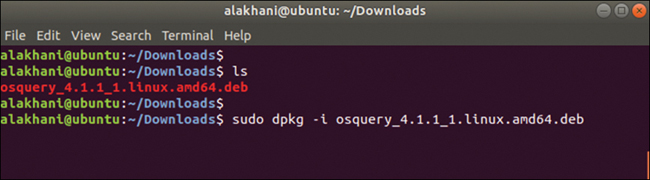
FIGURE 10-27 Installing Osquery on Ubuntu
To start using Osquery from the command line, type osqueryi. At this point, you can issue any SQL command Osquery supports. Figure 10-28 shows an example of running select * from uptime; to see the uptime and running select * from logged_in_users to see logged-in users.

FIGURE 10-28 Osquery Uptime and Logged-in Users
I highly recommend reviewing https://osquery.io/schema to better understand what queries you can run using Osquery. Two common Osquery use cases used by SOCs is to search for configuration settings or be alerted when there are changes in settings for disk encryption, software, firewall settings, or querying usernames. Figure 10-29 shows Osquery running a simple SQL command on macOS to show all the usernames on the system.

FIGURE 10-29 macOS User Query
Apple device owners, such as those using a Mac Book Pro, might be surprised to know that your Apple device has dozens of default usernames that are included with the standard operating system install. To check the details, perform a SQL query to find out exactly how many usernames your device has. As shown in Figure 10-30, according to Osquery, the example system has 101 different usernames! Surprisingly, this is expected with a standard macOS install with one person using it.
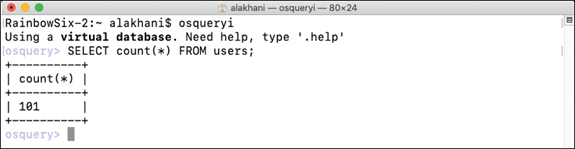
FIGURE 10-30 Osquery Username Count
The visibility capabilities that Osquery offers are very useful, but the real value comes from the potential of its automation capabilities. For example, when conducting remediation for a network-wide event, Osquery can push a fix to all systems, versus requiring the SOC incident response team to address each system individually. A similar concept can apply to developing widgets in a SIEM solution that monitor the risk associated with endpoints through continuous evaluation based on what data Osquery collects from endpoint systems. I recommend trying to automate some simple Osquery tasks with Ansible to get a better understanding of how a SOAR can leverage tools like Osquery.
There are other forms of DevOps, including those focused on the network and on the cloud. This leads us to the next topic, DevOps focused on the network.
Network Programmability
Network programmability, which many in the industry call NetDevOps, applies the DevOps principles of software development to network programming. Older tools for monitoring and configuring networks, such as SNMP, syslog, and ping, work, but there are much more effective ways to accomplish the same outcomes. Technology concepts such as NetFlow used for identifying security anomalies, machine learning, and streaming telemetry open up new network management concepts leading to automated and much more effective management of the network.
Think about the concept of “the network” and what that means to you and your organization. Today, the network no longer just means a routing and switching network. The network can include cloud technologies that host your applications, and your local users will need a way to access those cloud-based applications. Your local datacenter will also have applications that users offsite will need to access. A network will always be between your applications, and the SOC needs a way to configure and monitor that network. Traditional network management heavily relies on SNMP and syslog; however, a better method is needed to keep up with current trends in automation and collaboration requirements between network architects and IT operators, allowing for a more streamlined flow of running and securing the network, wherever it may be.
These collaboration challenges among different teams in an organization have been painful for many organizations. Consider as an example performing the steps to add a server to the network. The datacenter team understands how to provision a server, but they need IT operations to provide network access and need the security team to open a firewall and other security tools to allow traffic to and from the server. The value DevOps brings to the table is huge in regard to reducing the number of manual siloed steps that need to occur to get things done. By allowing tools to work together, cross-team tasks can be automated.
Learning NetDevOps
Manufacturers of networking equipment, such as Cisco, have adjusted their education and certification programs to accommodate a change in behavior toward managing networks following DevOps trends. For example, Figure 10-31 shows an overview of the Cisco engineering and software development certification programs, indicating the software program is targeting DevOps skills with a focus on NetDevOps, meaning how to make the network work with other tools. Cisco expects certification candidates to demonstrate skills such as Python, NETCONF, and YAML used to manage and modify existing networks rather than how to build new Cisco networks.

FIGURE 10-31 Cisco Engineering and Software Certification Programs
Another network market leader, Juniper Networks, offers its own flavor of DevOps certifications based on an associate and specialist Dev Ops program (see https://www.juniper.net/us/en/training/certification/certification-tracks/devops?tab=jnciadevops). Juniper’s programs include mastering Juniper as well as open-source DevOps tools such as Python and Ansible. Similar programs are starting to be offered across the industry based on the drive for managing networks using the latest DevOps concepts. In short, if you are looking to manage IT networks, DevOps is a topic you are either now or eventually going to need to master.
DevOps certification programs require learning programming concepts but also have a heavy focus on application programming interfaces, which enable machines to talk to machines. In the DevOps world, this means allowing a tool such as Ansible the access rights to make changes to a network switch in the same manner a network administrator would work. APIs come with a set of requirements that govern how one application can talk to another, which is why tools like YANG exist that are designed to ensure API specifications are met. Many vendors follow industry specifications that allow API support to work across multiple vendor products. A good analogy is thinking about a power plug. In theory, your home’s power plugs could shape the holes in the plug or adjust the amount of power delivered; however, the manufacture of the plug decides that won’t be useful for its purpose. Instead, there are general standards that are expected for how the holes look in the plug and the amount of power that is generated. Vendor API rules are very similar insofar as they could be designed however the vendor sees fit but instead typically follow the industry expectations of what is supported. This is great for developers because a universal API structure means scripts and programming can work across many vendor platforms.
APIs
In a non-DevOps world, a network manager communicates with network devices using a graphical user interface (GUI) or connects to a system using its command-line interface (CLI). To simplify tasks, a network operations manager can use scripts that pass multiple lines of configuration through the CLI. This concept is essentially using the CLI like an API, but it’s a user pushing code rather than one system pushing the configuration to another. Regarding GUIs, SOAP is a way to perform API-like commands for web services; however, the representational state transfer (REST) standard was later developed to offer a much simpler approach to building web services based on API-like concepts. SOAP and REST are HTTP focused, whereas XML and JSON have a remote procedure call (RCP) API function, meaning one system requesting another system to do something and return a value. For network-focused tasks, SNMP is available, but the newer and more DevOps-friendly option is NETCONF and RESTCONF, which provide REST API-like interfacing with the network. These are essentially different examples of API-like protocols you can use to allow your tools to communicate with each other.
NetDevOps Example
To tie together concepts of using APIs to automate tasks, I’ll use a free lab offered by Cisco, DevNet Sandbox (https://developer.cisco.com/site/sandbox), to show you how to test how APIs work. I encourage you to perform the same exercise if API concepts are new to you. When you access the Cisco DevNet Sandbox lab resource center, you will find that it offers many always-on and startup labs that allow you to test many of the concepts from this chapter. Figure 10-32 is a screenshot of the Cisco DevNet Sandbox lab catalog. Any lab with a Reserve button requires you to schedule the lab, while the labs with the Always On button are available immediately. Know that “always on” means the lab is read-only, because anybody can access it at any time, while reserved labs allow you to configure and essentially break things if you so desire.
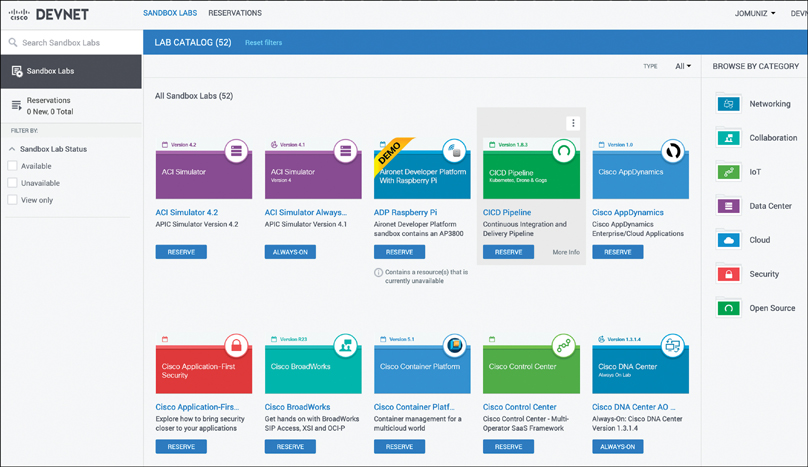
FIGURE 10-32 Cisco DevNet Sandbox Lab Catalog of Free Labs
This next exercise demonstrates the always-on lab called IOS XE on CSR Latest Code AlwaysOn. This lab provides access to a Cisco Cloud Services Router (CSR) running IOS XE code, meaning I can try to push configuration changes to this system using API calls. To simplify sending APIs commands, I’ll use Postman.
Note
You can download Postman from https://www.postman.com/downloads/. Both free and commercial versions are available. You will be required to create an account, which will be part of the installation process.
NetDevOps Example Part 1: Using Postman
Postman is a tool that enables you to send REST API calls to any type of endpoint. Postman also allows you to save your calls, known as Postman collections, which represent example API calls you frequently use and want to bookmark. API requests use an HTTP method based on GET, POST, PATCH, PUT, and DELETE. Figure 10-33 shows the Postman interface running on a Mac. You can use Postman to push commands from your local device to the external DevNet Lab environment, representing how a SOC administrator can push commands from anywhere in the world to his/her organization’s network equipment.
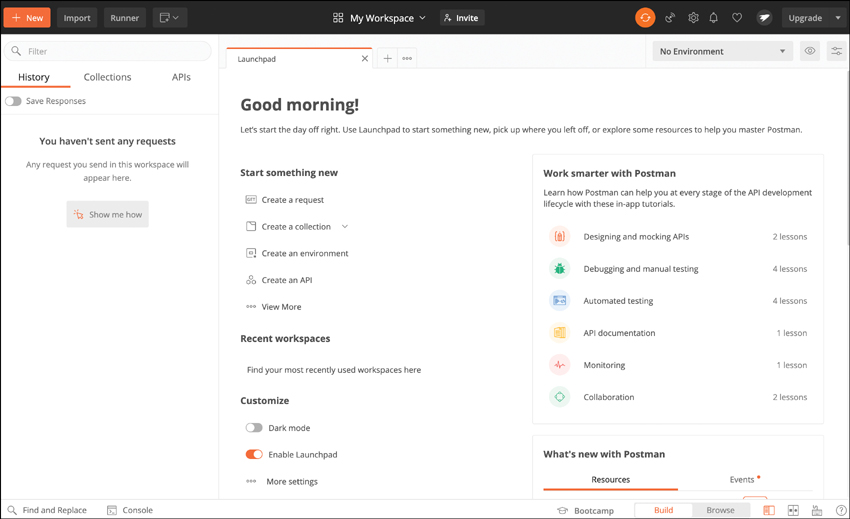
FIGURE 10-33 Postman Dashboard
Within the DevOps environment are the details of the Cisco CSR router that is waiting for me to send API commands to it. The following information comes from the always-on lab showing how to access the Cisco CSR router.
Access Details:
Developers and network engineers access the IOS XE on CSR Latest Code Always On Sandbox directly using the following information:
CSR1000V Host: ios-xe-mgmt-latest.cisco.com
SSH Port: 8181
NETCONF Port: 10000
RESTCONF Ports: 9443 (HTTPS)
Username: developer
Password: C1sco12345
NetDevOps Example Part 2: Capturing Configuration
This exercise uses Postman to capture the configuration of the Cisco CSR router using RESTCON. First go to Postman and click the New button at the top left, as indicated in Figure 10-34, to open a new workspace. Within the workspace, the GET field is where you enter the address and interface of the device you want Postman to communicate with. Because the Cisco router is located at ios-xe-mgmt-latest.cisco.com, you will want to use HTTPS, the address of the Cisco router, :9443 since that is the port opened for RESTCON, and restconf/data/ietf-interfaces:interfaces. You also need to click the Authorization tab and enter the username and password. Then, click Send to collect the configuration. Figure 10-34 shows how this looks in Postman.

FIGURE 10-34 Configuring Postman to Communicate with a Cisco Router
The results of running this successfully will be the configuration shown within the window below where you ran the commands. Notice that you can change the format by simply clicking the format drop-down menu; Figure 10-35 shows the configuration I pulled down in JSON format. Because this is a shared lab, you will find various configuration changes that have been pushed and labeled by others that have used this lab. The only configuration that can’t be changed is that of the interface (as indicated by DON’T TOUCH ME in Figure 10-35), as that is required for the Cisco router to be publicly available. Modifying that can take down the lab for everybody.

FIGURE 10-35 Configuration Pulled into Postman Example
This free DevOps lab is great for practicing how to leverage topics I covered including NETCONF, RESTCONF, and YANG to interact with various types of network, server, and security products. You can download YANG models, practice developing scripts using Python, and have systems online and available for you to interact with. If you have interest in learning more about NetDevOps, Cisco offers free classes at https://developer.cisco.com/ to complement the free DevOps labs that are available. I highly recommend leveraging this and other free online resources to gain hands-on experience with DevOps concepts so you can eventually translate those skills into building value within a SOAR platform such as Ansible or Phantom.
Note
You can find Cisco YANG models at https://github.com/YangModels/yang/tree/master/vendor/cisco.
Cloud Programmability
Another area of focus for the SOC is automating the configuration and management of cloud services. What is available to access in the cloud depends on what type of cloud service is being considered. Figure 10-36 shows a summary of comparing a traditional on-premises datacenter to different versions of cloud services. The easiest way to understand this diagram is to view what you, “the customer,” are responsible for and what the cloud service provider (CSP) is responsible for. In the traditional datacenter, the CSP is not involved, hence you are responsible for everything.

FIGURE 10-36 Comparing Cloud Services to On-Premises Services
The term Infrastructure as a Service (IaaS) represents handing off physical responsibilities to a CSP while maintaining control of what is installed and how that technology is configured. Physical responsibilities that are being outsourced to a CSP include powering the servers, racking and stacking equipment, and physically protecting the hardware. Everything else is still your responsibility as the customer.
The next level of outsourcing responsibility is Platform as a Service (PaaS), in which you not only outsource the infrastructure but also outsource what is installed, including the operating system and middleware. For example, if you don’t want to deal with installing or upgrading a generic Linux system, you can use PaaS to deliver a prebuilt Linux server, allowing you to deal only with the applications that are installed. PaaS is great for anyone who wants a standard build of an operating system without the worry about software updates; however, if your SOC needs customized systems, you will want to use IaaS.
The final option for outsourcing services to the cloud is Software as a Service (SaaS), in which everything is outsourced to the CSP. In a SaaS environment, you the customer have limited responsibilities that include the data and how the service is being used, but the CSP handles everything from what is installed to where it exits. With SaaS, you can’t install anything because you don’t have any backend access to the application. The benefits of this approach are that you don’t have to build the solution and the CSP handles all aspects of maintenance.
An analogy I like to use when explaining different cloud services and why customers choose each option is comparing choosing a cloud service to choosing what to eat for dinner. Your on-premises option is to plan your own meal, grow your own ingredients, and cook and eat your meal at a time of your choosing. The downside of that approach is the amount of time and work needed to do everything yourself. You will have to spend months growing all of the ingredients, preparing the meal, and cleaning everything up. This example is similar to running your own datacenter.
Another option for your dinner is to go to a grocery store and buy the ingredients but cook the food yourself. You save a lot of time by buying the ingredients rather than growing them, but the quality of the ingredients is probably not as good as if you grew them on your own, unless you pay for very high-quality ingredients. You can still customize the meal with the ingredients you purchased, meaning you maintain a lot of the responsibility for the meal and you also must clean everything up afterward. This second example represents IaaS, because you outsourced growing the ingredients to the grocery store (and its supply chain).
One dinner option growing in popularity is meal kits such as what Hello Fresh or Blue Apron offer. You are provided a box full of ingredients and instructions for how to create the meal; however, you can use those ingredients however you see fit. The cost for this option tends to be lower than going to a restaurant but higher than if you were to go to the grocery store and buy the ingredients on your own. You save time by having what you need to cook based on your goals for the meal you select for each day. This approach is similar to PaaS, in which you are provisioned an OS by the CSP you can use for any purposes, but that OS is typically sized for a specific need.
Finally, you could just go to a restaurant and order your dinner. This approach is the most efficient way to get a meal; however, it is also the most expensive and the option that you can’t modify. You also don’t have to clean up after you eat, which is really nice. This final example represents SaaS, where you outsource everything to a restaurant.
In each example, the more you outsource, the higher the cost for the meal and the less control you have over the meal, which can also mean lower or higher quality depending on what you are willing to pay. This is very similar to the logic with selecting cloud services. Organizations choose a service based on the level of control they want, what responsibilities they do not want to handle, what they are allowed to outsource, and what they can afford.
Orchestration in the Cloud
Your SOC is or soon will be using different cloud services to accomplish goals in your SOC services. Applications will be moved from the intranet to an IaaS environment or outright replaced by a comparable SaaS offering. Your SOC will need to be able to continue to improve services using orchestration and automation regardless of where the technology or data sits. You cannot let a cloud migration break your orchestration capabilities.
Looking closer at Figure 10-36, the different levels of outsourcing also represent what you as a customer can configure. Limitation in configuration options can also mean limitations in automation and orchestration depending on the CSP and what you are looking to accomplish. Chapter 1 already covered addressing some of these limitations in the context of securing different cloud services such as Amazon IaaS versus a SaaS service such as Dropbox. For IaaS, I covered various tools that can be installed, while SaaS environments are limited to cloud access security brokers (CASBs) and access control technologies.
Configuring security is different than configuring DevOps. The good news regarding DevOps concepts in the cloud is that the leading CSPs are heavily investing in pushing DevOps capabilities with the intent to encourage customers to use them for orchestration. The CSPs are doing this based on the cost savings organizations are seeing when leveraging orchestration and automation for services being outsourced to the cloud. As cost savings and capabilities offered by CSPs improve and show value to customers, more customers will be willing to hand off responsibilities to the CSPs, leading to more demand for cloud DevOps services; hence, more profits for CSPs, making cloud-focused DevOps a booming marketplace.
Amazon DevOps
One example of cloud DevOps options from a leading provider is what is available from Amazon at https://aws.amazon.com/devops/. Amazon defines DevOps as “the combination of cultural philosophies, practices, and tools that increases an organization’s ability to deliver applications and services at high velocity: evolving and improving products at a faster pace than organizations using traditional software development and infrastructure management processes.” A shorter way to summarize this explanation is Amazon sees DevOps as a way to improve how you can offer services from the cloud.
As a SOC, you are offering various security services, and leveraging cloud services can add value such as converting capital expenditures to operating costs using a pay-as-you-go model for your applications, scalability and elasticity of services, and outsourcing of certain responsibilities to allow for much more flexible SOC services. Elasticity is a huge value add, meaning you can always scale up if a major event occurs and throttle down when services are not being utilized. Considering Amazon’s size, your SOC could offer unlimited capacity and only be charged for what you need for your mission.
Amazon has categorized its DevOps-focused tools into the following groups:
Continuous Integration and Continuous Delivery: These tools allow you to securely store source code as well as automatically build, test, and deploy applications. Tools include workflows for releasing software, code testing, deployment automation, and even a user-friendly interface Amazon calls AWS CodeStar, making the entire process streamlined.
Microservices: Container and serverless computing is a massively growing field that enables more specific workflows and applications to be developed. Amazon offers support for Docker and AWS Lambda to meet such needs.
Infrastructure as Code: For customers who don’t want to reinvent the wheel, Amazon offers code templates that can be leveraged to quickly enable automation of monitoring and enforcing infrastructure configuration.
Monitoring and Logging: Amazon offers specific services targeting cloud-based network and application monitoring. Services include Amazon CloudWatch and AWS X-Ray.
Platform as a Service: Amazon offers the option to deploy web applications without needing to provision and manage the infrastructure and application stack.
Version Control: Customers can use Amazon to host secure, highly scalable Git repositories in the cloud.
Many of these services target IaaS; however, services such as AWS Elastic Beanstalk are focused on customers seeking DevOps capabilities within a PaaS offering. Elastic Beanstalk’s automation can provision the deployment of the desired platform, including considering the required capacity, load balancing, and enabling application health monitoring, all based on the code you upload to Amazon. Learn more at https://aws.amazon.com/elasticbeanstalk/.
SaaS DevOps
SaaS is becoming an extremely popular option for delivering SOC services. SaaS, however, can have some limitations to accomplishing DevOps goals.
SaaS-based DevOps will be much more limited depending on what APIs are available and the purpose of the service. Typical CSP service-level agreements (SLAs) not only explain what the responsibility of the service provider is, but also include responsibilities for allowing or not allowing different DevOps functionality. Know that you as a cloud customer can negotiate anything with a CSP, but the more you ask of the CSP, the more its service will cost you.
There are generally three types of CSP service-level agreements:
Single-customer SLA: This type of SLA addresses a single service for a specific customer. If you provide service to three departments, such as HR, administration, and marketing, a single-customer SLA would apply the same guidelines to all three departments.
Customer-level SLA: This type of SLA is more aligned with contracting with CSPs that market services to the general public. Because these CSPs offer similar services to thousands of different customers, they rely on generic SLAs that don’t have to be tailored to each customer. Each service being provided will have a separate section in the SLA.
Multi-level SLA: This type of SLA is a combination of a single-customer and customer-level agreement. This type of SLA is more common when a large organization outsources IT services, such as a large manufacture with hundreds of employees needing a place to create and store data. This agreement type covers services for each customer in the organization.
When evaluating an SLA, I stress the same advice I provided in Chapter 9 regarding cyber insurance, which is to make sure to include technical staff during the negotiation of what is being contracted. The most successful SLAs are simple, measurable, achievable, relevant, and time bound. Simple means the language is clear regarding what is expected from both the CSP and you, the customer. Measurable allows you to keep track of service use so that billing is predictable. Achievable means you have developed an SLA based on goals you can accomplish with the service. Measurable is also linked to achievable in that you must be able to measure your success rate toward achieving your goals. Relevant validates that the services are providing enough value to deem them worth the investment. Time bound ensures that you reevaluate services at some point in time.
Keep these points in mind as you evaluate potential SLAs with CSPs. In addition to including technical staff to help with defining your requirements, include legal experts to validate the language accurately depicts what you are hoping to achieve. Always keep in mind when evaluating cloud service providers that almost anything is possible, but at a price!
Summary
Security orchestration, automation, and response (SOAR) allows SOC engineers to concentrate on meaningful tasks, problems, and investigations in their environments and rely on automated scripts for more repetitive tasks. However, a SOAR is not just about automatically repetitive tasks. The power of a SOAR is that it dramatically reduces an organization’s attack surface by creating standard-based deployments of technology. Human error is eliminated, and deployments are based on tested playbooks that make the SOC more secure. Standard-based deployments also make it easier for the SOC to find potentially vulnerable software and services, in addition to threat actors that might be targeting their organization. Implementing SOAR concepts is not only an essential part of any security operations center but also one of the pillars a SOC must be built on.
This chapter covered all aspects of SOAR. First, you learned about the SOAR marketspace and the differences between SIEM, SOAR, EDR, and XDR platforms. You also saw examples of enterprise SOARs and learned what capabilities are common across SOARs and XDR offerings. You also learned how SOARs perform orchestration and automation by diving into DevOps programming. You learned about file formats, how to enforce data modeling, and how DevOps applies to your SOC’s services regardless if they use tools in the datacenter, across the network, or in the cloud. You also learned how to set up an open-source SOAR known as Ansible and how to use that lab to automate blueprinting using Osquery. The chapter also cited many resources for SOAR and DevOps concepts, including free labs and training guides that can help your SOC maximize a SOAR’s capabilities.
At this point of the book, you should have a firm grasp of the key concepts to planning, building, funding, and maintaining a mature SOC environment. The only topic left is what you should expect the future to hold for your SOC and other SOCs. Chapter 11 wraps up the book with a look at the future of the SOC.
References
Ansible Project. (2019). Installing Ansible. In Ansible Installation Guide. Red Hat, Inc. https://docs.ansible.com/ansible/latest/installation_guide/intro_installation.html
Amazon Web Services (AWS). (n.d.). What Is DevOps? AWS. https://aws.amazon.com/devops/what-is-devops/
Creately. (2020, December 1). Ultimate Flowchart Tutorial (Complete Flowchart Guide with Examples). Creatley Blog. https://creately.com/blog/diagrams/flowchart-guide-flowchart-tutorial/
Incident Response Consortium (IRC). Playbook – Virus Outbreak. IRC. https://www.incidentresponse.com/playbooks/virus-outbreak
ISACA. (n.d.). COBIT 2019 Framework (various publications). ISACA. https://www.isaca.org/resources/cobit
Oren Ben-Kiki, O., Evans, C., & döt Net, I. (2009, October1). YAML Ain’t Markup Language (YAML) Version 1.2. YAML.org. https://yaml.org/spec/1.2/spec.html
Vertis. (n.d.). DevOps Automation Tools: Configuration Tools for Continuous Deployment. Vertis. https://www.veritis.com/solutions/devops/made-easier-with-devops-tools/#:~:text=DevOps%20tools%20facilitate%20ways%20for,for%20an%20effective%20product%20output
W3Schools. (n.d.). Introduction to XML. Refsnes Data. https://www.w3schools.com/xml/xml_whatis.asp
W3Schools. (n.d.). JSON – Introduction. Refsnes Data. https://www.w3schools.com/js/js_json_intro.asp
Yuan, S. (2019, May 22). The Anatomy of NetDevOps. Cisco Blogs. https://blogs.cisco.com/developer/anatomy-of-netdevops
Eric Ahlm, Augusto Barros, Michael Clark. SOAR: Assessing Readiness Through Use-Case Analysis. https://www.gartner.com/en/documents/3981938/soar-assessing-readiness-through-use-case-analysis