3. Business Practices
There are a host of business-facing practices that development must follow in order to succeed. These include Planning, Small Releases, Acceptance Tests, and Whole Team.
Planning
How do you estimate a project? The simple answer is that you break it down into its constituent pieces and then estimate those pieces. This is a fine approach; but what if the pieces themselves are too big to estimate with any accuracy? You simply break down those pieces into smaller pieces and estimate them. I’m sure you can all smell the recursive descent.
How far down can you carry this procedure? You can carry it right down to individual lines of code. In fact, this is what programmers do. A programmer is someone who is skilled at breaking down a task into individual lines of code.
If you would like an accurate and precise estimate of a project, then break it down into individual lines of code. The time it takes you to do this will give you a very accurate and precise measure of how long it took you to build the project—because you just built it.
Of course, that misses the point of an estimate. An estimate is a guess; we want some idea of how long the project will take without actually building the project. We want the cost of estimation to be low. Therefore an estimate is, by definition, imprecise. The imprecision allows us to shorten the time necessary to create the estimate. The more imprecision, the less time the estimate will take.
This is not to say that an estimate should be inaccurate. Estimates should be as accurate as possible, but only as precise as necessary to keep the cost of estimation low. An example may help. I estimate the moment of my death to be sometime within the next thousand years. This is completely accurate, but very imprecise. It took me virtually no time at all to create this accurate estimate because the imprecision was so large. The imprecision of an accurate estimate denotes a range of time within which the estimated event will almost certainly occur.
The trick, for software developers, is to spend a small amount of time choosing the smallest range that remains accurate.
Trivariate Analysis
One technique that works quite well for large tasks is trivariate estimation. Such estimates are composed of three numbers: best-case, nominal-case, and worst-case. These numbers are confidence estimates. The worst-case number is the amount of time within which you feel 95% confident that the task will be completed. The nominal-case has only 50% confidence, and the best-case only 5%.
For example, I am 95% sure that the task will be completed within three weeks. I am only 50% sure that it will be completed in two weeks. And I am only 5% sure that it will be completed within one week.
Another way to think about this is that, given 100 similar tasks, five of them will be done within one week, 50 will be done within two weeks, and 95 of them will be done within three weeks.
There is a whole mathematical method surrounding the management of trivariate estimates. If you are interested, I encourage you to research the program evaluation and review technique (PERT).1 It is a powerful method for managing large projects and portfolios of projects. And if you haven’t studied this technique, don’t assume that you know it already. There’s a lot more to PERT than those Microsoft Project diagrams with which you may be familiar.
1. https://en.wikipedia.org/wiki/Program_evaluation_and_review_technique
As powerful as trivariate analysis is for long-term estimation of a whole project, this technique is too imprecise for the day-to-day management that we need within a project. For that, we use another approach: story points.
Stories and Points
The story point technique deals with accuracy and precision by using a very tight feedback loop that iteratively calibrates and recalibrates estimates against reality. Imprecision is high at first, but within a few cycles it is reduced to manageable levels. But before we get into that, we need to talk a bit about stories.
A user story is an abbreviated description of a feature of the system, told from the point of view of a user. So, for example:
As the driver of a car, in order to increase my velocity, I will press my foot harder on the accelerator pedal.
This is one of the more common forms of a user story. Some people like it. Others prefer the more abbreviated form: Accelerate. Both work pretty well. Both are simply placeholders for a much larger conversation.
Much of that conversation has not happened yet. It will happen when the developers are on the verge of developing the feature. The conversation was begun, however, at the moment that the story was written. At that time, the developers and stakeholders talked over some of the possible details of the story and then chose a simple wording to write down.
The wording is simple, and the details are omitted because it is too early to count on those details. We want to delay the specification of those details as long as possible, right up to the point where the story is developed. So we leave the story in abbreviated form as a promise for a future conversation.2
2. This is one of Ron Jeffries’ definitions of a story.
Typically, we write the story on an index card. I know, I know. Why in the world would we use such ancient and primitive tools when we have computers and iPads and…? It turns out that being able to hold those cards in your hands, pass them across a table to each other, scribble on them, and otherwise handle them is immensely valuable.
Automated tools do sometimes have their place, and I’ll talk about them in another chapter. For the moment, however, think of the stories as index cards.
Please remember: World War II was managed3 on index cards, so I think the technique scales.
3. Well, to some extent anyway.
ATM Stories
Imagine that it is Iteration Zero, and we are on a team writing the stories for an automated teller machine (ATM). What are these stories? The first few are pretty easy to figure out: Withdrawal, Deposit, and Transfer. Of course, you also have to identify yourself to the ATM. We might call that Login. And that implies that there is a way to Logout.
Now we have five cards. There will almost certainly be more once we start really getting into the behavior of the machine. We could imagine auditing tasks, loan payment tasks, and all kinds of other things. But let’s stick with those first five for now.
What’s on those cards? Just the words mentioned: Login, Logout, Withdrawal, Deposit, and Transfer. Of course, those aren’t the only words that were spoken during our exploration. We talked about many details during that meeting. We mentioned how the user logs in by inserting her card in a slot and entering a PIN. We discussed a deposit consisting of an envelope that is inserted into a slot and on which we print identifying marks. We talked about how cash is dispensed, and what to do if the cash jams or if we run out. We worked through many of those details.
But we don’t trust those details yet, so we don’t write them down. What we write down are just the words. There’s nothing wrong with making a few notes on the card if you want some reminders of the issues, but these aren’t requirements. There’s nothing formal on the cards.
This rejection of detail is a discipline. And it’s hard. Everyone on the team will feel the need to capture all the details discussed in one way or another. Resist this urge!
I once worked with a project manager who absolutely insisted on writing down every detail about each and every story on the story card. The story cards were filled with paragraphs and paragraphs in tiny little print. They became impenetrable and unusable. They had so much detail on them they could not be estimated. They could not be scheduled. They were useless. Worse, there was so much effort invested into each story card that they could not be discarded.
What makes a story manageable, schedulable, and estimable is the temporary lack of detail. Stories must start out cheap because a lot of them are going to be modified, split, merged, or even discarded. Just keep reminding yourself that they are placeholders, not requirements.
Now we have a batch of story cards created in Iteration Zero. Others will be created later as new features and new ideas are encountered. In fact, the process of story creation never ends. Stories are always being written, changed, discarded, and (most importantly) developed over the course of the project.
Estimating the Stories
Imagine that these cards are on the table in front of you, and sitting around the table are other developers, testers, and stakeholders. You have all met in order to estimate these cards. There will be many meetings like this. They will be convened any time new stories are added or something new has been learned about old stories. Expect such meetings to be an informal but regular event in each iteration.
However, it’s still early in Iteration Zero, and this estimation meeting is the first. None of the stories has yet been estimated.
So, we pick a story from the batch that we consider to be of average complexity. Perhaps it is the Login story. Many of us were there when the story was written, so we heard the kinds of details that the stakeholders imagined would be part of this story. We will likely ask the stakeholders to review those details now, just so that we all have the proper context.
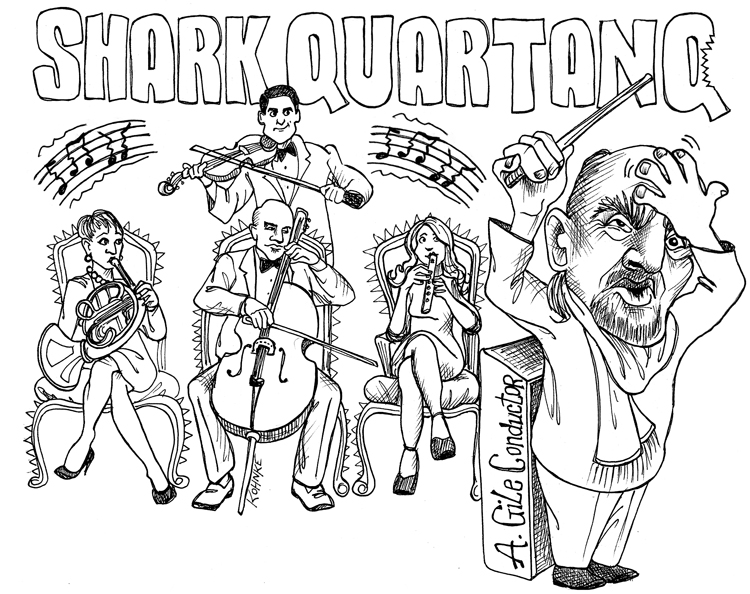
Then, we choose a number of points for the story. The Login story will cost 3 points of development effort (Figure 3.1). Why 3? Why not? Login is an average story, and so we give it an average cost. Three is average if our stories range in cost from 1 to 6.
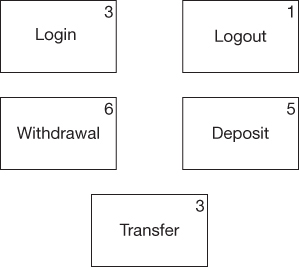
Figure 3.1 The Login story gets assigned three points
Login is now our Golden Story. It is the standard against which all other stories will be compared. So, for example, logging out is a lot simpler than logging in. We’ll give the Logout story 1 point. Withdrawal is perhaps twice as hard as Login, so we’ll say it’s a 6. Deposit is similar to Withdrawal but perhaps not quite as hard, so we’ll give it a 5. Finally, Transfer is about the same as Login, so we’ll give it a 3.
We write these numbers up in one corner of each story card that we estimate. I’ll talk much more about the estimation process later. For now, let’s just say that we now have a batch of story cards with estimates on them that range from 1 to 6. Why 1 to 6? Why not? There are many schemes for assigning cost. The simpler ones are usually better.
At this point, you may be wondering what these points are really measuring. Perhaps you think they are hours, days, weeks, or some other unit of time. They are not. Rather, they are a unit of estimated effort, not real time. They are not even estimated time—they are estimated effort.
Story points should be roughly linear. A card with a 2 should require about half the effort of a card with a 4. However, the linearity doesn’t have to be perfect. Remember, these are estimates, so precision is kept intentionally wide. A story with a 3 might take Jim two days to implement if he doesn’t get distracted by a bug in the field. Or it might take Pat only one day if she works at home on it. These numbers are vague, fuzzy, imprecise things that do not relate directly to real time.
But there is a beautiful thing about vague and fuzzy numbers. It’s called the Law of Large Numbers.4 When taken in quantity, the fuzziness integrates out! We’re going to take advantage of that later.
Planning Iteration One
Meanwhile, it’s time to plan the first iteration. The iteration begins with the Iteration Planning Meeting (IPM). This meeting should be scheduled to be one-twentieth the duration of the iteration. The IPM for a two-week iteration should require about a half a day.
The whole team attends the IPM. This includes the stakeholders, the programmers, the testers, and the project manager. The stakeholders will have previously read the estimated stories and sorted them in the order of business value. Some teams actually choose numbers for that business value, similar to the technique used for the story points. Other teams just eyeball the business value.
The job of the stakeholders at the IPM is to choose the stories that will be implemented by the programmers and testers during the iteration. To do this, they need to know how many story points the programmers think they can complete. This number is called the velocity. Of course, since this is the first iteration, no one has any real idea what the velocity is going to be. So the team makes a guess. Let’s say that guess is 30.
It’s important to realize that velocity is not a commitment. The team is not making a promise to get 30 points done during the iteration. They aren’t even making the promise to try to get 30 points done. This is nothing more than their best guess as to how many points will be complete by the end of the iteration. That guess is probably not very accurate.
Return on Investment
Now the stakeholders play the four-quadrant game (Figure 3.2).
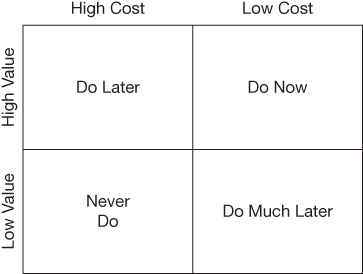
Figure 3.2 The four-quadrant game
The stories that are valuable but cheap will be done right away. Those that are valuable but expensive will be done later. Those that are neither valuable nor expensive might get done one day. Those that are not valuable but are expensive will never be done.
This is a return on investment (ROI) calculation. It’s not made formally, and no math is necessary. The stakeholders simply look at the card and make a judgement based on its value and its estimated cost.
So, for example: “Login is pretty important; but it’s also pretty expensive. Let’s wait. Logout is important too, and it’s quite cheap. Do it! Withdrawal is expensive—really expensive. But it’s also important to show that feature off first. So do it.”
That’s how the process works. The stakeholders scan the deck of stories for those that have the highest bang for buck, the highest ROI. When they find enough to add up to 30 points, they stop. That’s the plan for the iteration.
The Midpoint Check
Let’s get to work. I’ll explain the process involved in developing the stories in detail later. For now, just imagine that there is some procedure for turning stories into working code. Think of it as moving story cards from the planned pile to the done pile.
At the midpoint of the iteration, many stories should be done. What should the point total of those stories add up to? That’s right, 15. To do this process, you must be able to divide by two.
So, let’s call the midpoint review meeting. It’s Monday morning, the first day of the second week of the iteration. The team gathers with the stakeholders, and they look at the progress.
Uh oh, the completed stories only add up to 10 points. With only a week left, it’s not likely that they are going to get 20 more points done. So the stakeholders remove enough stories from the plan to reduce the remaining points to 10.
By Friday afternoon, the iteration concludes with a demo. It turns out only 18 points were completed. Has this iteration failed?
No! Iterations do not fail. The purpose of an iteration is to generate data for managers. It would be nice if the iteration also generated working code, but even when it doesn’t it has still generated data.
Yesterday’s Weather
Now we know how many points we can do in a week: about 18. On Monday, when the next iteration begins, how many points should the stakeholders plan for? Eighteen, of course. This is called yesterday’s weather. The best predictor of today’s weather is yesterday’s weather. The best predictor of the progress of an iteration is the previous iteration.
So at the IPM, the stakeholders select stories that add up to 18 points. But this time, at the midpoint review, something strange has happened. There are 12 points done. Should we tell them?
We don’t have to. They can see it for themselves. So the stakeholders add six more points to the plan, for a planned total of 24.
Of course, the team really only completes 22. So 22 will be chosen for the next iteration.
The End of the Project
And on it goes like this. As each iteration completes. the completed velocity is added to the velocity chart, so that everyone can see how fast the team is going.
Now imagine that this process continues, iteration after iteration, month after month. What is happening to that deck of story cards? Think of the iteration cycle as a pump that pumps the ROI out of that deck. Think of the continuous exploration of the requirements as a pump that pumps ROI back into the deck. As long as incoming ROI outpaces the outgoing ROI, the project will continue.
However, it may happen that the number of new features discovered in exploration gradually sinks to zero. When that happens, the remaining ROI in the deck will be exhausted after just a few more iterations. The day will come when, at the IPM, the stakeholders scan the deck for something worth doing and find nothing. The project is over.
The project is not over when all the stories are implemented. The project is over when there are no more stories in the deck worth implementing.
It is sometimes amazing what is left in the deck after the project is over. I once worked on a year-long project where the very first story written, the story that gave the project its name, was never chosen for implementation. That story was important at the time, but there were many more urgent stories to implement. By the time all those urgent stories were resolved, the importance of the original story had evaporated.
Stories
User stories are simple statements that we use as reminders of features. We try not to record too much detail when we write the story because we know that those details will likely change. The details are recorded later, but as acceptance tests, which we’ll discuss later.
Stories follow a simple set of guidelines that we remember with the acronym INVEST.
I: Independent. User stories are independent of each other. This means that they do not need to be implemented in any particular order. Login does not need to be implemented before Logout.
This is a soft requirement because there may well be stories that depend on other stories being implemented first. For example, if we define Login without any forgotten password recovery, then clearly Password Recovery depends, to some extent, upon Login. Still, we try to separate the stories so that there is as little dependence as possible. This allows us to implement the stories in the order of business value.
N: Negotiable. This is another reason why we don’t write down all the details. We want those details to be negotiable between the developers and the business.
For example, the business might ask for a fancy drag-and-drop interface to some feature. The developers could recommend a simpler checkbox style by saying that it would be much less expensive to develop. Negotiations like that are important because it is one of the few ways that the business gains insight into ways of managing the cost of developing software.
V: Valuable. The story must have clear and quantifiable value to the business.
Refactoring is never a story. Architecture is never a story. Code cleanup is never a story. A story is always something that the business values. Don’t worry, we will deal with refactoring, architecture, and cleanup—but not with stories.
This usually means that a story will cut through all the layers of a system. It may involve a little GUI, a little middleware, some database work, etc. Think of a story as a thin vertical slice through the horizontal layers of the system.
Quantifying the business value can be informal. Some teams might simply use high/medium/low as their business value scale; others might try to use a ten-point scale. It doesn’t matter what scale you use as long as you can differentiate between stories that differ significantly in value.
E: Estimable. A user story must be concrete enough to allow the developers to estimate it.
A story such as The System Must Be Fast is not estimable because it is not closed; it’s a background requirement that all stories must implement.
S: Small. A user story should not be larger than one or two developers can implement in a single iteration.
We don’t want a single story to dominate the whole team for an entire iteration. An iteration should contain about the same number of stories as there are developers on the team. If the team has 8 developers, then each iteration should contain about 6 to 12 stories. You don’t want to get too hung up on this point, however; it’s more a guideline than a rule.
T: Testable. The business should be able to articulate tests that will prove that the story has been completed.
Typically, those tests will be written by QA, will be automated, and will be used to determine whether a story is complete. We’ll have much more to say about this later. For now, just remember that a story has to be concrete enough to specify with tests.
This may seem to contradict N above. It doesn’t, because we don’t have to know the test at the time we write the story. All we need to know is that a test can be written at the appropriate time. So for example, even though I don’t know all the details of the Login story, I know that it is testable because Login is a concrete operation. On the other hand, a story like Usable is not testable. It’s also not estimable. Indeed, the E and T go together pretty closely.
Story Estimation
There are a number of schemes for estimating stories. Most of them are variations on the old Wideband Delphi5 approach.
5. https://en.wikipedia.org/wiki/Wideband_delphi
One of the simplest is called Flying Fingers. Developers sit around a table, read a story, and discuss it with stakeholders if necessary. Then the developers put one hand behind their back, out of sight, and hold up the number of fingers that corresponds to the number of points they think the story deserves. Then someone counts one…two…three… and then all the fingers come flying out at once.
If everyone is holding the same number of fingers, or if the deviation is small and has an obvious mean, then that number is written on the story card, and the team moves on to the next story. If, however, there is substantial disagreement between the fingers, then the developers discuss the reasons why, and then repeat the process until agreement is reached.
A reasonable range for stories is Shirt Sizes: small, medium, and large. If you want to use all five fingers, go ahead. On the other hand, more than a handful of rankings is almost certainly absurd. Remember, we want to be accurate, but no more precise than necessary.
Planning Poker6 is a similar technique, but it involves cards. There are many popular Planning Poker card decks out there. Most use some kind of Fibonacci series. One popular deck contains the cards: ?, 0, ½, 1, 2, 3, 5, 8, 13, 20, 40, 100, and ∞. If you use such a deck, my advice to you would be to remove most of those cards.
6. Grenning, J. W. 2002. Planning Poker or how to avoid analysis paralysis while release planning. Accessed at https://wingman-sw.com/articles/planning-poker.
A benefit of the Fibonacci series is that it allows the team to estimate larger stories. For example, you could choose 1, 2, 3, 5, and 8, which gives you an 8X range in size.
You may also wish to include 0, ∞, and ?. In Flying Fingers, you can use thumbs down, thumbs up, and an open hand for these symbols. Zero means, “Too trivial to estimate.” Be careful with those! You may wish to merge a few of them into a bigger story. Infinity (∞) represents too big to estimate, and therefore the story should be split. And (?) means you simply don’t know, meaning that you’ll need a spike.
Splitting, Merging, and Spiking
Merging stories is simple. You can clip the cards together and treat the merged stories as one. Just add up all the points. If any have zero points, use your best judgment in summing them. After all, fives zeros probably does not add up to zero.
Splitting stories is a bit more interesting because you need to maintain INVEST. As a simple example of splitting a story, consider Login. If we wanted to split it into smaller stories, we could create Login with No Password, Login with Single Password Attempt, Allow Multiple Password Attempts, and Forgot Password.
It is rare to find a story that cannot be split. This is especially true of those that are big enough to need splitting. Remember, it is the job of a programmer to split stories all the way down into individual lines of code. So splitting is almost always possible. The challenge is maintaining INVEST.
A spike is a meta-story, or rather, a story for estimating a story. It is called a spike because it often requires us to develop a long but very thin slice through all the layers of the system.
Let’s say there’s a story that you cannot estimate. Let’s call it Print PDF. Why don’t you know how to estimate it? Because you’ve never used the PDF library before and you aren’t sure how it works. So you write a new story called Estimate Print PDF. Now you estimate that story, which is easier to estimate.
After all, you know what you’ll have to do to figure out how the PDF library works. Both stories go in the deck.
In a future IPM, the stakeholders may decide to play the Print PDF card, but they can’t because of the spike. They have to play the spike card instead. That will allow the developers to do the work necessary to estimate the original story, which can be implemented in a future iteration.
Managing the Iteration
The goal of each iteration is to produce data by getting stories done. The team should focus on stories rather than tasks within stories. It is far better to get 80% of the stories done than it is to get each story 80% done. Focus on driving the stories to completion.
As soon as the planning meeting ends, the programmers should choose the stories for which they will each individually be responsible. Some teams choose the first stories and leave the rest in a pile to be chosen later as stories are completed. Either way, stories are chosen by, and belong to, individual programmers.
Managers and leads will be tempted to assign stories to programmers. This should be avoided. It is far better to let the programmers negotiate amongst themselves.
For example:
Jerry (Journeyman): If nobody minds, I’ll take Login and Logout. It makes sense to do them together.
Jasmine (Journeyman): I don’t have a problem with that, but why don’t you pair with Alphonse on the database part. He’s been asking about our event-sourcing style, and Login would be a gentle introduction. Alphonse?
Alphonse (Apprentice): That sounds great to me. Once I’ve seen that I should be able to work on Withdraw.
Alexis (Lead programmer): Why don’t I take Withdraw, Alphonse. You can pair with me on that, too. Then you can take Transfer.
Alphonse: Aw, OK. That probably makes more sense. Small steps, right?
Jasmine: Right, Al. And that leaves Deposit. I’ll take that one. Alexis, you and I should put our heads together on the UIs because they’re likely similar. We might be able to share some code.
In this example, you can see how the lead programmer guides the new, ambitious apprentice away from biting off more than he can chew, and how the team generally collaborates on choosing the stories.
QA and Acceptance Tests
If QA has not already begun to write the automated acceptance tests, they should start as soon as the IPM ends. The tests for stories that are scheduled for early completion should be done early. We don’t want completed stories waiting for acceptance tests to be written.
Acceptance test writing should go quickly. We expect them to all be written before the midpoint of the iteration. If not all the acceptance tests are ready by the midpoint, then some of the developers should stop working on stories and start working on acceptance tests.
This will likely mean that not all the stories will be completed in this iteration, but a story cannot be completed without the acceptance tests anyway. Just be sure that the programmers working on a story are not also writing the acceptance tests for that story. If QA continues to miss the midpoint deadline, one iteration after another, then the ratio of QA engineers to developers is likely wrong.
After the midpoint, if all the acceptance tests are done, QA should be working on the tests for the next iteration. This is a bit speculative since the IPM hasn’t happened yet, but the stakeholders can offer guidance about the stories most likely to be chosen.
Developers and QA should be communicating intensely about these tests. We don’t want QA to simply “throw the tests over the wall” to the developers. Rather, they should be negotiating how the tests are structured and collaborating on writing them, even to the point of pairing together on the writing of them.
As the midpoint of the iteration approaches, the team should be trying to get stories done for the midpoint review. As the end of the iteration approaches, developers should be trying to get the remaining stories to pass their respective acceptance tests.
The definition of “done” is this: acceptance tests pass.
On the last day of the iteration, tough choices may be required regarding which stories will be completed and which will have to be abandoned. We do this so that we can reallocate effort to get as many stories done as possible. Again, we don’t want to end the iteration with two half-done stories when we could have sacrificed one story in order to get the other one done.
This is not about going fast. This is about making concrete, measurable progress. This is about reliable data. When the acceptance tests for a story pass, that story is done. However, when a programmer says that a story is 90% done, we really don’t know how close to done it is. So, the only thing we ever want to report on our velocity chart is stories that have passed their acceptance tests.
The Demo
The iteration ends with a brief demonstration of the new stories to the stakeholders. This meeting need be no more than an hour or two long, depending on the iteration size. The demo should include showing that all the acceptance tests run—including all previous acceptance tests—and all unit tests. It should also show off the newly added features. It is best if the stakeholders themselves operate the system so that the developers aren’t tempted to hide things that don’t work.
Velocity
The last act of the iteration is to update the velocity and burn-down charts. Only the points for stories that have passed their acceptance tests are recorded on these charts. After several iterations, both of these charts will begin to show a slope. The burn-down slope predicts the date for the next major milestone. The velocity slope tells us how well the team is being managed.
The velocity slope will be pretty noisy, especially during early iterations, as the team is still figuring out the basics of the project. But after the first few iterations, the noise should reduce to a level that allows an average velocity to become apparent.
We expect that after the first few iterations, the slope will be zero—that is, horizontal. We don’t expect the team to be speeding up or slowing down over long periods.
Rising Velocity
If we see a positive slope, it likely does not mean that the team is actually going faster. Rather, it probably means that the project manager is putting pressure on the team to go faster. As that pressure builds, the team will unconsciously shift the value of their estimates to make it appear that they are going faster.
This is simple inflation. The points are a currency, and the team is devaluing them under external pressure. Come back to that team next year, and they’ll be getting millions of points done per iteration. The lesson here is that velocity is a measurement not an objective. It’s control theory 101: don’t put pressure on the thing you are measuring.
The purpose of estimating the iteration during the IPM is simply so that the stakeholders know how many stories might get done. This helps the stakeholders choose the stories and helps them to plan. But that estimate is not a promise, and the team has not failed if the actual velocity is lower.
Remember, the only failing iteration is an iteration that fails to produce data.
Falling Velocity
If the velocity chart shows a consistent negative slope, then the most likely cause is the quality of the code. The team is likely not refactoring enough and they are probably allowing the code to rot. One reason that teams fail to refactor enough is that they don’t write enough unit tests, so they fear that refactoring will break something that used to work. Managing this fear of change is a major goal of team management, and it all comes down to the testing discipline. We’ll have much more to say about that later.
As velocity falls, pressure on the team builds. This causes the points to inflate. That inflation can hide the falling velocity.
The Golden Story
One way to avoid inflation is to constantly compare story estimates back to the original Golden Story, the standard against which other stories will be measured. Remember that Login was our original Golden Story, and it was estimated as 3. If a new story such as Fix Spelling Error in Menu Item has an estimate of 10, you know that some inflationary force is at work.
Small Releases
The practice of Small Releases suggests that a development team should release their software as often as possible. Back in the late ’90s, in the early days of Agile, we thought that this meant a release every “month or two.” Nowadays, however, we’ve set the goal to be much, much, shorter. Indeed, we’ve made it infinitely shorter. The new goal, of course, is Continuous Delivery: the practice of releasing the code to production after every change.
This description could be misleading because the term Continuous Delivery makes it seem like the cycle that we want to shorten is only the delivery cycle. Actually, we want to shorten every cycle.
Unfortunately, there is a significant historical inertia to shortening cycles. That inertia has to do with the way we managed our source code back in the olden days.
A Brief History of Source Code Control
The story of source code control is the story of cycles and their sizes. It begins in the 1950s and ’60s when source code was kept in the holes punched in bits of paper (Figure 3.3).
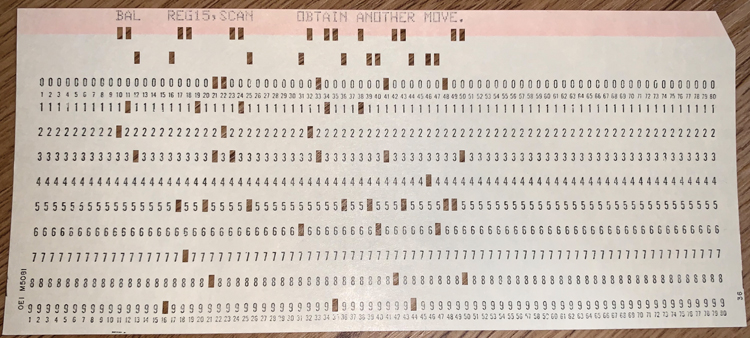
Figure 3.3 A punched card
Many of us used punched cards in those days. A card held 80 characters and represented one line of a program. The program itself was a deck of such cards, typically held together with a rubber band and kept in a box
(Figure 3.4).
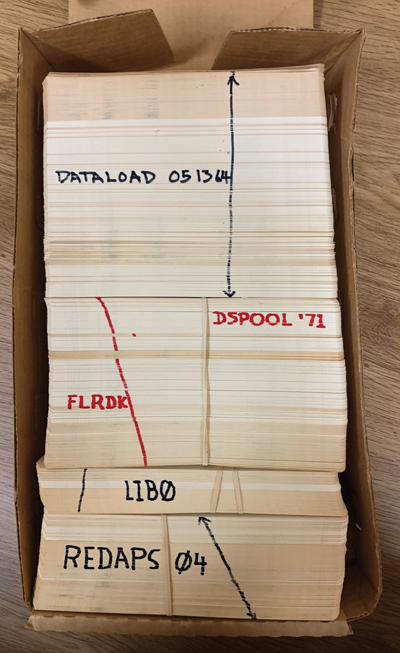
Figure 3.4 Punched card decks in a box
The owner of that program kept the deck in a drawer or a cabinet. If someone wanted to check out the source code, he literally checked out the source code from the drawer or cabinet, with the permission of the owner.
If you had the source code checked out, you were the only one who could change that source code because you had physical possession of it. Nobody else could touch it. When you were done, you gave the deck back to the owner, who put it back in the drawer or cabinet.
The cycle time for that program was the amount of time that a programmer kept possession of it. That time could be days, weeks, or months.
Tapes
In the 1970s, we gradually transitioned to keeping our source code in card images stored on magnetic tape. Magnetic tapes could hold a large number of source code modules, and they were easy to duplicate. The procedure for editing a module was as follows.
Get the master tape from the master rack.
Copy the modules you want to edit from the master tape to a work tape.
Put the master tape back so other people could access other modules.
Put a colored pin in the checkout board next to the name of the modules you want to edit. (I was blue, my boss was red, and the other programmer on my team was yellow. Yes, eventually we ran out of colors.)
Edit, compile, and test using the work tape.
Get the master tape again.
Copy the changed modules from the work tape to a new copy of the master tape.
Put the new master in the rack.
Remove your pin from the board.
Once again, the cycle time was the time your pin was present on the board. This could be hours, days, or even weeks. So long as your pins were in the checkout board, nobody else was supposed to touch the modules you had pinned.
Of course, those modules were still on the master tape, and in a pinch, someone else could violate the rules and edit the modules. So the pins were a convention, not a physical barrier.
Disks and SCCS
In the ’80s, we moved our source code to disk. At first, we continued to use the pins in the checkout board; then, some real source code control tools started to appear. The first I remember was Source Code Control System (SCCS). SCCS behaved just like the checkout board. You locked a module on disk, preventing anyone else from editing it. This kind of lock is called a pessimistic lock. Again, the cycle time was the length of the lock. It could be hours, days, or months.
SCCS gave way to Revision Control System (RCS), which gave way to Concurrent Versions System (CVS), all of which used one form or another of pessimistic lock. So the cycle time remained long. However, disks are a much more convenient medium of storage than tapes. The process of copying modules from master to work tapes tempted us to keep those modules large. Disks, on the other hand, allowed us to shrink the size of our modules drastically. There simply was no penalty for having many small modules as opposed to a few large ones. This effectively shortened the cycle time simply because the amount of time you would keep a small module checked out was relatively small.
The problem was that changes to a system usually required changes to many modules. To the extent that the system was deeply coupled, the effective checkout time was still long. Some of us learned to decouple our modules to shorten that checkout time. Most, however, did not.
Subversion
Then came Subversion (SVN). This tool offered optimistic locks. An optimistic lock is not really a lock at all. One developer could check out a module at the same time that another had it checked out. The tool kept track of this and automatically merged changes into the modules. If the tool detected a conflict (i.e., the two developers changed the same lines of code) it forced the programmer to resolve the conflict before allowing the checkin.
This drastically shortened the cycle time to the time required to edit, compile, and test a series of small changes. Coupling was still an issue. A tightly coupled system maintained long cycle times because many modules had to be changed in unison. But a loosely coupled system could be cycled much more quickly. Checkout time was no longer the limiting factor.
Git and Tests
Nowadays we use Git. Checkout time using Git has shrunk to zero. The concept doesn’t exist. Rather, any alteration to a module can be committed at any time. Conflicts among these commits are resolved as and when the programmers desire. Tiny decoupled modules and rapid commit frequency result in cycle times that can be as small as minutes. Add to this the ability to create a comprehensive, fast-running test suite that tests almost everything, and you have the makings of Continuous Delivery.
Historical Inertia
Unfortunately, it is difficult for organizations to shake off the behaviors of the past. The cycle time of days, weeks, and months is deeply ingrained in the culture of many teams and has spread to QA, to management, and to the expectations of the stakeholders. From the vantage of such a culture, the notion of Continuous Delivery can seem ludicrous.
Small Releases
Agile attempts to break that historical inertia by driving the team to shorter and shorter release cycles. If you are releasing every six months, try every three months, then try every month, then try every week. Keep shortening the release cycle in an asymptotic approach to zero.
To do this, the organization will need to break the coupling between release and deployment. The term “release” means that the software is technically ready to be deployed. The decision to deploy becomes solely a business decision.
You may have noticed that this is the same language we used to describe iterations. Iterations are technically deployable. If our iterations are two weeks long, but we want to release more often than that, we’ll have to shorten our iterations.
Can iterations be shortened asymptotically toward zero? Yes, they can. But that’s a topic for another section.
Acceptance Tests
The practice of Acceptance Tests is one of the least understood, least used, and most confused of all the Agile practices. This is strange because the underlying idea is remarkably simple: Requirements should be specified by the business.
The problem, of course, is the meaning of the word: specify. Many businesses would like that word to mean that they can wave their hands around in the air and describe the desired behavior in vague and fluffy terms. They want the developers to figure out all the little details. Many programmers would like the business to define precisely what the system should do, right down to the coordinates and values of each individual pixel.
Something in the middle of these two extremes is necessary.
So what is a specification? A specification is, by its very nature, a test. For example:
When the user enters a valid username and password, and then clicks “login,” the system will present the “Welcome” page.
This is obviously a specification. It is also obviously a test.
It should also be obvious that this test could be automated. There is no reason that a computer could not verify that the specification has been met.
This is the practice of Acceptance Tests. The practice says that, to the degree practicable, the requirements of the system should be written as automated tests.
But wait! Who writes these automated tests? The first paragraph in this section answers that question: Requirements should be specified by the business. So the business should write the automated tests. Right?
But wait! Automated tests have to be written in some kind of formal executable language. That sounds like a job for programmers. So programmers should write the automated tests, right?
But wait! If programmers write the tests, they won’t be written from the business’ point of view. They’ll be technical tests full of details that only programmers understand. They won’t reflect the item’s business value. So the business should write the automated tests. Right?
But wait! If the business writes the automated tests then they’ll be written in a way that doesn’t match the technology we’re using. The programmers will just have to rewrite them, right?
You can see why this practice has been so confusing for so many people.
Tools and Methodologies
It’s worse than that because the practice has been inundated with tools and methodologies.
In an attempt to make it easier for business people to write automated tests, programmers have written a plethora of tools to “help.” These tools include things like FitNesse, JBehave, SpecFlow, and Cucumber. Each of these tools creates a formalism that attempts to separate the technical and business sides of an automated test. The working hypothesis is that the business can write the business side of the automated tests, and the programmers can write the glue code that binds those tests to the system being tested.
This seems like a good idea, and the tools do a decent job of this separation. Yet businesses have been reluctant to engage. The businesspeople who are responsible for specification are wary of formal languages. They typically want to use a human language, like English, to write their specifications.
In response to this reluctance, programmers have stepped in and written the acceptance tests for the businesspeople, in the hopes that the businesspeople will at least read the formal documents. But this hasn’t worked out all that well either, because the businesspeople don’t like the formal languages. They’d rather either see the system actually work, or better yet, delegate the job of verification to QA.
Behavior-Driven Development
After the turn of the millennium, Dan North began working on a redefinition of TDD that he called Behavior-Driven Development (BDD). His goal was to remove the techie jargon from the tests and make the tests appear more like specifications that businesspeople would appreciate.
At first, this was just another attempt at formalizing the language of testing, in this case using three special adverbs: Given, When, and Then. Several tools were created or modified to support this language. Among them are JBehave, Cucumber, and FitNesse. But over time, the emphasis changed from tools and tests to requirements and specification.
The proponents of BDD suggest that businesses can derive great value by specifying their systems in a formal scenario-based language like Given-When-Then, regardless of whether they actually automate those requirements as tests.
This relieves the businesspeople from conforming to the technical requirements involved with writing truly executable tests, while at the same time allowing them to be formal and precise.
The Practice
Despite all the controversy and confusion described above, the practice of Acceptance Testing is actually quite simple. The business writes formal tests describing the behavior of each user story, and developers automate those tests.
The tests are written by business analysts and QA before the first half of the iteration in which the stories they test are to be developed. The developers integrate those tests into the continuous build. Those tests become the Definition of Done for the stories in the iteration. A story is not specified until its acceptance test is written. A story is not complete until its acceptance test passes.
Business Analysts and QA
Acceptance tests are a collaborative effort between business analysts, QA, and the developers. Business analysts specify the happy paths. That’s because they have enough to do in their role of communicating between the programmers and the stakeholders.
QA’s role is to write the unhappy paths. There are a lot more of them than there are of the former. QA folks are hired for their ability to figure out how to break the system. They are deeply technical people who can foresee all the strange and bizarre things that users are going to do to the system. They also know the minds of programmers and understand how to probe all their lazy streaks.
And, of course, the developers work with QA and business analysts to ensure that the tests make sense from a technical point of view.
QA
This, of course, completely changes the role of QA. Rather than acting as testers on the back end of the project, they become specifiers operating at the front end of the project. Instead of supplying late feedback about errors and omissions, they are providing early input to the development team to prevent those errors and omissions.
This puts a much greater burden upon QA. QA must now ensure quality by injecting it into the start of each iteration, rather than measuring lack of compliance at the end. However, the responsibility of QA is not diminished in any way; they determine whether the system is deployable.
Losing the Tests at the End
Moving QA to the beginning and automating the tests solves another huge problem. When QA operates manually at the end, they are the bottleneck. They must finish their work before the system can be deployed. Impatient managers and stakeholders lean on QA to finish up so that the system can be deployed.
When QA comes at the end, all upstream delays fall on QA. If the developers are late delivering to QA, does the delivery date change? Often the delivery date was chosen for very good business reasons, and delaying it would be costly, or even catastrophic. QA is left holding the bag.
How should QA test the system when they have no time left in the schedule to test it? How can QA go faster? That’s easy: don’t test everything. Just test the things that changed. Do an impact analysis based on new and changed features, and only test the impacted things. Don’t waste time testing things that haven’t changed.
So you lose the tests. Under pressure, QA simply bypasses all the regression tests. They hope that they can run them next time. Often, “next time” never comes.
The QA Disease
However, that’s not the worst problem that happens because QA is at the end of the process. When QA is at the end, how does the organization know they are doing their jobs well? By their defect count, of course. If QA is finding lots of defects, they are clearly doing their job well. QA managers can tout the number of defects found as clear evidence that they are performing their function.
Thus, defects are considered a good thing.
Who else can benefit from defects? There’s a saying among older programmers: “I can meet any deadline you set for me, as long as the software doesn’t have to work properly.” So who else benefits from defects? Developers who need to meet schedule deadlines.
No word needs to be spoken. No agreement needs to be written. But both sides understand that they benefit from defects. A black market economy of defects emerges. This disease permeates many organizations, and if it’s not terminal, it’s certainly debilitating.
Developers Are the Testers
These problems are all cured by the practice of Acceptance Tests. QA writes the acceptance tests for the stories in an iteration. But QA does not run those tests. It’s not QA’s job to verify that the system passes the tests. Whose job is it? The programmers’, of course!
It is the programmers’ job to run the tests. It is the programmers’ job to make sure that their code passes all the tests. So of course, the programmers must run those tests. Running those tests is the only way for programmers to determine whether their stories are done.
Continuous Build
Indeed, the programmers will automate that process7 by setting up a Continuous Build server. This server will simply run all the tests in the system, including all unit tests and all acceptance tests, every time any programmer checks in a module. We’ll have more to say about that when we talk about Continuous Integration.
7. Because automating things is what programmers do!
Whole Team
The practice of Whole Team was initially called On-Site Customer. The idea was that the shorter the distance between the users and the programmers, the better the communication, and the faster and more accurate the development. The customer was a metaphor for someone, or some group, who understood the needs of the users, and who was co-located with the development team. Ideally, the customer sat in the same room with the team.
In Scrum, the customer is called the Product Owner. This is the person (or group) who chooses stories, sets priorities, and provides immediate feedback.
The practice was renamed Whole Team in order to make it clear that a development team was not simply a customer/programmer dyad. Instead, a development team is composed of many roles including managers, testers, technical writers, etc. The goal of the practice is to minimize the physical distance between these roles. Ideally, all members of the team sit together in the same room.
There can be little doubt that putting the entire team into a single room maximizes the efficiency of that team. The individuals can communicate rapidly and with a minimum of formality. Questions can be asked and answered within seconds. The experts who know the answers are always near.
Moreover, there is a huge opportunity for serendipity. An on-site customer may look over and see something on a programmer’s or tester’s screen that doesn’t look right. A tester may overhear a programming pair talking about a requirement and realize that they’ve come to the wrong conclusion. This kind of accidental synergy should not be undervalued. When the Whole Team sits together in the same space, magic can happen.
Notice that this practice is counted as a business practice, and not a team practice. That’s because the primary advantages of the Whole Team practice accrue to the business.
When teams are co-located, the business runs much more smoothly.
Co-Location
In the early 2000s, I helped several organizations adopt Agile methods. In our preliminary visits, before the active coaching began, we asked our customers to set up team rooms and co-locate the teams. More than once, the customer reported that the efficiency of the teams increased dramatically simply because of the co-location.
Co-Location Alternatives
In the 1990s, the internet made it feasible to take advantage of vast pools of programming labor in countries where the cost of that labor was very low. The temptation to use this labor was overwhelming. Accountants did the math, and their eyes sparkled with the savings they believed they could achieve.
This dream didn’t work out quite as well as everyone hoped. It turns out that the ability to send megabits of source code around the world is not quite the same as having a team of co-located customers and programmers. The distances in terms of miles, time zones, language, and culture were still huge. Miscommunication was rampant. Quality was severely limited. Rework soared.8
8. These are my own impressions based upon talking with folks who experienced the issues directly. I have no actual data to present. Caveat emptor.
In the years since, the technology has improved somewhat. Data throughput rates now allow regular video chat and screen-sharing sessions. Two developers located on opposite sides of the world can now pair on the same code almost as though they were sitting next to each other—almost. Of course, these advances don’t solve the time-zone, language, and culture issues; but electronic face-to-face coding is certainly preferable to emailing source code back and forth.
Can an Agile team work this way? I’ve heard that it is possible. I’ve never seen it done successfully. Perhaps you have.
Working Remotely from Home
The improvement in internet bandwidth has also made it much easier for people to work from home. In this case, the language, time zone, and culture aren’t significant issues. What’s more, there is no trans-ocean communications lag. Team meetings can occur almost as if co-located and in sync with everyone’s circadian rhythms.
Don’t get me wrong. When team members work from home, there is still a significant loss of nonverbal communication. Serendipitous conversations are much rarer. No matter how electronically connected the team is, they are still not together in the same space. This puts the people working from home at a distinct disadvantage. There are always conversations and impromptu meetings that they miss. Despite the vast data bandwidth they may enjoy, they are still communicating through a peephole compared to those who are co-located.
A team that is mostly co-located but has a member or two who work from home one or two days per week will likely not notice any significant impediment, especially if they have invested in some good, high-bandwidth remote-communication tools.
On the other hand, a team composed of people who work almost entirely from home will never work as well as a team that is co-located.
Don’t get me wrong. In the early ’90s, my partner Jim Newkirk and I successfully managed a team that had no co-location at all. Everyone worked entirely from home. We met in person twice per year at most, and some of us lived in different time zones. On the other hand, we all spoke the same language, shared the same culture, and our time zones were never more than two hours apart. We made it work. We made it work very well. But it would have worked even better if we’d been together in the same room.
Conclusion
At the Snowbird meeting in 2000, Kent Beck said that one of our goals was to heal the divide between business and development. The business-facing practices play a big role in satisfying that goal. By following these practices, business and development have a simple and unambiguous way to communicate. That communication breeds trust.