

CHAPTER 2
Sound Characteristics
Before placing any microphones, stands, cables, amplifiers, or instruments, a complete grasp of sound characteristics is paramount. You can't record signal properly until you understand the basics of what is physically happening.
The Characteristics of Sound
• What is sound? Sound, as we know it, is acoustic energy traveling through the atmosphere, dissipating in the form of changes in air pressure. Air molecules compress and refract, creating sound waves.
The ear, working much like a microphone, picks up these sound pressure waves, changes them to small electrical impulses, and sends this information to the brain, where we perceive it as recognizable sounds – except when my Uncle Sasha sings karaoke.
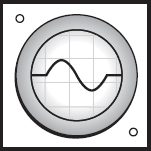
• What are sound waves? Sound waves are a series of waveforms combining wavelength (frequency) and amplitude (pressure.) Figure 2.1, (a) shows a speaker at rest, creating no changes in air pressure. Sending a sine wave or single frequency to the speaker introduces changes in air pressure using compression (b) and refraction (c). The cycle repeats itself (d), creating sound waves. Sound waves ripple through the atmosphere at a constant speed; about 1125 feet per second.
• What is frequency? Frequency is the number of sound waves per second, or cycles, referred to as hertz, or simply Hz. The lowest note on a standard piano is A – about 27.5 Hz. This means that, when the hammer hits the string, the string vibrates fundamentally 27.5 times every second. Middle C on a piano is about 261 Hz. The note A above middle C is about 440 Hz. The highest note on a standard piano is 4186 Hz. Of course, the harmonics of these notes are much higher; sometimes beyond the range of human hearing.
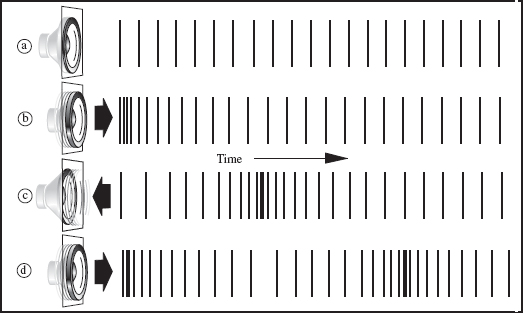
FIGURE 2.1
Changes in pressure
• What is a wavelength? The wavelength is the length of the sound wave, or the physical space it takes to complete a single cycle (Figure 2.2). The wavelength is equal to the speed of sound divided by the pitch, or frequency. For example, 220 Hz has a wavelength of about one-and-a-quarter feet; 440 Hz has a wavelength of about two-and-a-half feet because the speed of sound (1125 fps (feet per second)) ÷ frequency (440 Hz) = 2.55 fps.
• How does this affect me in the studio? If you place two microphones on a single sound source, one close and one a few feet away, unless the phase cycle reaches the microphone at exactly the same phase cycle, the far microphone will be ‘out-of-phase’ with the close one. Many engineers complain that tracks recorded by junior engineers have phase issues. See Chapter Three for more on phase issues.
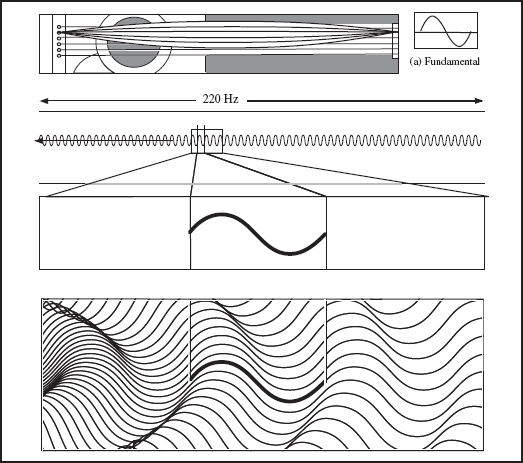
FIGURE 2.2
Wavelength
• What are fundamental frequencies? The fundamental frequency is the lowest octave an instrument can produce. For example, when plucked, the A string on an acoustic guitar vibrates at 220 Hz – its fundamental frequency.
An instrument's fundamental frequency commonly depends on the size of the instrument. For example, the fundamental frequency of the A string on a ukulele is an octave higher, at 440 Hz.
• What are overtones and harmonics? A guitar string resonates at multiples of the fundamental, called overtones, containing musical and non-musical content. Figure 2.3 shows (a) the fundamental, (b) the second harmonic, (c) the third, (d) the fourth, and on. The final resultant (e) is a complex waveform making up the instrument's timbre, as shown in Figure 2.4.
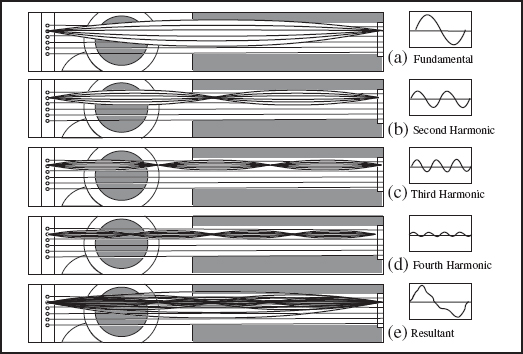
FIGURE 2.3
Fundamental and overtone
Pluck an A string on an acoustic guitar and listen to the harmonics, or the musical overtones. The richness of a sound lies within these overtones and other harmonic frequencies. They are what distinguish one musical instrument's timbre from another. Without overtones, all instruments would sound the same.
• What is pitch? Pitch is the perceived frequency of a musical note.
• What is an octave? An octave, measured in frequencies, is a 2 : 1 relationship. For example, 80 Hz is an octave higher than 40 Hz and 600 Hz is an octave higher than 300 Hz. Musically, an octave is the distance between similar notes. One A note is an octave away from the next A note.
• What is resonant frequency? Resonant frequency is the tendency of an object or room to oscillate at a certain frequency, depending on the size of the object. A room's resonant frequency is dependant on its depth, height, and width. For example, a room measuring 10.2 feet will resonate whenever an A note (110 Hz) is played, because the wavelength of an A note is about 10.2 feet (or 5.1 feet, or 2.55 feet, as noted above). A properly designed room does not have equally sized length, width, and height, so as to minimize certain frequency buildups. History tells us that multiples of three, four, and five tend to be good combinations of studio wall sizes. Figure 2.5 shows a properly designed room where the walls measure 15, 20, and 25 feet, respectively, with resonant frequencies spread out to minimize buildup.
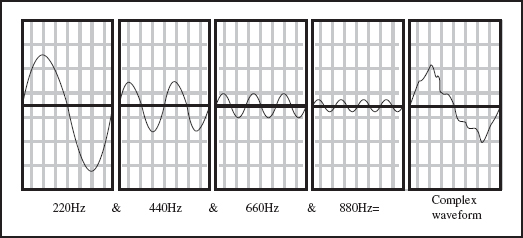
FIGURE 2.4
Complex waveform
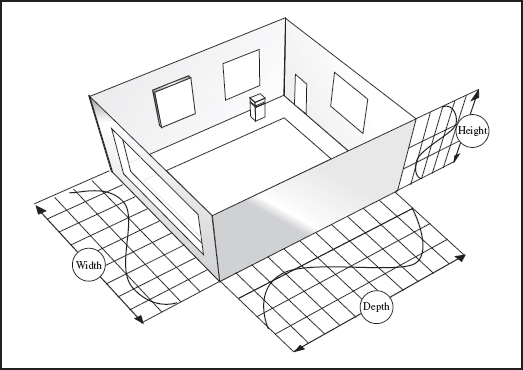
FIGURE 2.5
Resonant frequency
If the studio walls were, for example, 15 × 15 × 15, there would be massive frequency buildup at (1125 ÷ 15 feet =) 75 Hz, 150 Hz, 300 Hz, etc. 75 Hz is somewhere around a low D. This room would resonate whenever a D note were played.
• What is decay? Decay is the time it takes a musical instrument's sound to die down. Decay on a snare drum might be a second. Decay on a low piano note might be 20 seconds.
Human Hearing
The ears are funny things – especially my brother's. The human ear can hear, ideally, from 20 Hz to 20 kHz, but as we age we tend to lose our higher frequencies. Commonly, adults cannot hear beyond around 16 kHz. That does not mean we cannot sense these frequencies. Although we may not hear them, they do interact with frequencies we can hear. As is stressed throughout this book, your primary goal is to have a lifelong love affair with your hearing.
Levels
Play an A note on the piano, and the primary frequency is 220 Hz. An octave higher is 440 Hz. An octave higher than that is 880 Hz, the next A is 1760 Hz, and so on. Note how the frequency rises exponentially, or non-linearly. Because frequencies rise exponentially, their corresponding pressure levels rise exponentially as well. The more pressure, the louder the sound. Really loud sounds can produce massive amounts of pressure – so much pressure that signals need to be measured using a system that measures loud signals on a similar scale to quiet signals. The system used is the decibel system.
• What is frequency spectrum? Frequency spectrum is each instruments range of audible frequencies. Since human hearing hovers between, say 40 hz and 16 000 hz, where do a musical instruments fundamentals and harmonics fall within that range?
Each instruments characteristics are different, commonly, an instruments fundamental frequencies dwell in the low and low-mid frequencies, and the overtones lie in the higher frequencies. Figure 2.6 is an example of how each musical instrument has its own set of fundamentals and harmonics.
• What is a decibel? The decibel (deci: ![]() and bel: Alexander Graham Bell) keeps track of the wide changes in acoustic and electrical levels. Bell determined that one decibel (dB) was the smallest change in volume a human could perceive, no matter what the level. The decibel is simply a comparison of two numbers: the signal level and a predetermined 0 reference. With human hearing, the 0 dB SPL (sound pressure level) reference is the threshold of hearing. Bell used the decibel to assess, among many other measurements, sound pressure level (dB SPL), voltage (dBu, dBv, and dBV), power level (dBm), and changes in signal level (dB).
and bel: Alexander Graham Bell) keeps track of the wide changes in acoustic and electrical levels. Bell determined that one decibel (dB) was the smallest change in volume a human could perceive, no matter what the level. The decibel is simply a comparison of two numbers: the signal level and a predetermined 0 reference. With human hearing, the 0 dB SPL (sound pressure level) reference is the threshold of hearing. Bell used the decibel to assess, among many other measurements, sound pressure level (dB SPL), voltage (dBu, dBv, and dBV), power level (dBm), and changes in signal level (dB).
Figure 2.7 shows how every doubling of pressure level equals an increase of 6 dB, no matter what that pressure level is. For example, one guitar might create a level of 80 dB. Bring in another one, and it doubles the SPL, or Phons, increasing the level by 6 dB, resulting in 86 dB. If 10 guitars created 100 dB, 10 more would create 106 dB.
Peak versus Volume Unit (VU)
• What are peak and VU? Let's understand peak and VU (volume unit) levels by looking at the audio meters used in the recording process. Audio meters are visual displays that show both peak levels and VU levels.
• Peaks. Peak meter readouts show the maximum instantaneous level, called transients, and are much faster than VU meters. Although we may not hear all of the peaks, they are there and must be addressed when recording. Peak readouts allow the user to see if a signal is overloading the input buss.
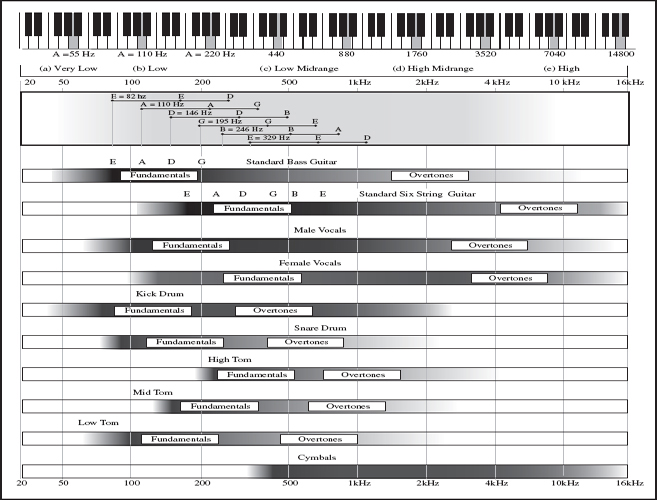
FIGURE 2.6
Instruments within the audio spectrum
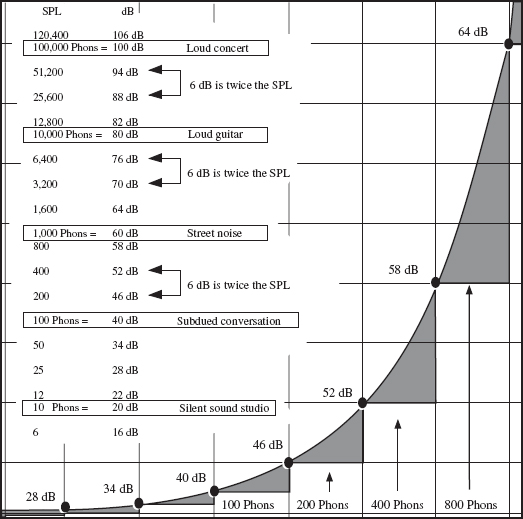
FIGURE 2.7
SPL versus decibel
• VU. Volume unit meter readouts show RMS (root mean square). Because humans hear, or sense, sound levels as an average, sounds are measured similarly. For example, a high hat has a high transient level that might not fully register on VU meters. Because different instruments have different characteristics, each has its own peak and VU display. As a rule, some instruments, or parts, such as a keyboard pad, have minimal difference between peak and VU. Others, maybe string instruments such as guitars, or percussion instruments such as high hats, have more transient peaks.
Figure 2.8 shows three different meter readings. Because sometimes the ear doesn't catch everything, meters display a visual representation of how a sound is being processed. Figure 2.8(a) shows a sample readout of the characteristics of a keyboard pad. See how there is minimal difference between the peak and VU levels. Figure 2.8(b) shows a guitar, where there is somewhat more of a difference between the peak and the VU readouts. Figure 2.8(c) shows a high hat, where there is a wide difference between the VU and peak readouts.
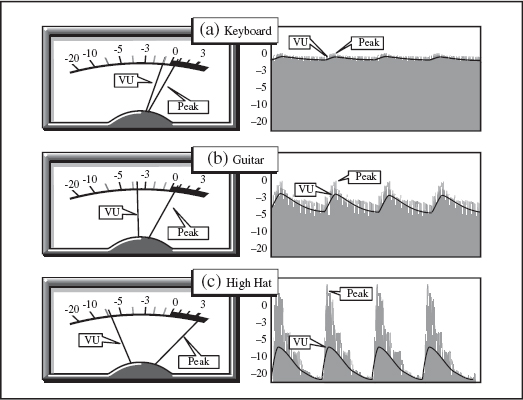
FIGURE 2.8
Peak versus VU (volume unit) levels