
16. Pulling It All Together
This chapter covers the areas needed to finish off Sir Lamorak’s Quest. The features discussed include saving the game’s state, saving the player’s scores, performance tuning, and getting the game beta tested.
We have come a long way since the start of this book, and a lot of detail has been covered. From my own experience, and the experience of many other programmers I’ve spoken to on forums, the last 10 percent of a game is the hardest. Finishing off those little touches, tweaking the game play, checking for memory leaks, and so on all need to be done—and they can make or break a game.
The “Camera”
No, I’m not going to describe how to become a professional photographer, but I am going to run through one of the most important elements of Sir Lamorak’s Quest—the camera. By camera, I mean the process by which Sir Lamorak is rendered in the middle of the screen, and how the map scrolls around in relation to Sir Lamorak’s position.
How a camera is implemented really depends on the game. For Sir Lamorak’s Quest, I chose to keep the knight in the middle of the screen at all times. Another approach could have been to let the knight move to the edge of the screen when he reached the edge of the tile map, causing the tile map to never scroll beyond its bounds.
The implementation of the camera for Sir Lamorak’s Quest is actually very basic and is handled within the renderScene method in the GameScene class. Listing 16.1 shows the code in this method that is used to position Sir Lamorak in the middle of the screen.
Listing 16.1 GameScene’s renderScene Method Positions the Player in the Middle of the Screen

After clearing the screen, the current model view matrix is pushed onto the stack, saving its contents. This is followed by a glTranslate command that takes half the width and height of the iPhone screen and subtracts the player’s pixel location.
Remember that our tile map is 200×200 tiles. With each tile being 40×40 pixels, that gives us an area that is 8000×8000 pixels.
By translating in this way, when we render the knight at its current pixel location, it will be in the middle of the screen, even though it is being rendered based on our world coordinates. Each time a scene is rendered, we are positioning the camera (that is, the iPhone’s screen) directly above Sir Lamorak’s location, with the knight in the middle of the screen. This gives the impression that the knight is stationary and the map is moving around the knight.
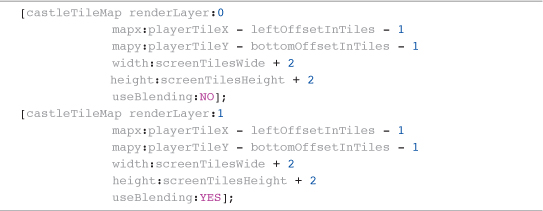
With our translation now set up, we can render the map layers. For this, we need to calculate which tiles are going to be visible based on the knight’s location. Listing 16.2 shows the tile map rendering code used to render the map and object layers.
Listing 16.2 GameScene’s renderScene Method (Tile Map Rendering)
As you saw when we covered the TiledMap class in Chapter 9, “Tile Maps,” the location of each tile is calculated when the tile map is initialized. Having used glTranslate to move the world’s coordinates, as long as we render tiles around the player, they will be visible onscreen. This means that we need to work out which tiles will be visible based on the player’s location.
Knowing the player’s tile location, the leftOffsetInTiles and bottomOffsetInTiles are calculated when GameScene is initialized using the following:
![]()
This enables us to calculate the x and y tile within the tile map from where we need to start rendering. We also use the screenTilesWide and screenTilesHigh variables, which were calculated during initialization using the following:
![]()
Notice that we are actually subtracting 1 from the x and y tile location, and adding 2 to the width and height. As the player moves around, the tile map changes by a minimum of one pixel at a time if the player is moving slowly. This causes the map to move smoothly around the player. By adjusting the x and y tile map location along with the width and height, we can render a section of tile map that is a little larger than the screen. This means that as the player moves around, you won’t see tiles suddenly disappear as they leave the screen or suddenly appear as they enter the screen.
Having rendered the tile map, the renderScene method then renders each of the entities and objects whose positions are relative to the tile map. Remember that we still have our translation in place so these entities and objects will be rendered in relation to the player and the map correctly.
After we render all the game objects and entities, we then pop the model view matrix from the stack using glPopMatrix. This puts the model view matrix back to the state it was in before we started to render the scene. We can start to render the game’s interface items that need to float above the game and that we don’t need to render in relation to the game objects and entities.
Note
It can take a while to get your head around how the camera works, but this implementation is actually very simple. Other games implement much more complex cameras, where it may be possible to move the camera independently from the player.
Sir Lamorak’s Quest implements a fixed camera with the camera’s position being calculated within the render method. To achieve more complex camera behavior, you would need to implement a separate camera method that is responsible for calculating the position of the camera base on as many parameters and options as were necessary.
Saving the Game State and Settings
One of the key design points noted back in Chapter 1, “Game Design,” was that the game had to be casual. This meant that the game had to be simple enough that the player could pick it up and put it down without needing to read pages of instructions. It also meant that the player should be able to stop playing at any time and have his progress saved.
Hitting the Home button on the iPhone when your train arrives and losing your progress is annoying, and chances are the user will soon delete your game (and hopefully not give it a one-star rating). Hitting the Home button and then being able to either start from scratch or continue from where you left off is much more friendly.
Saving Game State
To make this happen, we need to be able to save the game’s state as soon as the player hits the Home button, or returns to the main menu from the settings screen. As discussed in Chapter 14, “Game Objects and Entities,” each object in the game can be written to handle its own archiving by implementing the NSCoding protocol.
What we now need is the ability to save and restore those objects. Saving the games state is implemented in the GameScene class. All the information we want to save is in the GameScene, so it makes sense to place the method in that class. We also need to save the game settings, but this is done within the GameController class and covered later in this chapter.
The method responsible for saving our games state is called, well, saveGameState: and can be seen in Listing 16.3.
Listing 16.3 GameScene saveGameState: Method
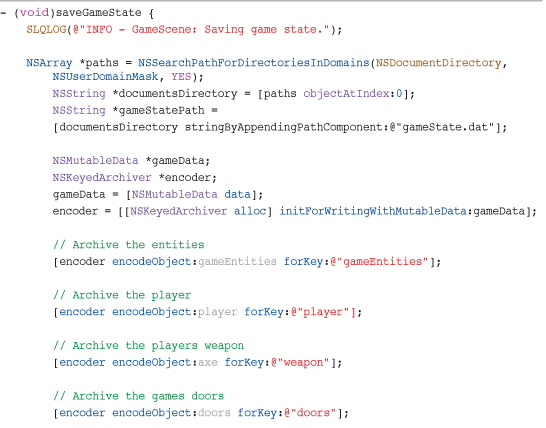
The first task for this method is to create a path to the file that is going to store the games data. This is going to be called gameState.dat, and will be saved to the game’s sandbox documents directory. Remember that every application on the iPhone has its own sandbox directory structure that is created with the application and also deleted when the application is deleted. The commonly used directory in this sandbox for saving data is the documents directory.
With the path set up, an NSKeyedArchiver is created along with a storage area where the archived data is going to be held. This is an NSMutableData variable called gameData.
With those in place, we simply ask each of the arrays that store game data to encode themselves and provide a key for getting to that data when we come to decode the information. When encoding an object that is an array, each object in the array that supports NSCoding is asked to encode itself using the code we saw in Chapter 14. This enables us to encode an entire array with just this one line of code.
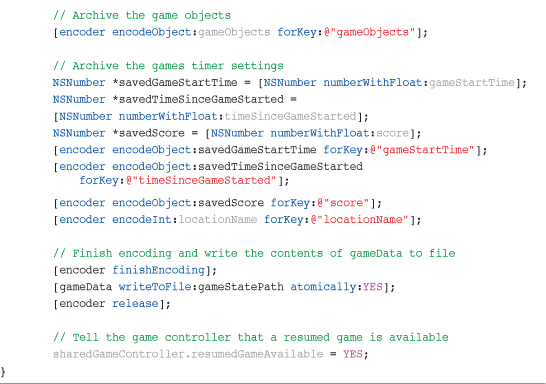
After all the important arrays are encoded, we also encode the single objects and values that we want to save. These include the player, axe, score, and times. With this information all encoded, we then finish encoding and write the contents of gameData to the gameStatePath calculated at the start of the method. That’s it—all the data required to run our game is now ready to be loaded when we want to resume a game.
Loading Game State
With our game state saved, we now need a mechanism to load it back again. This really is just the reverse of what we have just seen. This is handled by the loadGameState: method inside GameScene, shown in Listing 16.4.
Listing 16.4 GameScene loadGameState: Method
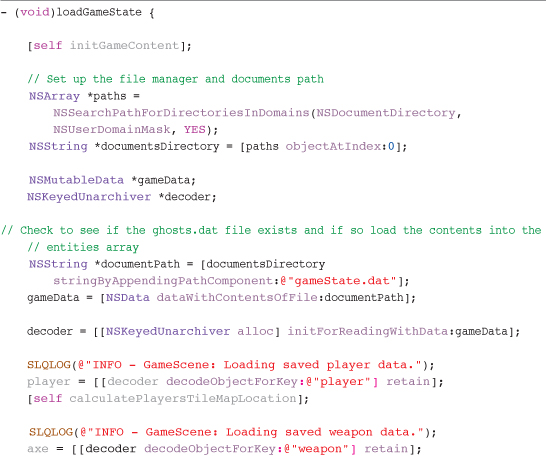
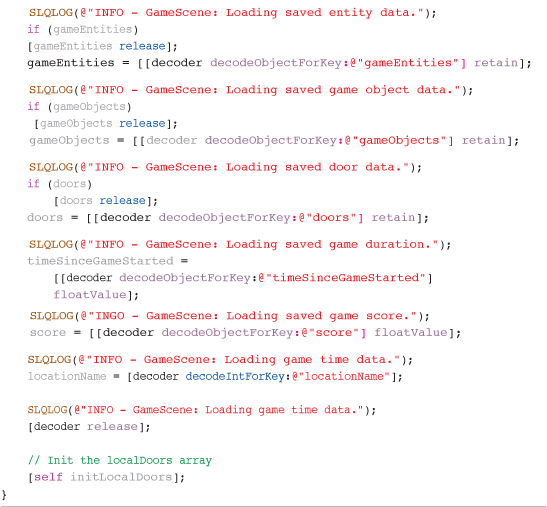
The start of this method calls the initGameContent method that sets up the tile map, collision map, and portals. With these configured, we then generate a path to the gameState.dat file that was created when we saved the game state. A decoder is then set up and the data that was saved is reloaded using the keys we defined when saving the information. Decoding the object with the key gameEntities causes the appropriate entity class to be called with initWithCoder:coder:, which creates a new instance of the class. That instance is then loaded into the gameEntities array. Once this is finished, the array and its entities are in exactly the same state it was when it was saved.
Finally, the initLocalDoors method is called. This is responsible for populating the localDoors array. This array is populated with doors that are within the visible tile map. Only these doors are updated and rendered, which helps with performance. The local door’s array is updated each time the player moves.
Saving Game Settings
As well as saving game data that allows us to restore a game, we also need to save the game’s settings. These are the music volume, sound effect’s volume, the location of the joypad, and the fire direction. Rather than use the same method we used when saving the game state (which is perfectly valid), I decided to use NSUserDefaults.
NSUserDefaults provides a way to programmatically interact with the defaults system. Information stored in NSUserDefaults is written to the <Application_Home>/Library/Preferences directory.
Using NSUserDefaults makes it extremely easy to store the settings values for our game. The settings values are managed inside the GameController class, so that is where the saveSettings method has been implemented, as shown in Listing 16.5.
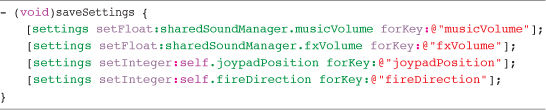
Listing 16.5 GameController saveSettings Method
The settings variable is configured in the initGameController method of the GameController class using the following:
![]()
With settings initialized, we can use the methods available within NSUserDefaults to store the setting’s values. You’ll notice that we defined a key for each entry stored. This information will be used when reading the settings when the game is loaded.
Loading Game Settings
Having saved the game settings, we need to be able to load them. This is done when the game first loads. Inside the SLQTSORAppDelegate class, the applicationDidFinishLaunching: method calls the GameController loadSettings method, shown in Listing 16.6.
Listing 16.6 GameController loadSettings Method
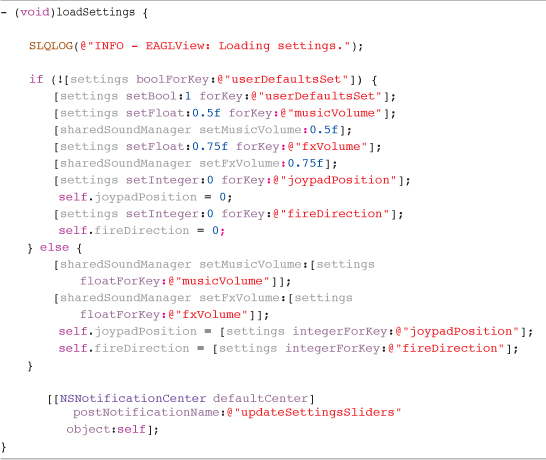
The method first checks to see if the NSUserDefaults entry with the key userDefaultsSet has a value of 1. If not, the games settings have never been saved, so default values are used and the userDefaultsSet entry is updated to 1.
If the userDefaultsSet preference does have a value of 1, the values for the games settings are read.
Last of all, a notification is posted called updateSettingsSliders. At this point, the SettingsViewController class will have been initialized, so we need the controls on that view to be updated with the values read from the settings file. That class observes the notification, and the controls are updated using the values now managed by the GameController.
Saving High Scores
So far, we have looked at how to save the game’s state and settings. There is more information that needs to be saved: the player’s high score.
The player and his friends will play the game and fail, at least when they first start playing. They will also eventually win and want to improve their score or time. For them to do this, they need to be able to look back at what they have achieved in the past.
This is done by providing them with a high scores table. You will have seen this when trying out the SLQTSOR project. The score is held as in integer within the GameScene class and is incremented by each entity when it is killed.
Within the GameScene class, an instance variable called score holds the players score. This score is updated by each entity as they are killed. When the game ends, either because the player won or lost, they are presented with a screen that provides them with information on their game (that is, how long they played for and what their score was). The Game Over screen can be seen in Figure 16.1.
When the player then taps the screen, he is asked to enter his name, which is shown in Figure 16.2.
Figure 16.1 Game Over screen in Sir Lamorak’s Quest.

Figure 16.2 Name entry screen.

If the user presses the Dismiss button, the score is thrown away and not recorded. If he enters a name, the current date and time, score, game time, and whether he won or lost is recorded.
Listing 16.7 shows the alertView:clickedButtonAtIndex: method used to capture input from the player.
Listing 16.7 GameScene alertView:clickedButtonAtIndex: Method

Note
I chose to use an arbitrary number for the tag value given to the UITextField. Feel free to use another number, if you’d like.
This method is the delegate method for the UIAlertView. When the game is over or completed and the user touches the screen, a new UIAlertView is created in the touchesBegan:withEvent: method in GameScene. This creates an alert view with the necessary controls, including a text box, and positions it onscreen so the keyboard will not cover it.
It also sets its delegate to self, and it’s the alertView:clickedButtonAtIndex: method that is called when any buttons are pressed.
The first activity the method performs is to grab a reference to the UITextField that was placed on the alert view. A check is then performed on the buttonIndex to see which one was pressed. Button index 1 means the OK button was pressed. If that is the case, the text is taken from the text field and its length is checked. If the length is 0, then a default name is set.
The next step is to save the high score information. This is done by calling the addToHighScores:gameTime:playersName:didWin: method in GameController. The information provided in this method call is taken from the values in GameScene.
The text field responder is then resigned, any saved game state is deleted, and the scene is set to transition out, back to the main menu.
Adding a Score
Listing 16.8 shows the method inside GameController that adds a score to the high score list.
Listing 16.8 GameController addToHighScores:gameTime:playersName:didWin: Method
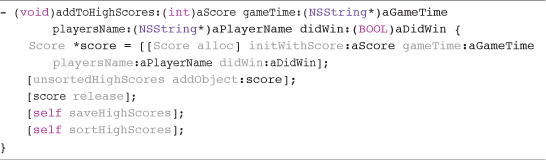
This method creates a new instance of the Score class, which can be found in the Game Scene > Menu group of the project. The Score class is used to store the information we want to record about the players score, including the following:
• The player’s name
• Date and time the score occurred
• Score
It also implements the NSCoding protocol so that it can encode and decode itself. This is how we are going to save the information to disk.
The GameController class has an instance variable called unsortedHighScores. This NSMutableArray stores the instances of Score that have been loaded when the game started and those created during game play.
After the new Score instance has been added, the contents of the array are saved and then sorted. Sorting the array is done using the sortHighScores array, as shown in Listing 16.9.
Listing 16.9 GameController sortHighScores Method
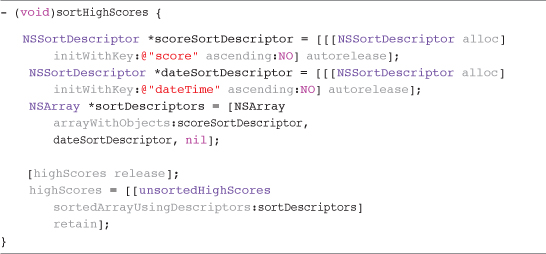
This method makes use of the NSSortDescriptor class to create a sort descriptor on the properties of the Score object. This is a simple way to sort arrays. Two sort descriptors are recreated: one on the score, and the other on the date and time. These are added to an NSArray. The order of the sort descriptors in the array defines the order in which they are applied to the objects.
The highScores array is then released, and is ready to be populated with a new sorted list of high scores. Sorting the unsortedHighScores array is done using the sortedArrayUsingDescriptors: method.
That’s it; we now have a sorted array of scores. It is the highScores array that is accessed from within the HighScoreViewController class and used to feed the UITableView.
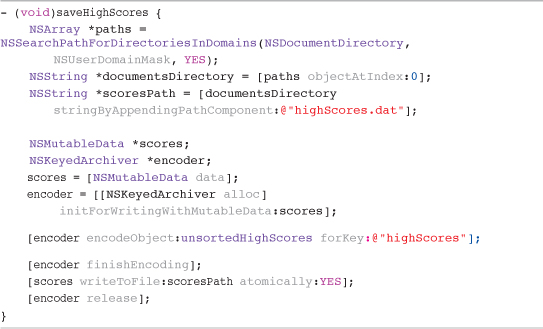
Saving High Scores
The method to save the scores is exactly the same as saving the game state. The Score class implements the NSCoding protocol and the saveHighScores method in GameController is used to archive the contents of unsortedHighScores to disk, as shown in Listing 16.10.
Listing 16.10 GameController saveHighScores Method
Loading High Scores
Loading the high scores when the game starts is just as simple as saving them. Listing 16.11 shows the loadHighScores method inside the GameController.
Listing 16.11 GameController loadHighScores Method
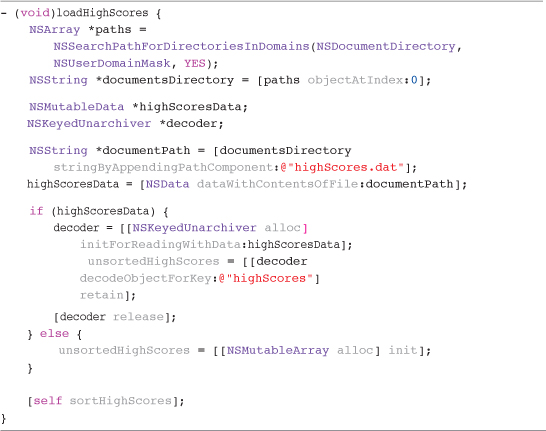
When the GameController is first initialized, any high scores are loaded. From that point, the unsortedHighScores array is managed by GameController and then saved back to disk when new scores are added.
Performance and Tuning
When writing software for a mobile device, such as the iPhone or iPad, it’s important to make the best use possible of the resources you have available. This is where Instruments (located in /Developer/Applications) can be used. Instruments provides a number of really helpful tools that can be used to monitor different aspects of your application, including the following:
• Object allocations
• Memory leaks
• OpenGL ES
• CPU
These Instruments are great for tracking down performance issues or memory leaks within your application.
I first started using Instruments when I was testing the ImageRenderManager class. I wanted to see how much I was using the GPU. The OpenGL ES instrument is perfect for checking to see how the GPU is being used, and it enables you to spot where you may need to make changes.
Another instrument I regularly use is Leaks. This instrument enables you to see leaks within your code and track down where they are. Leaks are caused when your application loses track of memory that it has asked the OS to allocate. If you remove or overwrite a pointer to a block of memory, there is no way to then be able to free the memory and return it to the OS. Therefore, you have leaked this memory. It’s basically telling you that spending hours optimizing code, before you even know that it needs to be optimized, can delay projects; this can also result in complicated and difficult-to-understand code.
Tip
Something I keep in mind while developing is a saying that my old computer science teacher told my class many years ago: “Premature optimization is the root of all evil.” He was not the one to coin that phrase, but it has stuck with me over the years.
Optimizing your application, especially a game, is important, but it should be done on the basis of evidence (that is, profiling) and an obvious need, not just because a piece of code looks like it may be slow.
There are areas in Sir Lamorak’s Quest that I believe can be optimized—making more use of C functions rather than Objective-C methods, for example, could further optimize the particle system. Having said that, the game runs fine on all the different iPhone platforms currently available, so I felt no need to complicate the code further by introducing more optimizations in that area.
When it comes to finding the bottlenecks in your code, Instruments can help.
This section is not intended as a complete guide to using Instruments; rather, it’s intended as a primer to let you see the kind of checks that can be made using Instruments and how to get information about the most common areas of interest (for example, OpenGL ES, CPU, and memory).
Using Instruments
Using Instruments could not be easier. With your project open in Xcode, select Run > Run With Performance Tool in Xcode’s menu bar. This brings up a list of template instrument configurations, as shown in Figure 16.3.
Figure 16.3 Selecting a template instrument in Xcode.
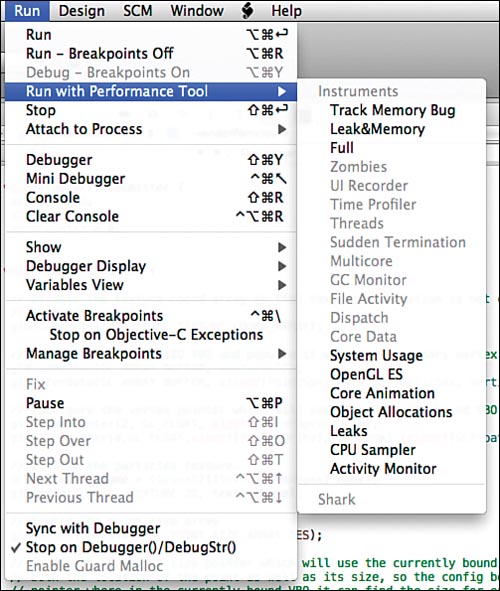
There are a number of different templates, including a few that I created myself (that is, Track Memory Bug, Leak&Memory, and Full). You can add as many instrument templates in Instruments as you need. After you have added and configured your instruments, you can save it as a template so it shows up in the list in Xcode.
Note
The existing templates contain a number of different instruments already in place that you can immediately put to use.
Leaks Instrument
Selecting the Leaks instrument starts the Instruments application using that template. It also runs the current project in the iPhone Simulator or on the iPhone, depending on which you have selected. Figure 16.4 shows Instruments when the Leaks template is selected.
Figure 16.4 Instruments running the Leaks template on SLQTSOR.
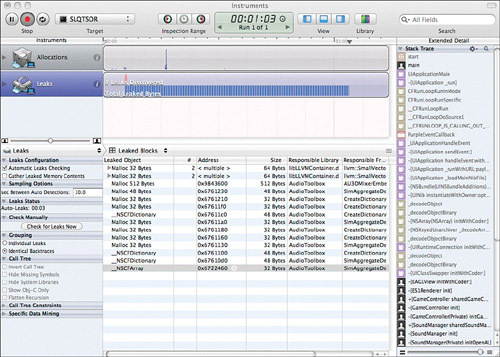
The top of the interface shows the graphical view of object allocations that are being made. The spike that can be seen is when Sir Lamorak’s Quest starts creating new objects and allocating space for images and sprite sheets.
The second graphical view is the leaks that have been found. The brown bar identifies how many leaks have been found, and the blue bars represent the total amount of leaked memory. The Leaks instrument has been selected, and you can therefore see in the bottom panel the leaks that have been found.
Notice that not all leaks come from your own application. If you look at the Responsible Library column, you see that none of them are SLQTSOR—they are all Apple frameworks. Even Apple’s code has leaks, and there is not much you can do about those. You’ll also find that you get different libraries reporting leaks on the iPhone Simulator as you do on the iPhone. I have had instances where the iPhone Simulator reports no leaks, but the same testing on the iPhone does identify leaks.
Tip
Nothing beats testing your application on a real device. The iPhone Simulator is just that—a simulator (not an emulator). The performance on the iPhone Simulator is nothing like that on an actual iPhone. For best results, you really must test your application on different iPhone devices. Getting friends and family to beta test can help with this, and that’s a topic we cover later in this chapter.
To demonstrate how a simple leak can be tracked down, open the project called Leak. This is a simple iPhone app that writes a couple of lines to the log file; nothing will be displayed in the iPhone Simulator apart from a grey screen.
In Xcode’s menu, select Run > Run With Performance Tool, and then select the Leaks templates. The Leaks instrument appears, and the application starts to run on the iPhone. Figure 16.5 shows Instruments running the Leaks instrument.
Figure 16.5 Instruments running the Leaks instrument.
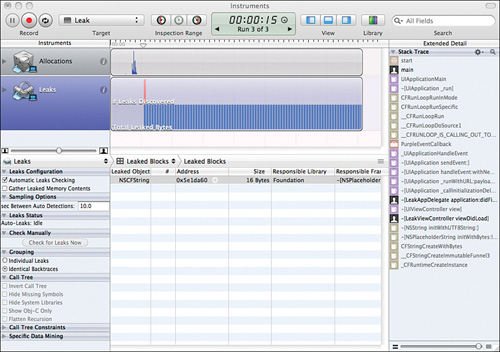
You’ll notice that, after a few seconds, the Leaks instrument shows that leaks have been discovered and the total leaked byte count. At this point, press the Stop button so you can start to track down the leak.
Make sure that the Leaks instrument is highlighted. This provides you with a list of leaked objects in the middle panel, as shown in Figure 16.5. Also, make sure that the extended detail view is enabled. Figure 16.6 shows the options that should be enabled at the top of the Instruments GUI.
Figure 16.6 Leaked block view and extended detail view enabled.

The extended detail view is really useful because this can show you where in your code the leak was detected. Select the leak, and on the right side in the extended detail view, you will see the stack trace to the point where the application leaked memory. Look for the last mention of the application; all stack entries related to your application will have the logo of a person to show they are entries from your app, not a framework or iOS.
The code where the leak was detected will not be shown in Instruments’ center panel, as shown in Figure 16.7.
Figure 16.7 Code highlighted that has leaked.
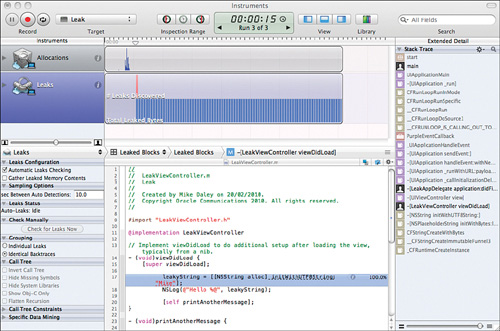
You can see that the line in the viewDidLoad: that allocates a new string has been highlighted, along with the number of bytes that have leaked. Although Instruments has been able to tell you where it found a leak, it can’t tell you why the leak is occurred. This requires some investigation on your part.
It should not be too hard to spot that we are allocating leakyString in the viewDidLoad: method and then again in the printAnotherMessage: method without releasing the already allocated string. This means the pointer to that first string is going to be lost—we can’t release the memory, therefore creating a leak.
Add the following two lines of code in front of the string allocation in the printAnotherString: method:
![]()
This simply releases leakyString before allocating it again if it has already been allocated.
Now recompile the application, run it in the iPhone Simulator, and then hit the Record button in Instruments. This time, no leak should be found and nothing should show up in Instruments’ Leaks instrument.
Although Instruments could point to the leak, it probably won’t tell you why it was leaking. This could be elsewhere in the code, and with a more complex application; it can take a while to track these down. A good approach to avoiding leaks is to identify where an object should be sent a release or autorelease message as soon as you have written the alloc for that object. This reduces the chances of forgetting that you have allocated an object and will need to release it later. It’s also a good idea to run the Build and Analyze function within Xcode. This will point you to locations that the compiler thinks a leak will occur.
Using the OpenGL ES Instrument
The OpenGL ES instrument enables you to monitor the usage of the GPU as well as see the CPU usage. This is useful because you can monitor for drops in OpenGL ES frame rate and see if there is a corresponding spike in CPU usage. Although this instrument can’t tell you what you may be doing wrong, it can at least point you in the right direction.
Note
The OpenGL ES instrument is available only when running your application on a real device; it can’t be used when running in the iPhone Simulator.
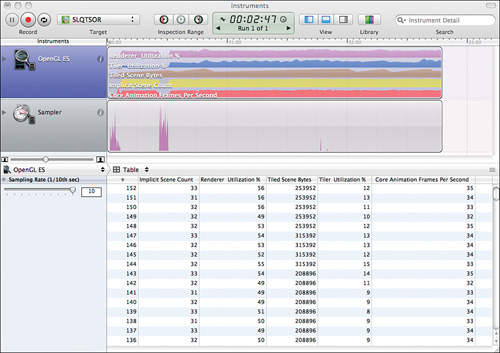
Load the SLQTSOR project and then run the OpenGL ES instruments template. After Sir Lamorak’s Quest is running on your iPhone, start playing a new game. Once in the game screen, move back to Instruments, as shown in Figure 16.8.
The top instrument provides details of what OpenGL ES is doing. Clicking the Inspector button (the one with the “i” on it) enables you to configure the information that each instrument is showing. If you don’t see the same information shown in Figure 16.8, click the Inspector button again and select the information you want to see.
A detailed table view of this information can also be seen at the bottom of the window. I usually change the sort order of the sample number, which is the first column in the table. This keeps the latest sample at the top of the table while the game is running.
Figure 16.8 OpenGL ES instrument monitoring SLQTSOR running on an iPod 2G using iOS 4.
Note
The table lets you see the Implicit Scene Count, Renderer Utilization, Resource Bytes, Tiler Utilization and Core Animation Frames Per Second. It can take a while to get used to what you are looking at, but the ones I use most often are Renderer Utilization and Frames Per Second.
The table in Figure 16.8 shows that the OpenGL ES renderer is running at between 50 and 60 percent. This is a reasonable figure and means we have some headroom if a scene was to get busy with a lot of particle effects or a larger number of sprites being rendered. If you were constantly running at near to 100 percent then some optimization may be necessary if the game tends to slow down when things get busy with a lot of objects on the screen.
One area that can really push up the amount of work the GPU is doing is blending. Blending images into a scene using transparency puts a lot more load on the GPU. It’s always a good idea to try to reduce the amount of blending e.g. transparency you have in a scene.
The second instrument in this template is a sampler. This records the CPU activity alongside OpenGL ES. This is useful if you spot a frame rate drop and a CPU spike at the same time. Identifying the code that is causing the CPU spike is relatively easy to track down.
Moving the tracking head along the time line at the top of the window enables you to select a spike on the CPU chart. Once selected, and with the sampler instrument highlighted, the sample associated with the spike is shown in the detail pane. With the Extended Detail View window visible, you can again see the stack track at that point in time.
If you double-click the first entry for the application in the stack trace, you will be taken to the code that was running, causing the high CPU usage. Figure 16.9 shows the code associated with a spike.
Figure 16.9 Code associated with a spike.
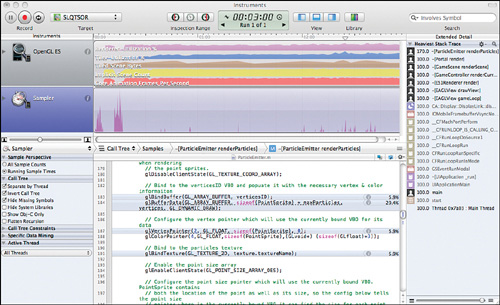
The great thing about this view is that it provides you with information on the amount of time, as a percentage, spent on commands within the code. In the example shown here, the glBufferData command is taking up 29.4 percent of the time in this class. Given that this command is copying the vertex information into a VBO before rendering, this would make sense.
Armed with this kind of information, you can start to track down code that is causing the spikes and work out strategies to improve performance. However, getting a spike does not mean that you need to fix something. As with Sir Lamorak’s Quest, if the game is running fine with no noticeable slow downs, there is nothing to fix.
Compiling for Thumb
There is an easy way to gain a huge performance increase in your game without doing any work at all. The ARM processor used by the iPhone processes floating-point instructions natively. Therefore, you should make sure you use floating-point math whenever possible. By default, your project’s build settings are set to compile using Thumb.1 This stops the iPhone from using its native floating-point support.
Given that most games perform a lot of float-point math, this is bad thing. Disabling the Compile for Thumb option in the build settings of your project normally provides a significant performance increase.
Beta Testing
With the finishing touches added to the game, leaks tracked down, and acceptable performance, it’s time to release your creation to a wider audience.
Beta testing an important part of your game’s life cycle to the App Store. You may have been playing it for months during development and testing, and are now very familiar with all its features and functions. This can lead to a biased test plan, where you unknowingly don’t press it too hard in areas that are a little weak.
Getting your application into the hands of others is a great way for the game to be tested by people who have no prior knowledge and will bash it into submission.
I wanted Sir Lamorak’s Quest to be a polished game, not just a small example app to go with the book. This meant that when I was almost finished, I wanted to make sure there were no areas of weakness and also that the game itself played right.
Using my blog (www.71squared.co.uk), I put out a request for 10 people who would like to beta test Sir Lamorak’s Quest. To my delight, I had all 10 within a matter of hours, which was fantastic. If you don’t have a blog, you can use family and friends who have iPhone devices or even put a shout out on popular forums, such as iDevGames (www.iDevGames.com) or the #iPhoneDev IRC channel.
It’s important to make sure the testers know what it is you want them to do and how to report back to you. It’s also good to define a timeline when you would like the feedback to keep things moving forward.
You also want to make sure that the beta testers have a range of devices. If your game is designed to work on all devices, you really need to make sure it has been tested on all devices. This also means you don’t need to own all the different devices yourself.
Tip
Although you can obtain the UDID of your device in Xcode, your beta testers might not have the developer tools installed or know how to obtain their device’s UDID. There are a number of apps on the App Store that your would-be testers can use to collect and send their UDID to you via email. Just ask them to open iTunes, go to the App Store, and have them search on “UDID.” They can then select one of the many free apps out there. It is also worth noting that these work on the iPad, too.
The UDID is a unique number that each iPhone, iPod Touch, or iPad has. With this, you can create an ad-hoc distribution profile and certificate that enables you to send the certificate and an ad-hoc build of your game directly to a tester, without going through the App Store.
At this point, it is worth noting that you cannot create these profiles or certificates unless you are a paid-up member of the developer program. More details about this can be found on the iPhone Development Center (developer.apple.com/iphone).
The process for creating provisioning profiles and certificates can be very daunting at first, but working through the wizards and documents available on the iPhone Dev Center will get you up to speed.
Multiple Device Types
One of the key benefits of using beta testers is that you can get your game tested across a number of different devices. This is important to make sure that performance and game play are consistent and that there are no specific device issues.
While beta testing Sir Lamorak’s Quest, a tester (actually, my editor, Chuck) spotted an odd light anomaly appearing onscreen, like a white flash. He reported this via email, copying the other testers. After doing so, a couple more testers said they were seeing the same issue, whereas others reported no such anomaly.
After a little research, it became obvious that the people spotting the flashes were running Sir Lamorak’s Quest on the iPhone 3GS. After more email exchanges to try to tie down the area where the flashes were being seen, the problem was traced back to the particle system. There were situations when the size of a point sprite fell below 0. This caused these flashes on the iPhone 3GS to render, while nothing happened on other iPod Touch or iPhone models. The fix was to simply make sure that point sizes were never smaller than 0 (that is, a negative number).
Without beta testing, I would never have spotted that because I didn’t have an iPhone 3GS, and the flashes weren’t showing up in the iPhone Simulator. Without proper testing, Sir Lamorak’s Quest could have released with a nasty-looking bug.
It is also worth making sure that the final version of your game is working before compiling a release version and sending it up to the App Store. I had completed all the testing on Sir Lamorak’s Quest and was ready to send it up for approval. I did, however, perform one more cleanup to remove old graphics assets I was not using. I compiled and ran the game it worked fine so I sent it up for approval.
The game was approved and appeared on the store about seven days later. Within hours, though, I had feedback that the game did not work, that the player was either stuck to the spot or there were not entities or objects in the map. I was really confused given all the testing that had been done.
I went back to the code and ran the project, again, everything was fine. So, I performed a clean on the project and ran it again, and—boom—I saw the exact problem the users were seeing. I spent a couple of hours tracking the problem that turned to be a missing graphics file that I had removed during my cleanup. The missing file was causing the code in the game to execute in an odd way due to a failure in loading this image. This in turn caused the issues the users were seeing with the game. I replaced the graphic, cleaned the project, and ran it again, and again and again, cleaning and running all the time until I was happy that it really was OK. I sent up this new version and, within a few days, version 1.1 was on the App Store and all was well.
This story really shows that you must test to make sure your final build really is stable and that nothing has changed.
Feedback
Beta testers can also provide great feedback around the actual game design itself. Sir Lamorak’s Quest received great feedback on the look and style of the HUD in the game. The original, shown in Figure 16.10, was seen as being too big and taking up too much screen space.
Figure 16.10 Sir Lamorak’s Quest’s original HUD.

This can be a balance of personal preference. If a single person from a group of ten doesn’t like something, it doesn’t mean that it’s wrong. I had over half of the testers mention that the HUD was too big. As a result, I decided that it needed to change.
Other feedback received was around the look of the fonts being used, difficulty in getting through doors, clipping of game characters under the door images, suspending the device was not pausing the game, and the list went on.
My overall feeling after the first round of beta testing had been completed was that the game was much more stable and polished, all because of the feedback from the beta testers. Without sharing the game with others, I don’t feel the game would have been as solid as it is, even with all the testing I performed myself.
Summary
This brings us to the end of this book. We have been on a long journey, covering many different aspects of developing an OpenGL ES game on the iPhone, and I hope you’ve enjoyed it as much as I have creating the game and writing this book.
The concepts and technologies we have reviewed throughout this book should give you the foundations needed to create your own games and extend your knowledge further. The game engine that we have developed throughout this book that is being used for Sir Lamorak’s Quest is only one approach. As with most things in software development, there are an almost infinite number of ways to solve the problems associated with writing a game.
Having looked at the details of implementing a complete game, you may now decide that you’ll make use of third-party frameworks to develop your own game. There are open source frameworks, as follows:
• Cocos2D iPhone, a 2D Engine (www.cocos2d-iPhone.org)
• Oolong, a 3D Engine (code.google.com/p/oolongengine)
• Sio2Engine, a 3D Engine (www.sio2interactive.com)
There are also commercial engines:
• Torque, a 2D/3D Engine (www.torquepowered.com)
• Bork3D, a 3D Engine (bork3d.com/engine)
• ShiVa 3D, a 3D Engine (www.stonetrip.com)
• Unity3D, a 3D Engine (www.unity3d.com)
Having an understanding of what is going on “under the hood” helps make the best use of these game engines, especially the open source engines that you can open up and examine.
Creating my own engine for Sir Lamorak’s Quest was both a frustrating and rewarding experience. I learned so much while tackling the problems encountered when creating my own game engine; I don’t believe I would have learned as much by using someone else’s framework. I can certainly see myself writing more game engines in the future, continuing to tweak them and improve them as I go.
So, all that is left is for me to wish you luck in your future game writing projects and that I hope what you have learned from this book will accelerate your learning and interest in game development on the iPhone platform. There is certainly more innovation happening on this platform than almost any other at the moment and now is a great time to be part of that revolution.
When you do create the next big thing, be sure to let me know, as I really enjoy playing other people’s games.