
LEARNING OBJECTIVES
To know about various classic modeling techniques
To know about the Unified Modeling Language (UML) and its main diagram types
To know the terminology of object orientation
Note
In the course of a software development project, and most notably during requirements engineering and design, many modeling notations are used. These range from very informal sketches of system functions or screen layouts, to highly formal descriptions of system behavior. The most common notations used are box-and-line diagrams with semiformal semantics. In this chapter, we discuss a number of these diagrammatic notations.
During software development, a lot of communication takes place. This communication is supported by all kinds of notations to convey its message. A sketch of a screen layout may support the communication between a user and a requirements engineer. A much more formal description of class interfaces may support the communication between a designer and a developer.
The most common notations used to support communication between the various stakeholders involved in software development involve some sort of box-and-line diagrams. Sometimes, these diagrams have very informal semantics. For instance, the boxes may denote parts of the system, where it is not clear what exactly a part is. One box may denote a major subsystem, another box may denote the set of security measures taken. Likewise, lines may denote a parts-of relation, a calling relation, a uses relation, and so on. While being drawn, these loose semantics may not be a problem. But the next day, confusion will arise.
An alternative is to use diagrams that have a more precise semantics. If the readers know these semantics, there need not be any confusion over what exactly is meant. If the semantics are precise enough, the diagrams can be subjected to all kinds of consistency checks. Tools may generate the diagrams, read them, and possibly even generate executable code from the diagrams. Finally, we may link the diagrams to the methods that generate them, thereby giving some operationalization to their construction process. For instance, the steps in a design method can be linked to the steps for generating the corresponding diagram. The latter kinds of diagrams are discussed in Chapter 12, together with a discussion of the corresponding design methods.
In this chapter, we discuss a number of semiformal modeling notations. Most of them use some sort of box-and-line diagram. Some use a more textual layout. The diagrams and schema are usually drawn during requirements engineering and design. Some primarily serve requirements engineering. For instance, use-case diagrams are usually drawn during requirements engineering. Jackson structure diagrams, on the other hand, are mostly used during design. Many modeling notations serve both.
Currently, the mainstream modeling notations stem from the Unified Modeling Language (UML). Many diagrams from UML, though, are based on or derived from earlier ones. And, certainly in legacy applications, you may come across many of these older notations. Therefore, a sample of both is provided in this chapter.
UML evolved from some of the mainstream object-oriented analysis and design methods. The concept of object orientation, in turn, has its roots in the development of programming languages, most notably SIMULA-67 and Smalltalk. With respect to analysis and design (and requirements analysis), object orientation is best viewed by highlighting the differences with more traditional design methods such as functional decomposition and dataflow design. Whereas traditional techniques focus on identifying the functions that the system is to perform, object-oriented methods focus on identifying and interrelating the objects that play a role in the system. Section 10.2 introduces a number of relevant concepts, such as object, attribute, class, relationship. In one way or another, these concepts show up in many UML diagram types.
We discuss four classic modeling techniques that have been around for quite a while:
Entity—relationship modeling (ERM) is a data modeling technique, pioneered by Chen (1976). UML class diagrams are based on ERM.
Finite state machines (FSMs) are used to model states and state transitions. In the early days, certain types of formal language, such as those used in compilers, were modeled as finite state machines. UML state machine diagrams are based on finite state machines.
Data flow diagrams (DFDs) model a system as a set of processes and data flows that connect these processes. It is the notation used in data flow design. UML sequence diagrams resemble DFDs.
CRC cards are a simple requirements elicitation tool. Much of the information collected on CRC cards can also be represented as UML communication diagrams.
Many other classic modeling notations are tied to a certain analysis or design method. We discuss some of them in Chapter 12 in the context of a discussion of design methods. The ones discussed here are relatively method-independent.
In data-intensive systems, modeling the (structure of) the data is an important concern. Until the 1970s, data modeling techniques very much mixed up implementation concerns with concerns arising from the logical structure of the universe of discourse (UoD). For example, the book catalog would be modeled as a 'table' containing 'tuples' ('records') with alphanumeric fields containing the title and author and numeric fields containing the publication year and number of pages.
Entity—relationship modeling (ERM), as pioneered by Chen, is directed at modeling the logical, semantic structure of the UoD, rather than its realization in some database system. Entity—relationship models are depicted in entity—relationship diagrams (ERDs). There are many variants of ERM, which differ in their graphical notations and extensions to Chen's original approach. The basic ingredients of ERM are given in Table 10.1.
Table 10.1. ERM concepts and their meaning
Entity | distinguishable object of some type |
Entity type | type of a set of entities |
Attribute value | piece of information (partially) describing an entity |
Attribute | type of a set of attribute values |
Relationship | association between two or more entities |
An entity is a 'thing' that can be uniquely identified. Entities are usually depicted in an ERD as rectangles. Example entities are:
tangible objects, such as copies of a book, identified by some number i
intangible objects, such as books identified by their ISBN, or members of some organizational construct, such as library employees identified by their employee number.
Entities have properties known as attributes. For example, some library employee may have the name 'Jones'. Here, 'Jones' is the value of the attribute called 'name'. Attributes are usually depicted as circles or ellipses.
Both entities and attribute values have a type. As modelers, we tend to view a type as a set of properties shared by its instances. As implementors, we tend to view a type as a set of values with a number of associated operations. For the attribute 'number of books on loan', the set of values could be 0..10 with operations such as increment and decrement. For the entity type 'book copy', candidate operations would be 'borrow', 'return', and so on.
Entities are linked through relationships. For example, the relationship 'borrow' involves the entities 'book copy' and 'library member'. Most often, a relationship is binary, i.e. it links two entities. A relationship is denoted by a diamond linked to the entities involved.
Entity—relationship models impose restrictions on the cardinality of relationships. In its simplest form, the relationships are 1—1, 1—N, or N—M. The relationship 'borrow' is 1—N: a copy of a book can be borrowed by one member only, while a member may have borrowed more than one book copy. In an ERD, these cardinality constraints are often indicated by small adornments of the arrows linking the entities.
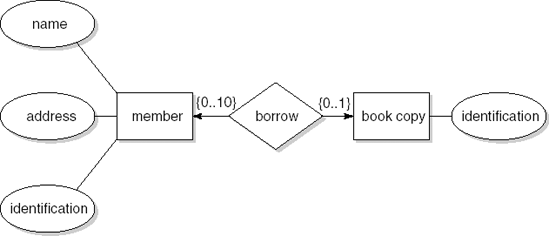
An example entity—relationship diagram is given in Figure 10.1. Cardinality constraints have been indicated by explicitly indicating the set of possibilities. Thus, this ERD states that a book copy can be borrowed by at most one member, and a member may borrow up to ten book copies.
An entity—relationship model can be obtained using any of the elicitation techniques discussed in Chapter 9. In particular, form analysis and analysis of natural language descriptions are often used. Since ERMs tell only part of the story, additional techniques have to be employed to model other aspects. Many structured analysis techniques, for example, incorporate ERM to model the data aspect.
Entity—relationship modeling is a natural outgrowth of database modeling. Originally, ERM was intended to model the logical structure of data, rather than the logical structure of the UoD. In heuristics on how to obtain a 'good' entity—relationship model, these roots are still visible. For example, some of these heuristics resemble normalization constraints from database theory. This may explain why some do not commend entity—relationship modeling as a requirements specification technique (see, e.g., (Davis, 1993)).
Present-day ERM has a lot in common with object-oriented analysis techniques. For example, subtype—supertype relations between entity types are included in many ERM-techniques. Conversely, the class diagram of UML (see Section 10.3.1) includes many elements from ERM.
At any one point in time, our library system is in one of a (vast) number of possible states. The state of the library can be expressed in terms of:
the collection of titles available,
the collection of titles ordered but not yet received,
the collection of library members,
the balance of the account from which acquisitions are paid.
Any action occurring in the library, be it the return of a book or the appointment of a new employee, transforms the current state s into a new state s′.
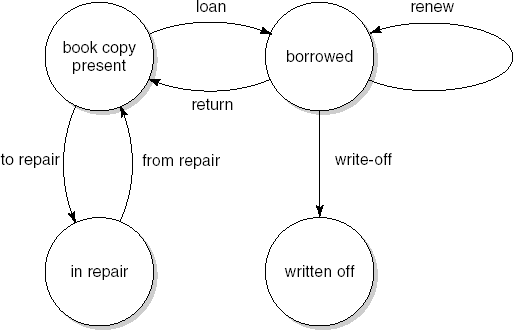
Requirements specification techniques which model a system in terms of states and transitions between states are called state-based modeling techniques. A simple yet powerful formalism for specifying states and state transitions is the finite state machine (FSM). An FSM consists of a finite number of states and a set of transitions from one state to another that occur on input signals from a finite set of possible stimuli. The initial state is a specially designated state from which the machine starts. Usually, one or more states are designated as final states. Pictorially, FSMs are represented as state transition diagrams (STDs). In a state transition diagram, states are represented as bubbles, with a label identifying the state, and transitions are indicated as labeled arcs from one state to another, where the label denotes the stimulus which triggers the transition. Figure 10.2 gives an FSM depicting the possible states of a book copy and the transitions between those states. The final state is the one labeled 'written off'. Any of the others could be designated as the initial state.
Figure 10.2 models only a tiny part of the library system. It does not describe the complete state of the system in any one bubble, nor does it depict all possible state transitions. Modeling a system in one, large, monolithic STD is not to be recommended. Such a structure soon becomes unwieldy and difficult to understand. Though we could model the system in a series of FSMs, we would still have the problem of how to integrate them into one model.
A possible way out is to allow for a hierarchical decomposition of FSMs. This is the essence of a notation known as statecharts. In statecharts, groups of states can be viewed as a single entity at one level, to be refined at the next level of abstraction. In UML, FSMs are modeled as state machine diagrams (Section 10.3.2).
The data flow design method originated in the early 1970s with Yourdon and Constantine. In its simplest form, data flow design is but a functional decomposition with respect to the flow of data. A component (module) is a black box which transforms some input stream into some output stream. The main notation used is that of data flow diagrams (DFDs).
Four types of data entity are distinguished in a data flow diagram:
External entities are the source or destination of a transaction. These entities are located outside the domain considered in the data flow diagram. External entities are indicated as squares.
Processes transform data. Processes are denoted by circles.
Data stores lie between two processes and are places where data structures are stored until needed. They are indicated by the name of the data store between two parallel lines.
Data flows between processes, external entities and data stores are paths along which data structures travel. A data flow is indicated by an arrow.
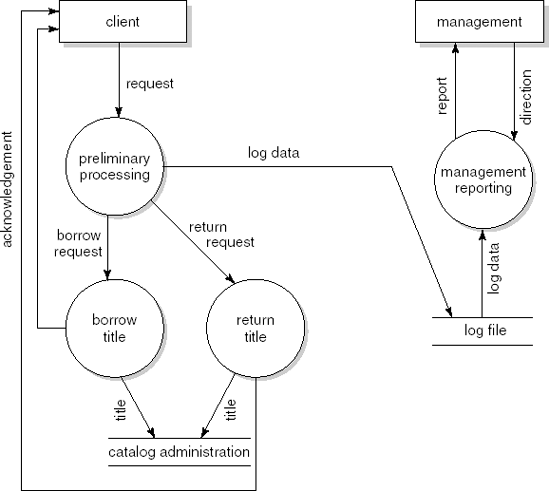
Data flow diagrams result from a top-down decomposition process. The diagram at the highest level has one process only, denoting 'the system'. This top-level diagram is then further decomposed. For our library example, this could lead to the data flow diagram of Figure 10.3. A client request is first analyzed in a process labeled 'preliminary processing'. As a result, one of 'borrow title' or 'return title' is activated. Both these processes update a data store labeled 'catalog administration'. Client requests are logged in a data store 'log file'. This data store is used to produce management reports.
The design method mostly used in conjunction with data flow diagrams is discussed in Section 12.2.2. There, we also give more example data flow diagrams.
CRC stands for Class—Responsibility—Collaborators. A CRC card is simply a 4″×6″ or 5″×7″ index card with three fields labeled Class, Responsibility and Collaborators. CRC cards were developed in response to a need to document collaborative design decisions. CRC cards are especially helpful in the early phases of software development, to help identify components, discuss design issues in multi-disciplinary teams, and specify components informally. CRC cards may be termed a low-tech tool, as opposed to the high-tech tools we commonly use. Yet they are highly useful. They are also fun to work with in our all-too-serious business meetings.
CRC cards are not only used in collaborative design sessions. Within the design pattern community, for instance, they are used to document the elements that participate in a pattern.
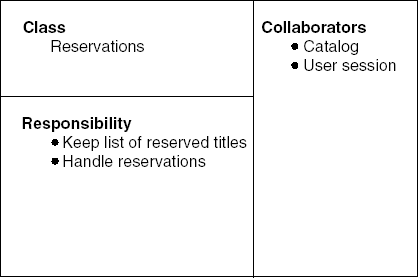
The word 'class' in CRC is a historical relic. CRC cards can be used to describe any design element. We will stick to the original terminology, however. The class name appears in the upper-left corner of the card. A bulleted list of responsibilities appears under the class name and a list of collaborators appears on the right part of the card. Figure 10.4 gives an example of a CRC card for a Reservations component in our library system.
The main responsibilities of this component are to keep an up-to-date list of reservations and to handle reservations on a FIFO basis. Its collaborators are the Catalog and User session components. The types of interaction with these components are shown in Figure 10.13.
What matters is not how closely we model today's reality but how extensible and reusable our software is.
Meyer (1996)
The world around us is full of objects, animate and inanimate, concrete and abstract: trees and tables, cars and legal cases. According to some, analysis and design is about modeling those real-world objects. By and large, this view has its origins in the Scandinavian school of programming language design (SIMULA-67) and software development. It may be termed the European view. According to others, analysis and design is about identifying reusable components and building their inheritance hierarchy. This latter view, which may be termed the American view, clearly shows itself in the above quotation.
What then is an object? As might be expected, there are different views of what the notion of object entails. We may distinguish the following points of view:
The modeling viewpoint: an object is a conceptual model of some part of a real or imaginary world. From this point of view, important characteristics are:
each object has an identity, which distinguishes it from all other objects i
objects have substance: properties that hold and can be discovered by investigating an object.
From a practical point of view, object identity is an immutable tag, or address, which uniquely identifies that object. Different objects occupy different regions of memory. Pragmatically also, objects may be regarded as implementations of abstract data types (ADTs). An object then consists of a mutable state, i.e. the set of variables of the ADT, and operations to modify or inspect the state. Typically, the only way to access an object is through these operations. The operations thus act as an interface to the object. An object then is a collection of three aspects:
object = identity + variables + operations
or
object = identity + state + behavior
The philosophical viewpoint: objects are existential abstractions, as opposed to universal abstractions. In some circles (notably the Smalltalk world), 'everything is an object'. In this view, objects act as a unifying notion underlying all computation. However, one may also argue that there are two rather distinct types of abstraction. Some kinds of entity have a natural beginning and end. They are created at some point in time, exist for a while, and are destroyed. The kinds of entity modeled as objects during analysis and design typically belong to this class. Other kinds of entity, such as numbers, dates, and colors, have 'eternal' existence. They are not instantiated; they cannot be changed; they 'live' forever. These entities are usually referred to as values.
The software engineering viewpoint: objects are data abstractions, encapsulating data as well as operations on those data. This viewpoint stresses locality of information and representation independence; see also Sections 12.1.1 and 12.1.3. However, not all programming languages enforce data abstraction, and objects need not always encapsulate an abstract data type. We might claim that data abstraction and objects are somewhat orthogonal, independent dimensions.
A programming language that merely allows us to encapsulate abstract data types in modules is often termed object-based. The adjective 'object-oriented', then, is reserved for languages that also support inheritance (discussed below).
The implementation viewpoint: an object is a contiguous structure in memory. Technically, an object may be regarded as a record of data and code elements. An object may be composite or aggregate (possessing other objects). Sub-objects may, in turn, possess even 'smaller' sub-objects, and so on. The lowest-level objects in this hierarchy are atomic objects, typically denoting integers, real numbers or Booleans.
The implementation of this 'possessed-by' relation appears to be intricate. On the one hand, objects may be contained in other objects. In this representation, all references are dispensed with. There is no concept of sharing. This scheme is known as value semantics. Value semantics is inadequate for object-oriented systems, since such systems require sharable objects. The opposite scheme is reference semantics: data is represented as either an atomic object or as an aggregate of references to other objects. Pure reference semantics is inefficient in the case of primitive objects such as integers or characters. A combination in which aggregate objects may contain other objects, refer to other objects, or do both at the same time, is commonly used as a storage scheme. The choice of a particular storage model is, to some extent, reflected in the high-level language semantics (for example, where it concerns copying or comparing objects).
The formal viewpoint: an object is a state machine with a finite set of states and a finite set of state functions. These state functions map old states and inputs to new states and outputs.
Formalization of the concepts and constructions of object-oriented languages is difficult. Mathematical formalisms tend to be value-based. Imperative concepts, such as state and sharing, that are central to object-oriented languages do not fit easily within such schemes.
During analysis, the conceptual viewpoint is usually stressed. Those who are of the opinion that analysis and design blend smoothly into one another tend to keep this view during design. Others, however, are of the opinion that analysis and design are different, irrespective of whether they are object-oriented or not. They are likely to stress other viewpoints during design. The definition of an object as given in (Coad and Yourdon, 1991) also reflects the tension between a problem-oriented and a solution-oriented viewpoint: an object is 'an abstraction of something in a problem domain, reflecting the capabilities of a system to keep information about it, interact with it, or both; an encapsulation of Attribute values and their exclusive Services'. We will come back to this dichotomy when discussing object-oriented methods in Section 12.3.
As noted above, objects are characterized by a set of attributes (properties). A table has legs, a table top, size, color, etc. The attribute concept originates with entity—relationship modeling; see Section 10.1.1. In ERM, attributes represent intrinsic properties of entities, properties whose value does not depend on other entities. Attributes denote identifying and descriptive properties, such as name or weight. Relationships on the other hand denote mutual properties, such as an employee being assigned to a project or a book being borrowed by a member. In UML, these relationships are called associations. In UML, the distinction between attributes and relationships formally does not exist. Both are properties of a class. It is considered good practice in UML to model simple properties as attributes and more complex properties as associations.
In the context of object-oriented modeling, the term attribute is sometimes used to denote any field in the underlying data structure. In that case, the object's identity is an attribute, the state denotes the set of 'structural' attributes, and the operations denote the 'behavioral' attributes. We use the term 'attribute' to denote a structural attribute. Collectively, the set of attributes of an object thus constitutes its state. It includes the intrinsic properties, usually represented as values, as well as the mutual properties, usually represented as references to other objects.
At the programming-language level, objects that have the same set of attributes are said to belong to the same class. Individual objects of a class are called instances of that class. So we may have a class Table, with instances MyTable and YourTable. These instances have the same attributes, with possibly different values.
An object not only encapsulates its state, but also its behavior, i.e. the way in which it acts upon other objects and is acted upon by other objects. The behavior of an object is described in terms of services provided by that object. These services are invoked by sending messages from the object that requests the service to the object that is acted upon.
In order for a collection of objects to operate together as intended, each of the objects must be able to rely on the proper operation of the objects with which it interacts. In a client—server view, one object, the client, requests some service from another object, the server. This mutual dependency may be viewed as a contract between the objects involved. The client will not ask more than what is stated in the contract, while the server promises to deliver what is stated in the contract. In this perspective, services are also referred to as responsibilities.
The major behavioral aspect of an object concerns state changes. The state of an object instance is not static, but changes over time: the object instance is created, updated, and eventually destroyed. Also, certain information may be requested from an object. This information may concern the state of the object instance, but it may also involve a computation of some sort.
For example, a customer of a library may have attributes such as Name, Address, and BooksOnLoan. It must be possible to create an instance of the object type Customer. When doing so, suitable values for its attributes must be provided. Once the instance has been created, state changes are possible: books are loaned and returned, the customer changes address, etc. Finally, the instance is destroyed when the customer ceases to be a member. Information requested may concern such things as a list of books on loan or the number of books on loan. The former is part of the state that describes a particular customer and can be retrieved directly from that state. NumberOfBooksOnLoan is a service that requires a computation of some sort, for example counting the number of elements in BooksOnLoan.
We are generally not concerned with individual objects. Our goal is to identify and relate the object types (i.e. classes). We will often use the term object to denote an object type. One of our major concerns during analysis and design is to identify this set of objects, together with their attributes (state) and services (behavior).
Relations between objects can be expressed in a classification structure. The major types of relation depicted in such structures are listed in Table 10.2. If we have objects Table and Chair, we may also define a more general object Furniture. Table and Chairare said to be specializations of Furniture, while Furniture is a generalization of Table and Chair. These relations are also known as 'is-a' relations. The is-a relation is a well-known concept from entity—relationship modeling.
Table 10.2. Major types of relations between objects
Relation | Example |
|---|---|
Specialization—generalization, is-a |
|
Whole—part, has |
|
Member-of, has |
|
The specialization—generalization relations can be expressed in a hierarchical structure such as the one in Figure 10.5. In its most general form, the classification structure is a directed acyclic graph (DAG). Many classification structures can be depicted as a tree, in which each object is a direct descendant of exactly one other object. At the programming-language level, single inheritance corresponds to a tree structure, while multiple inheritance corresponds to a DAG.
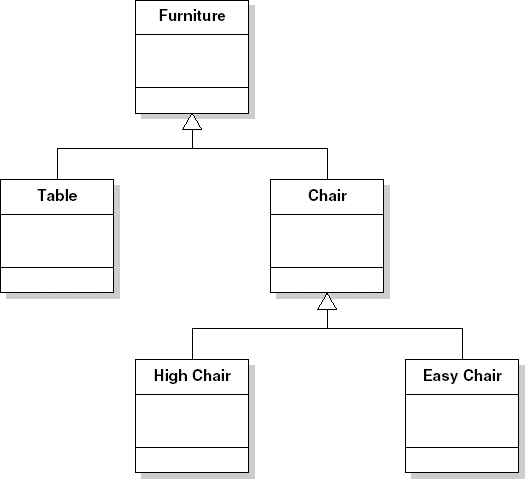
Different objects may share some attributes. Both tables and chairs have a height, for instance. Rather than defining the full set of attributes for each object, we may define common attributes at a higher level in the object hierarchy and let descendants inherit those attributes. We may therefore define the attribute Height at the level of Furniture rather than at the level of each of its descendants. Obviously, this is just another way of looking at the object hierarchy. The fact that Chair and Table are both descendants of Furniture already suggests that they share certain properties, properties that are common to the various types of furniture. The fact that they are different descendants of Furniture also suggests that they each have unique properties.
Alternatively, we may view the object hierarchy as a type hierarchy. Chair and Table are subtypes of Furniture, in the same way as Cardinal is a subtype of Integer. In this view, an object is a restriction of the objects of which it is a specialization. Each chair is a piece of furniture but the reverse is not true.
By explicitly relating objects in the object hierarchy, a much tighter semantic binding between related objects is realized than is possible in more traditional design approaches. In a functional decomposition of our library automation problem for example, there is virtually no way to make the similarities between books and journals explicit in the design. In an object-oriented design, objects Bookand Journal can be made descendants of a more general object Publication and attributes such as Publisher can be inherited from this more general type of object.
The is-a relation is one way to organize (object) types into a hierarchy. The part-of relation is another major organizational property of object types. A Table 'has' a TableTop and Legs. A Publication 'has' a TitleDescription and a Publisher. This part-of relation aggregates components into a 'whole'. It describes how compound things are made up of simpler things. By definition, the compound is at a higher level of abstraction than its components.
An object such as TableTop is made up of attributes, for example Color, Width and Length. At the next level, objects such as TableTop and Legs are assembled into a higher-level object, viz. Table. At that level, we may introduce additional attributes, such as Size, so that Table may also be seen as an aggregate of the first kind. In general, a compound object consists of a number of (references to) other objects and a number of 'simple' attributes, i.e. values.
In the case of Table, the part-of relation is a real-world part-of relation. In the case of Publication, Publisher does not correspond to some part of the underlying real-world object. It merely is part of the representation of the object Publication. Sometimes, an explicit distinction is made between the real-world part-of relation and the representational part-of (or component-of) relation. In UML, they are called composition and aggregation, respectively.
In many modeling methods, the part-of relation subsumes the member-of relation. The member-of relation is used to model the relationship between a set and its members. It is, however, sometimes useful to be able to distinguish between these organizational properties. For example, the part-of relation is generally considered to be transitive, whereas the member-of relation is not. If Book is a member of Library and Libraryis a member of PublicInstitutions, we do not want to infer that Book is a member of PublicInstitutions.
The Unified Modeling Language has its roots in the object-oriented analysis and design methods of the 1980s. Several key players in this field (Grady Booch, John Rumbaugh and Ivar Jacobson) joined Rational and started to unify their methods and notations. This resulted in the first versions of UML. At a later stage, the Object Management Group (OMG), an open consortium of companies, took over. OMG now controls the activities around UML and has adopted it as one of its standards. UML is by far the most widely used notation for both requirements engineering and design. The current version is known as UML 2.
The 13 diagrams of UML 2 are listed in Table 10.3. Some diagrams, such as the class diagram and the state machine diagram, have been there since the beginning of object orientation. Others are more recent. For example, the composite structure diagram and the timing diagram were introduced in UML 2. The class diagram is the diagram most often used (75%), followed by the use-case diagram and the communication diagram (50%) (Dobing and Parsons, 2006). People usually do not adhere all that strictly to the semantics of the language (Lange et al., 2006). Some of the diagrams give a static view. For instance, a class diagram shows the static structure of a system. Other diagrams give a dynamic, or behavioral view, i.e. they show what happens when the system is executed. For instance, a sequence diagram shows which messages are exchanged between instances of classes. In Table 10.3, static diagrams are marked with an S and dynamic diagrams are marked with a D. In the following subsections, we discuss the most important UML diagrams.
Table 10.3. UML 2 diagram types
Description | |
|---|---|
Activity (D) | To model business processes, workflow, procedural logic. Similar to a flowchart but supports parallelism, as in a Petri net |
Class (S) | To model classes, their features and relationships (see Section 10.3.1) |
Communication (D) | To model the flow of messages between instances of classes. Very similar to the sequence diagram (see Section 10.3.4) |
Component (S) | To model a set of components and their interrelationships, through interfaces (see Section 10.3.5) |
Composite structure (D) | To model the internal dynamic structure of a class |
Deployment (S) | To model the physical layout, i.e. the assignment of system elements to hardware elements |
Interaction overview (S) | Combines activity diagrams and sequence diagrams |
Object (S) | To model objects and their relationships at some point in time; also known as instance diagram |
Package (S) | To model the grouping of elements into packages |
Sequence (D) | To model the order in which messages are exchanged between instances of classes (see Section 10.3.3) |
State machine (D) | To model the states in which an object can be and the transition between states (see Section 10.3.2) |
Timing (D) | To model state changes of an object over time |
Use case (D) | To model use cases (see Section 10.3.6) |
Class diagrams depict the static structure of a system. A class diagram is a graph in which the nodes are objects (classes) and the edges are relationships between objects. By decorating the edges, many kinds of relationship can be modeled. These relationships fall into two groups: generalizations and associations.
The most common example of a generalization class diagram depicts the subclass—superclass hierarchy. Figure 10.5 is an example of such a class diagram. The classes are denoted by rectangles that have three compartments. These compartments contain, from top to bottom:
the name of the class,
the list of attributes of the class, and
the list of operations of the class.
UML allows for quite some variety in its notation. We may for instance depict a class as a rectangle with one compartment only, just giving the name of the class. Adding slightly more detail, we may depict a class as a rectangle having two compartments, where the second one characterizes the responsibilities of that class, i.e., what it is supposed to do, as kind of an inline comment. Figure 10.6 gives the three-compartment representation in which a number of analysis-level details have been added. We may even extend the notation further and add implementation-level details, such as whether attributes and operations are public or private. We may think of these different representations as different views of the same model element. We may envision tool support that allows the user to switch from one representation to another, suppressing or adding detail as the need arises.
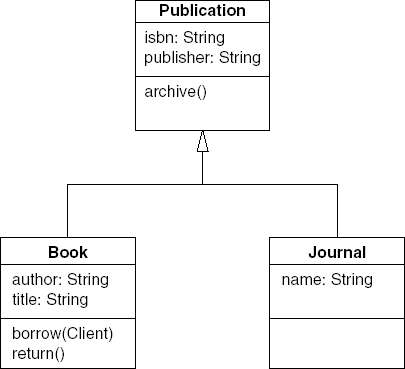
The hollow triangle in Figure 10.6 indicates that the structure is a specialization—generalization structure. Generalization is shown as a solid path from the more specific element (such as Book) to the more general element (Publication), with a large hollow triangle at the end of the path. A group of generalization paths may be shown as a tree with a shared segment, as in Figure 10.6.
The attributes of a class denote properties of that class. For example, publisher is a property of Publication. Next to attributes, UML has another way of denoting properties of a class, viz. associations. A UML association is depicted as a solid line connecting two classes. This line may be adorned with a variety of glyphs and textual information to provide further specifics of the relationship. A simple association between a library and its clients is depicted in Figure 10.7a. The (optional) name of the association is printed near the path. The solid triangle indicates the direction in which the verb is to be read. Note that associations are bi-directional: a client is a member of a library and a library has members. Further adornments can be added to indicate properties of the association. In Figure 10.7a we have added multiplicity information: a client can be a member of one or more libraries, while a library may have zero or more clients.
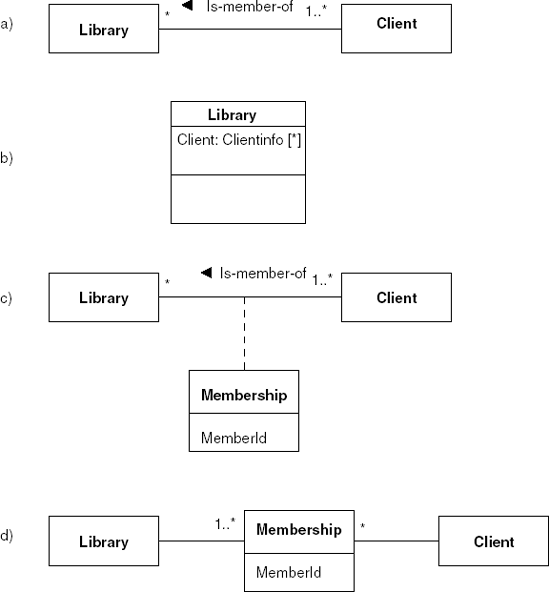
Figure 10.7. UML class diagram: (a) association, (b) association as attribute, (c) association class, (d) association class as a full class
Strictly speaking, there is no difference between an attribute and an association. In Figure 10.7b, we have depicted Client as an attribute of Library. Usually, simple properties such as numbers and dates are modeled as attributes, while more significant concepts are modeled as associations.
An association such as Member-of also has class properties. For example, this association has attributes, e.g.MemberId, and operations, such as BecomeMember and CeaseToBeMember. Alternatively, we may say that class Membershiphas association properties. In UML, this model element is termed an association class. It can be depicted as a class symbol attached by a dashed line to an association path, as in Figure 10.7c. We may even promote an association class to a full class, as in Figure 10.7d. Notice that the multiplicities have moved. A membership (of a client) can be to one or more libraries, whereas the membership (of the library) relates to zero or more clients.
The part-of relationship is called aggregation or composition in UML. In an aggregation, objects can be part of more than one other object. For example, if our library maintains lists of required reading for certain courses, then a given book may be a part of more than one required reading list. Aggregation is denoted by an open diamond as an association role adornment. Composition is a strong notion of aggregation, in which the part object may belong to only one whole object. With composition, the parts are expected to live and die with the whole. If a table is composed of four legs and a tabletop, the table owns these parts. They cannot be part of another table at the same time. Composition is denoted by a solid filled diamond as an association role adornment, as in Figure 10.8a, which shows a Book with parts title, author, and isbn. A book has one title and one ISBN, so these parts have multiplicity 1. We assume here that a book may have up to three authors, so that part has multiplicity of 1..3. At the whole end of composition, the multiplicity is either 1 or 0..1. This part-of relationship is a relationship between a class and the classes of its attributes. An alternative notation for this part-of relation therefore consists of the top two compartments of the diagram for a class, as in Figure 10.8b.
Next to generalization and association, there are many other ways in which elements of a class diagram may depend on each other. For example, one class may call operations from another class, create instances of another class, and so on. Such dependencies are depicted with a dashed arrow, labeled with the type of dependency. If all dependencies are included in a class diagram, it soon becomes very cluttered. So it is wise to include only important dependencies. Many types of dependency need not be modeled by hand, but can be derived from the source code, and tools exist to do so.
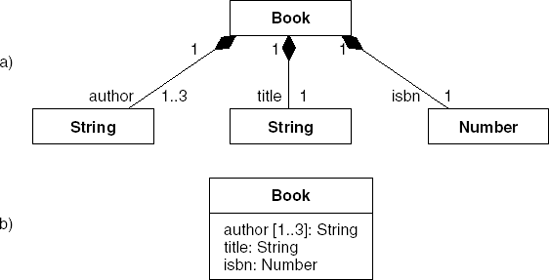
Figure 10.8. UML class diagram: composition as (a) association role adornment and (b) a simple class diagram
An abstract class is a class that cannot be instantiated directly. Only its (concrete) clients can. Abstract classes typically occur in hierarchies of data types. For instance, we may have an abstract class List, with subclasses such as LinkedList and ArrayList. The abstract class List may have abstract operations, such as get, that can only be made concrete at the subclass level. At the level of List, we then merely state that each of its subclasses will provide an implementation of get. In our library example, we could have designated Publication as an abstract class. Abstract classes are indicated by printing their name in italics.
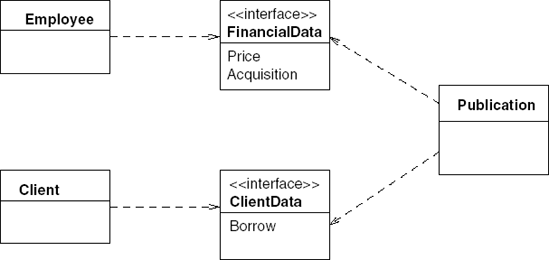
An interface is a class all of whose features are abstract. It has no implementation. Interfaces are a useful means of splitting the set of properties of a class into subsets, in case other classes only need access to subsets of those properties. For instance, class Publication may have properties that are accessible to customers of the library, as well as properties that are for internal use only, such as its price, who authorized acquisition, and so on. We may then define two interfaces to Publication that are made available to other classes in the system. Publicationthen provides different interfaces to different client classes, who in turn require the interface. Interfaces are marked with the keyword ≪interface≫, as in Figure 10.9. Interfaces are often used to increase the robustness of a model, by restricting access to only the properties really needed.
A major class of services provided by an object relates to the object's life cycle: an object instance is created, updated zero or more times, and finally destroyed. State transition diagrams, which depict the possible states of an object and the transitions between those states, are a good help in modeling this life cycle.
Usually, the finite state machine model and its associated state transition diagram (see Section 10.1.2) are extended in several ways when used in modeling the behavior of objects over time:
In the classical finite state machine model, states do not have local variables. All necessary information is coded in the state. This easily leads to unwieldy models. For instance, suppose we want to model an object
LibraryMemberas follows: a person may become a member of the library, borrow up to ten books, and cease to be a member of the library. This leads to a finite state machine with states such ashas-borrowed-0-books,has-borrowed-1-book,has-borrowed-2-books, ...,has-borrowed-10-books. If the number of books on loan are modeled as a local variable, the number of states in the model would be reduced from 12 to 2.For this reason, the finite state machine is usually extended by adding local variables to the model. A state in this extended finite state machine then comprises both the explicit state represented by a node in the state transition diagram and the value of the model's variables.
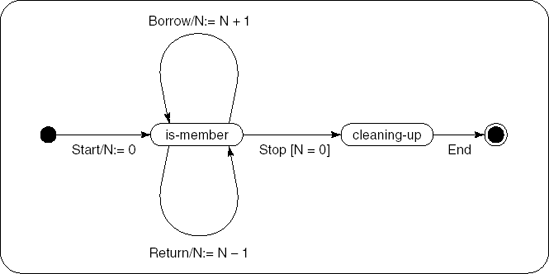
These local variables are not only used to decrease the number of states. State transitions may now also change the values of variables; the variables may be tested to determine the next state and transitions may be guarded by the value of the variables. In Figure 10.10, the number of books on loan is kept in the local variable N. This variable is initialized to zero, updated when a book is borrowed or returned, and tested when a person terminates his membership.
The components being modeled interact with the environment: there are input events and output actions. In all modeling methods that we know of, input events trigger transitions. When a person becomes a member of the library, this triggers the initial transition; when she borrows a book, it triggers a transition from a state, say,
has-borrowed-7-booksto a statehas-borrowed-8-books. If the model has local variables, the latter state transition may result in a change in the value of such a local variable. In Figure 10.10, the input events are denoted as strings that label state transitions (such asStartandBorrow).Different modeling methods have different ways to handle output actions. Sometimes, output actions are associated with a transition (this is known as a Mealy machine), sometimes output actions are associated with a state (a Moore machine). In the latter case, the output action is carried out as soon as the state is entered. In a formal sense, Mealy machines and Moore machines have the same expressive power.
Finite state diagrams may become unwieldy. Therefore, one may add some structure, through a hierarchy. Part of the model may be compressed into one state. If we are interested in the details of a state, we may 'zoom in' on that state.
Many modeling methods, including UML, depict the sequence of states that an object goes through in a variant of the statechart. Statecharts are extended finite state machines (i.e. they have local variables) in which output actions may be associated with both transitions and states and in which states can be arranged hierarchically. In UML, this type of diagram is called a state machine diagram. As with class diagrams, UML has a rich notation for state machine diagrams. We will illustrate the major ingredients through a few examples (see also Figures 10.10 and 10.11).
A state is some condition in the life of an object. It is shown as a rectangle with rounded corners. An initial (pseudo) state is shown as a small filled circle. This initial state is a mere notational device; an object can not be in such a state. It indicates the transition to the first 'real' state. A final (pseudo) state is shown as a circle surrounding a small filled circle. This final state is also a notational device. A transition is shown as a solid arrow from one state to another. When a change of state occurs, that transition is said to 'fire'. A transition has a label that comes in three parts. The general form is trigger-signature [guard]/activity. All three parts are optional. The trigger-signature denotes the event which triggers the transaction, such as the borrowing of a book. The event may be guarded by a Boolean expression. For example, the transition from state is-member to cleaning-up in Figure 10.10 is guarded by the expression 'N = 0': it can only occur if the number of books on loan is zero. When an event occurs, only one transition can be taken. So if multiple transitions occur with the same event, the guards must be mutually exclusive. The transition label may include a procedural expression after the symbol '/'. This procedural expression is executed when the transition fires.
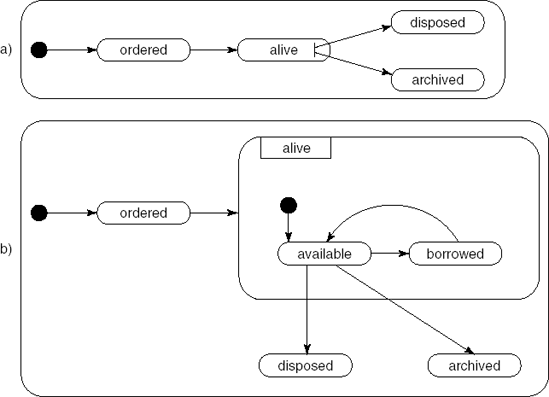
Figure 10.11 gives an example of nested states. Figure 10.11a gives a global view of the life cycle of an object Book: a book is ordered, stays alive for a while, and is eventually either disposed of or archived. In Figure 10.11b, state alive is expanded to show its finer structure. In this example, the state is refined into mutually exclusive disjoint substates: a book is either available or borrowed.[9] The transition from state ordered to state alive is drawn to the boundary of state alive. This is equivalent to a transition to the initial state within the graphics region of alive. The transition from the nested state available to states disposed and archived is made directly. To indicate this transition from a suppressed internal state of alive to disposed and archived in Figure 10.11a, the transitions are not drawn from the boundary of alive, but from a so-called stub, shown as a small vertical line drawn inside its boundary.
Objects communicate by sending messages. To carry out a certain task, a particular sequence of messages may have to be exchanged between two or more objects. The time ordering in which this sequence of messages has to occur may be depicted in a sequence diagram. A sequence diagram is one type of interaction diagram. A second type of interaction diagram is the communication diagram, discussed in Section 10.3.4. In the telecommunications domain, sequence diagrams are known as message sequence charts; they provide a standard notation for designing and specifying protocols. The sequence diagram is also used in the design pattern community, to graphically depict the interaction between two or more objects participating in a design pattern.
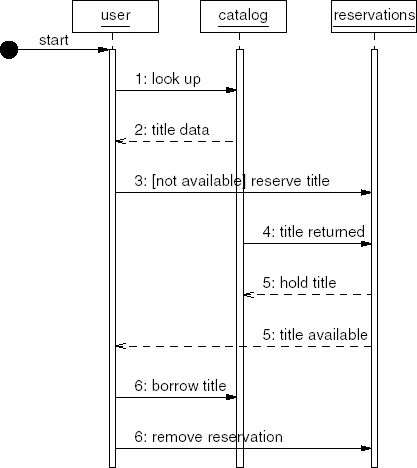
In a sequence diagram, the horizontal dimension shows the various objects that participate in the interaction. An object is shown as a vertical dashed line, its 'lifeline'. The period in which the object is active (within the particular sequence of messages depicted) is shown as a thin rectangle. If the distinction between active and inactive is not important, the entire lifeline may be shown as an activation, as in Figure 10.12. The ordering in which the objects are shown carries no meaning.
The vertical dimension denotes the time sequencing of messages. Usually, only the order in which messages are displayed carries meaning. For real-time applications, the time axis may show actual numerical values.
Messages are shown as labeled arcs from one object to another. The vertical arrangement of messages indicates their order. The labels may also contain sequence numbers, which are particularly useful to indicate concurrency. A message may also be labeled with a guard, a Boolean expression that states the condition which must hold for the message to be sent.
Figure 10.12 shows a possible sequence of interactions between a user, a catalog of available books, and an object which handles reservations. The first message comes from an outside, unknown source. This message is called the found message. The user then sends a request to the catalog to look up a certain title. The catalog reacts by sending data about that title to the user. If the title is not available (this is indicated by a Boolean expression, the guard, within square brackets), a request to reserve that title is sent to the object that handles reservations. Some time later, that title will become available again and reservations will be notified. The object reservations will then send a message to the catalog to hold that book and will notify the user that the title is now available. The ordering of those two messages is irrelevant, so they carry the same sequence number. The user may now borrow the title and the corresponding reservation will be removed.
Again, UML has a rich notational vocabulary for sequence diagrams. It is possible to distinguish asynchronous message-passing from synchronous message-passing, to indicate iteration, to show the creation and destruction of objects, and so on. The main purpose of the sequence diagram however remains the same: an easy-to-read overview of the passing of messages in a particular interaction sequence.
The communication diagram is another way to show one possible scenario for the interaction between a number of related objects. A communication diagram is a directed graph where the nodes denote entities and the edges denote communication between those entities.
Figure 10.13 shows the same sequence of interactions as the scenario depicted in the sequence diagram in Figure 10.12. Communication diagrams emphasize the objects and their relationships relevant to a particular interaction. To provide more detail about the interaction, relevant attributes may be shown inside the nodes (by adding another compartment, as in a class diagram) and these attributes may also be incorporated in the labels of the edges.
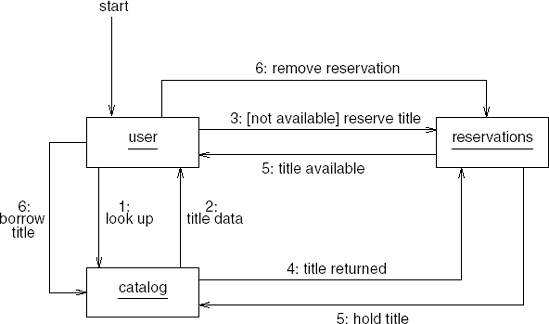
Sequence diagrams emphasize the ordering of messages and sequence numbers are optional; in a communication diagram, sequence numbers are mandatory since the ordering does not show itself graphically.
When designing larger systems, it may be useful to be able to identify entities larger than a single class. This can be done in a component diagram. In software architecture descriptions, for instance, the component diagram is a good way to depict a module view of a system (see Section 11.3).
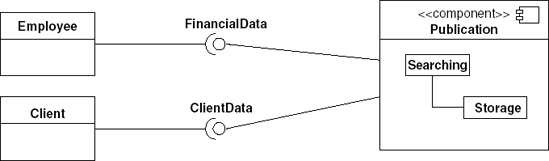
In essence, a component diagram is a class diagram with the stereotype <<component>>. In UML 1, the component diagram had a special form. In UML 2, this form is often depicted as a small component icon inside the component, as in Figure 10.14. Other than this icon, the component diagram does not introduce any new notation.
Components contain classes or other components. In Figure 10.14 we have modeled Publication as a component containing two classes, called Searching and Storage. Components are connected by interfaces. Figure 10.14 uses the 'ball-and-socket' notation to depict interfaces. Both this notation and the one used in Figure 10.9 are allowed in both class diagrams and component diagrams.
One possible requirements elicitation technique is scenario-based analysis; see also Chapter 9. A scenario is a story which tells how a specific task instance is executed. Often, different scenarios are variations on the same theme. For instance, one scenario may describe the ordinary borrowing of a book, another one may describe borrowing a book when there are still outstanding fines, and so on. A set of scenarios having the same user goal, in this case borrowing, is called a use case.
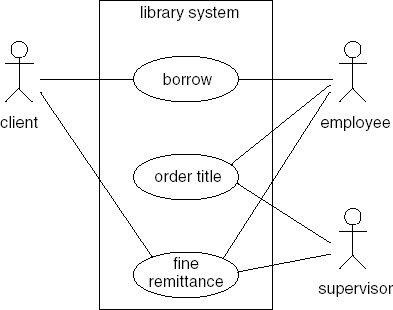
A use case can be documented in various ways: as narrative text, formally using pre- and postconditions, for example, or graphically as in a state transition diagram. The use-case diagram provides an overview of a set of use cases. Each use case is shown as an ellipse with the name of the use case. The use cases are enclosed by a rectangle denoting the system boundary. An actor that initiates or participates in a scenario is shown as a stick figure with the name of the actor below. Figure 10.15 shows part of the use-case diagram for our library system. Borrowing a book involves two actors: a client and an employee of the library. Many other use cases will involve those two actors as well. The ordering of a new book needs approval of a supervisor, as does the remittance of a fine.
During requirements engineering and design, a variety of modeling notations are applied. Most of these use some sort of box-and-line diagram. The mainstream modeling notations of today stem from the Unified Modeling Language (UML). Many UML diagrams are based on or derived from earlier types of diagram. In this chapter, we discussed a selection of classic modeling notations as well as the major UML diagram types.
The classic modeling notations discussed are:
entity-relationship modeling (ERM), used to model the structure of data,
finite state machines (FSMs), used to model states and state transitions of a system,
data flow diagrams (DFDs), used to model functional decomposition with respect to data,
CRC Cards, a simple notation to document collaborative design decisions.
UML evolved from earlier object-oriented analysis and design methods. Concepts used in UML, such as object, attribute, class, and relationship, originate in the field of object orientation. UML 2 offers 13 diagram types that fall into two classes. Some diagrams give a static view of the system. For instance, a class diagram shows how a system is statically organized into classes. Other diagrams give a dynamic view. For instance, a sequence diagram shows the time ordering of message exchanges between instance of classes.
Entity-relationship modeling was pioneered by Chen (1976). Many texts on database modeling include an elaborate discussion of ERM; see, for example, (Batini et al., 1992). Statecharts are described in (Harel, 1988). CRC cards are described in (Beck and Cunningham, 1989).
The different views of the notion of object are discussed in (Taivalsaari, 1993). The various meanings of attribute and related notions such as aggregate, part and member are discussed in (Motschnig-Pitrik, 1996). Wegner (1992) is a classic paper on the various dimensions of object-oriented modeling.
Fowler (2004) provides a good introduction to UML. UML is extensively discussed in two books by its creators, (Booch et al., 1999) and (Rumbaugh et al., 1999). Actual usage of UML is reported in (Dobing and Parsons, 2006), (Lange et al., 2006) and (Grossman et al., 2005).
Explain the following concepts from entity—relationship modeling: entity, entity type, attribute value, attribute, relationship.
Define the following terms: object, state, attribute, message, and inheritance.
Explain the difference between the specialization—generalization relation and the whole—part relation.
Explain the difference between a class diagram and a state machine diagram.
Explain the difference between a sequence diagram and a communication diagram.
Explain the difference between a class diagram and a component diagram.
What are CRC cards and use-case scenarios used for in object-oriented analysis and design?
In what respects does a UML state diagram differ from a state transition diagram?

[9] UML also allows you to refine a state into concurrent substates. For example, when a book is returned, several things have to be done. It has to be checked whether the book is returned within the fixed time. If not, some fine may be due. Possible outstanding reservations need to be checked as well and, if so, one of these reservations must be handled. These subprocesses can be handled concurrently. There can be a state returning book which, when refined, results in two or more concurrent, and-related substates. This is shown by tiling the graphics region of the state using dashed lines to separate subregions.