
7
THE TOP-DOWN METHOD
So if you’re bullish on Materials, how much of your portfolio should you put in Materials stocks? Twenty-five percent? Fifty? One hundred percent? This question concerns portfolio management. Most investors concern themselves only with individual companies (“I like US Steel, so I’ll buy some”), without considering how it fits into their overall portfolio. But this is no way to manage your money.
In this part of the book, we show you how to analyze Materials companies like a top-down portfolio manager. This includes a full description of the top-down method, how to use benchmarks, and how the top-down method applies to the Materials sector. We then delve into security analysis in Chapter 8, where we provide a framework for analyzing any company, and discuss many of the important questions to ask when analyzing Materials companies. Finally, in Chapter 9, we conclude by giving a few examples of specific investing strategies for the Materials sector.
INVESTING IS A SCIENCE
Too many investors today think investing has “rules”—that all one must do to succeed in investing for the long run is find the right set of investing rules. But that simply doesn’t work. Why? All well-known and widely discussed information is already reflected in stock prices. This is a basic tenet of market theory and commonly referred to as “market efficiency.” So if you see a headline about a stock you follow, there’s no use trading on that information—it’s already priced in. You missed the move.
If everything known is already discounted in prices, the only way to consistently beat the market is to know something others don’t. Think about it: There are many intelligent investors and longtime professionals who fail to beat the market year after year, most with the same access to information as anyone, if not more. Why?
Most view investing as a craft. They think, “If I learn the craft of value investing and all its rules, then I can be a successful investor using that method.” But that simply can’t work because by definition, all the conventional ways of thinking about value investing will already be widely known and thus priced in. In fact, most investment styles are very well-known and already widely practiced. There are undoubtedly millions of investors out there much like you, looking at the same metrics and information you are. So there isn’t much power in them. Even the investing techniques themselves are widely known—taught to millions in universities and practiced by hundreds of thousands of professionals globally. There’s no edge.
Moreover, it’s been demonstrated investment styles move in and out of favor over time—no one style or category is inherently better than another in the long run. You may think “value” investing works wonders to beat markets, but the fact is growth stocks will trounce value at times.
The key to beating stock markets lies in being dynamic—never adhering for all time to a single investment idea—and gleaning information the market hasn’t yet priced in. In other words, you cannot adhere to a single set of “rules” and hope to outperform markets over time.
So how can you beat the markets? By thinking of investing as a science.
Einstein’s Brain and the Stock Market
If he weren’t so busy becoming the most renowned scientist of the twentieth century, Albert Einstein would have made a killing on Wall Street—but not because he had such a high IQ. Granted, he was immensely intelligent, but a high IQ alone does not make a market guru. (If it did, MIT professors would be making millions managing money instead of teaching.) Instead, it’s the style of his thought and the method of his work that matter.
In the little we know about Einstein’s investment track record, he didn’t do very well. He lost most of his Nobel Prize money in bad bond ventures.1 Heck, Sir Isaac Newton may have given us the three laws of motion, but even his talents didn’t extend to investing. He lost his shirt in the South Sea Bubble of the early 1700s, explaining later, “I can calculate the movement of the stars, but not the madness of men.”2
So why believe Einstein would have been a great portfolio manager if he put his mind to it? In short, Einstein was a true and highly creative scientist. He didn’t take the acknowledged rules of physics as such—he used prior knowledge, logic, and creativity combined with the rigors of verifiable, testable scientific method to create an entirely new view of the cosmos. In other words, he was dynamic and gleaned knowledge others didn’t have. Investors should do the same. (Not to worry, you won’t need advanced calculus to do it.)
Einstein’s unique character gave him an edge—he truly had a mind made to beat markets. Scientists have studied his work, his speeches, his letters, even his brain (literally) to find the secret of his intellect. In all, his approach to information processing and idea generation, his willingness to go against the grain of the establishment, and his relentless pursuit of answers to questions no one else was asking ultimately made him a genius.
Both his contemporaries and most biographers agree one of Einstein’s foremost gifts was his ability to discern “the big picture.” Unlike many scientists who could easily drown themselves in data minutiae, Einstein had an ability to see above the fray. Another way to say this is he could take the same information everyone else at his time was looking at and interpret it differently, yet correctly. He accomplished this using his talent for extracting the most important data from what he studied and linking them together in innovative ways no one else could.
Einstein called this “combinatory play.” Similar to a child experimenting with a new Lego set, Einstein would combine and recombine seemingly unrelated ideas, concepts, and images to produce new, original discoveries. In the end, most all new ideas are merely the combination of existing ones in one form or another. Take E = mc2: Einstein was not the first to discover the concepts of energy, mass, or the speed of light; rather, he combined these concepts in a novel way, and in the process, altered the way in which we view the universe.3
Einstein’s combinatory play is a terrific metaphor for stock investing. To be a successful market strategist, you must be able to extract the most important data from all of the “noise” permeating today’s markets and generate conclusions the market hasn’t yet appreciated. Central to this task is your ability to link data together in unique ways and produce new insights and themes for your portfolio in the process.
Einstein learned science basics just like his peers. But once he had those mastered, he directed his brain to challenging prior assumptions and inventing entirely different lenses to look through.
This is why this book isn’t intended to give you a “silver bullet” for picking the right Materials stocks. The fact is the “right” Materials stocks will be different in different times and situations. You don’t have to be Einstein, you just should think differently—and like a scientist—if you want to beat markets.
THE TOP-DOWN METHOD
Overwhelmingly, investment professionals today do what can broadly be labeled “bottom-up” investing. Their emphasis is on stock selection. A typical bottom-up investor researches an assortment of companies and attempts to pick those with the greatest likelihood of outperforming the market based on individual merits. The selected securities are cobbled together to form a portfolio, and factors like country and economic sector exposure are purely residuals of security selection, not planned decisions.
“Top-down” investing reverses the order. A top-down investor first analyzes big picture factors like economics, politics, and sentiment to forecast which investment categories are most likely to outperform the market. Only then does a top-down investor begin looking at individual securities. Top-down investing is inevitably more concerned with a portfolio’s aggregate exposure to investment categories than with any individual security. Thus, top-down is an inherently dynamic mode of investment because investment strategies are based upon the prevailing market and economic environment (which changes often).
There’s significant debate in the investment community as to which approach is superior. This book’s goal is not to reject bottom-up investing—there are indeed investors who’ve successfully utilized bottom-up approaches. Rather, the goal is to introduce a comprehensive and flexible methodology that any investor could use to build a portfolio designed to beat the global stock market in any investment environment. It’s a framework for gleaning new insights and making good on information not already reflected in stock prices.
Before we describe the method, let’s explore several key reasons why a top-down approach is advantageous:
• Scalability: A bottom-up process is akin to looking for needles in a haystack. A top-down process is akin to seeking the haystacks with the highest concentration of needles. Globally, there are nearly 25,000 publicly traded stocks. Even the largest institutions with the greatest research resources cannot hope to adequately examine all these companies. Smaller institutions and individual investors must prioritize where to focus their limited resources. Unlike a bottom-up process, a top-down process makes this gargantuan task manageable by determining, upfront, what slices of the market to examine at the security level.
• Enhanced stock selection: Well-designed top-down processes generate insights that can greatly enhance stock selection. Macroeconomic or political analysis, for instance, can help determine what types of strategic attributes will face head- or tailwinds (see Chapter 8 for a full explanation).
• Risk control: Bottom-up processes are highly subject to unintended risk concentrations. Top-down processes are inherently better suited to manage risk exposures throughout the investment process.
• Macro overview: Top-down processes are more conducive to avoiding macro-driven calamities like the bursting of the Japan bubble in the 1990s, the Technology bubble in 2000, or the bear market of 2000 to 2002. No matter how good an individual company may be, it is still beholden to sector, regional, and broad market factors. In fact, there is evidence “macro” factors can largely determine a stock’s performance regardless of individual merit.
Top-Down Means Thinking 70-20-10
A top-down investment process also helps focus on what’s most important to investment results: asset allocation and sub-asset allocation decisions. Many investors focus most of their attention on security-level portfolio decisions, like picking individual stocks they think will perform well. However, studies have shown that over 90 percent of return variability is derived from asset allocation decisions, not market timing or stock selection.4
Our research shows about 70 percent of return variability is derived from asset allocation, 20 percent from sub-asset allocation (such as country, sector, size, and style), and 10 percent from security selection. While security selection can make a significant difference over time, higher -level portfolio decisions dominate investment results more often than not.
The balance of this chapter defines the various steps in the top-down method, specifically as they relate to making country, sector, and style decisions. This same basic framework can be applied to portfolios to make allocations within sectors. At the end of the chapter, we detail how this framework can be applied to the Materials sector.
Benchmarks
A key part of the top-down model is using benchmarks. A benchmark is typically a broad-based index of securities such as the S&P 500, MSCI World, or Russell 2000. Benchmarks are indispensible road maps for structuring a portfolio, monitoring risk, and judging performance over time.
Tactically, a portfolio should be structured to maximize the probability of consistently beating the benchmark. This is inherently different than maximizing returns. Unlike aiming to achieve some fixed rate of return each year, which will cause disappointment relative to peers when capital markets are very strong and is potentially unrealistic when the capital markets are very weak, a properly benchmarked portfolio provides a realistic guide for dealing with uncertain market conditions.
Portfolio construction begins by evaluating the characteristics of the chosen benchmark: sector weights, country weights, and market cap and valuations. Then an expected risk and return is assigned to each of these segments (based on portfolio drivers), and the most attractive areas are overweighted, while the least attractive are under-weighted. Table 7.1 shows MSCI World benchmark sector characteristics as of December 31, 2007 as an example, while shows country characteristics, and Table 7.3 shows market cap and valuations. Table 7.2
Table 7.1 MSCI World Characteristics: Sectors
Source: Thomson Datastream; MSCI, Inc.5 as of 12/31/07.
| Sector | Weight (%) |
|---|---|
| Financials | 22.6 |
| Industrials | 11.4 |
| Information Technology | 11.0 |
| Energy | 10.9 |
| Consumer Discretionary | 9.8 |
| Consumer Staples | 8.8 |
| Health Care | 8.7 |
| Materials | 7.2 |
| Telecommunication | 4.9 |
| Utilities | 4.7 |
Table 7.2 MSCI World Characteristics: Countries
Source: Thomson Datastream; MSCI, Inc.6 as of 12/31/07.
| Country | Weight (%) |
|---|---|
| US | 47.1 |
| UK | 10.8 |
| Japan | 9.7 |
| France | 5.2 |
| Germany | 4.6 |
| Canada | 4.1 |
| Switzerland | 3.3 |
| Australia | 3.2 |
| Spain | 2.1 |
| Italy | 1.9 |
| Netherlands | 1.4 |
| Hong Kong | 1.2 |
| Sweden | 1.1 |
| Finland | 0.9 |
| Belgium | 0.6 |
| Singapore | 0.5 |
| Norway | 0.5 |
| Denmark | 0.5 |
| Greece | 0.4 |
| Ireland | 0.3 |
| Austria | 0.3 |
| Portugal | 0.2 |
| New Zealand | 0.1 |
| Emerging Markets | 0.0 |
Based on benchmark characteristics, portfolio drivers are then used to determine country, sector, and style decisions for the portfolio. For example, in Table 7.1 the Financials sector weight of the MSCI World Index is about 23 percent. Therefore, a portfolio managed against this benchmark would consider a 23 percent weight in Financials “neutral,” or market-weighted. If you believe Financials will perform better than the market in the foreseeable future, then you would “overweight” the sector, or hold more than 23 percent of your portfolio in Financials stocks. The reverse is true for an “underweight”—you’d hold less than 23 percent in Financials if you were pessimistic on the sector looking ahead.
Table 7.3 MSCI World Characteristics: Market Cap and Valuations
Source: Thomson Datastream; MSCI, Inc.7 as of 12/31/07.
| Valuations | |
|---|---|
| Median Market Cap | $7.3 Billion |
| Weighted Average Market Cap | $80.9 Billion |
| P/E | 15.5 |
| P/B | 2.6 |
| Div Yield | 2.3 |
| P/CF | 12.7 |
| P/S | 2.4 |
| Number of Holdings | 1,959 |
| Source: Thomson Datastream; MSCI, Inc.7 as of 12/31/07. | |
| Note: P/E = price-to-earnings ratio; P/B = price-to-book ratio; Div Yield = dividend yield; | |
| P/CF = price-to-cash-flow ratio; P/S = price-to-sales ratio. | |
Note that being pessimistic on Financials doesn’t necessarily mean holding zero financial stocks. It might only mean holding a lesser percentage of stocks in your portfolio than the benchmark. This is an important feature of benchmarking—it allows an investor to make strategic decisions on sectors and countries, but maintains diversification, thus managing risk more appropriately.
For the Materials sector, we can use Materials-specific benchmarks like the S&P 500 Materials, MSCI World Materials, or Russell 2000 Materials indexes. The components of these benchmarks can then be evaluated at a more detailed level such as industry and sub-industry weights. (For example, we broke out MSCI World industry and sub-industry benchmark weights in Chapter 4.)
TOP-DOWN DECONSTRUCTED
The top-down method begins by first analyzing the macro environment. It asks the “big” questions like: Do you think stocks will go up or down in the next 12 months? If so, which countries or sectors should benefit most? Once you have decided on these high-level portfolio “drivers” (sometimes called “themes”), you can examine various macro portfolio drivers to make general overweight and underweight decisions for countries, sectors, industries, and sub-industries versus your benchmark.
For instance, let’s say we’ve determined a macroeconomic driver that goes something like this: “In the next 12 months, I believe global infrastructure construction will be greater than most expect.” That’s a very high-level statement with important implications for your portfolio. It means you’d want to search for industries, and ultimately stocks, that would benefit most from increased infrastructure construction.
The second step in top-down is applying quantitative screening criteria to narrow the choice set of stocks. Since, in our hypothetical example, we believe infrastructure construction will be high, it likely means we’re bullish on Metals & Mining stocks. But which ones? Are you bullish on, say, copper producers? Aluminum producers? Steel producers? Do you want producers with exposure to the US or another region? Do you want small cap Materials companies or large cap? And what about valuations? Are you looking for growth or value? (Size and growth/value categories are often referred to as “style” decisions.) These criteria and more can help you narrow the list of stocks you might buy.
The third and final step is performing fundamental analysis on individual stocks. Notice that a great deal of thinking, analysis, and work is done before you ever think about individual stocks. That’s the key to the top-down approach: It emphasizes high-level themes and funnels its way down to individual stocks, as is illustrated in Figure 7.1.
Step 1: Analyze Portfolio Drivers and Country and Sector Selection
Let’s examine the first step in the top-down method more closely. In order to make top-down decisions, we develop and analyze what we call portfolio drivers (as mentioned previously). We segment these portfolio drivers in three general categories: economic, political, and sentiment.
Figure 7.1 Portfolio Drivers

Portfolio drivers are what drive the performance of a broad category of stocks. Accurately identifying current and future drivers will help you find areas of the market most likely to outperform or underperform your benchmark (i.e., the broader stock market).
Table 7.4 shows examples of each type of portfolio driver. It’s important to note these drivers are by no means comprehensive nor are they valid for all time periods. In fact, correctly identifying new portfolio drivers is essential to beating the market in the long term.
Table 7.4 Portfolio Drivers
| Economic | Political | Sentiment |
|---|---|---|
| Yield curve spread | Taxation | Mutual fund flows |
| Relative GDP growth | Property rights | Relative style and asset class valuations |
| Monetary base/growth | Structural reform | Media coverage |
| Currency strength | Privatization | Institutional searches |
| Relative interest rates | Trade/capital barriers | Consumer confidence |
| Inflation | Current account | Foreign investment |
| Debt level (sovereign, corporate, consumer) | Government stability | Professional investor forecasts |
| Infrastructure spending | Political turnover | Momentum cycle analysis |
| M&A, issuance and repurchase activity | Wars/conflicts | Risk aversion |
Economic Drivers Economic drivers are anything related to the macroeconomic environment. This could include monetary policy, interest rates, lending activity, yield curve analysis, relative GDP growth analysis, and myriad others. What economic forces are likely to drive GDP growth throughout countries in the world? What is the outlook for interest rates and how would that impact sectors? What is the outlook for technology and infrastructure spending among countries?
Economic drivers pertain not only to the fundamental outlook of the economy (GDP growth, interest rates, inflation), but also to the stock market (valuations, M&A activity, share buybacks). As an investor, it’s your job to identify these drivers, and determine how they’ll impact your overall portfolio and each of its segments.
The following is an example list of economic drivers that could impact portfolio performance:
• US economic growth will be higher than consensus expectations.
• European Union interest rates will remain benign.
• Mergers, acquisitions, and share buybacks will remain strong.
• Emerging markets growth will drive commodity demand.
Political Drivers Political drivers can be country-specific, pertain to regions (European Union, Organisation for Economic Cooperation and Development [OECD]), or affect interaction between countries or regions (such as trade policies). These drivers are more concerned with categories such as taxation, government stability, fiscal policy, and political turnover. Which countries are experiencing a change in government that could have a meaningful impact on their economies? Which sectors could be at risk from new taxation or legislation? Which countries are undergoing pro-growth reforms?
Political drivers will help determine the relative attractiveness of market segments and countries based on the outlook for the political environment. Be warned, however: Most investors suffer from “home country bias,” where they ascribe too much emphasis on the politics of their own country. Always keep in mind it’s a big, interconnected world out there, and geopolitical developments everywhere can have implications.
What are possible political drivers you can find? The following is a list of examples that can drive stocks up or down:
• Political party change in Japan driving pro-growth reforms.
• New tax policies in Germany stalling economic growth.
• Protests, government coups, conflict driving political instability in Thailand.
Sentiment Drivers Sentiment drivers attempt to measure consensus thinking about investment categories. Ideally, drivers identify market opportunities where sentiment is different than reality. For example, let’s say you observe current broad market sentiment expects a US recession in the next year. But you disagree and believe GDP growth will be strong. This presents an excellent opportunity for excess returns. You can load up on stocks that will benefit from an economic boom and watch the prices rise as the rest of the market realizes it much later.
Since the market is a discounter of all known information, it’s important to try and identify what the market is pricing in. The interpretation of such investor drivers is typically counterintuitive (avoid what is overly popular and seek what is largely unpopular). Looking forward, which sectors are investors most bullish about and why? What countries or sectors are widely discussed in the media? What market segments have been bid up recently based on something other than fundamentals? If the market’s perception is different than fundamentals in the short term, stocks will eventually correct themselves to reflect reality in the long term.
A note of caution: Gauging market sentiment does not mean being a contrarian. Contrarians are investors who simply do the opposite of what most believe will happen. Instead, find places where sentiment (people’s beliefs) doesn’t match what you believe is reality and over- or underweight sections of your portfolio accordingly, relative to your benchmark. Examples of sentiment drivers include:
• Investors remain pessimistic about Technology despite improving fundamentals.
• Sentiment for the Chinese stock market approaching euphoria, stretching valuations.
• Professional investors universally forecast US small cap stocks to outperform.
How to Create Your Own Investment Drivers
In order to form your own investment drivers, the first step is accessing a wide array of data from multiple sources. For country drivers, this could range from globally focused publications like the Wall Street Journal or Financial Times to regional newspapers or government data. For sector drivers, this could include reading trade publications or following major company announcements.
Remember, however, that markets are efficient—they reflect all widely known information. Most pertinent information about public companies is, well, public. Which means the market already knows. News travels fast, and investors with the knowledge and expectations are absorbed by markets very quickly. Those seeking to profit on a bit of news, rumor, or speculation must acknowledge the market will probably move faster than they can. Therefore, in order to consistently generate excess returns, you must either know something others don’ t or interpret widely known information differently and correctly from the crowd. (For a detailed discussion on these factors and more, read The Only Three Questions That Count by Ken Fisher.)
Step 2: Quantitative Factor Screening
Step two in the top-down method is screening for quantitative factors. This allows you to narrow the potential list of stocks once your portfolio drivers are in place.
There are thousands and thousands of stocks out there, so it’s vital to use a series of factors like market capitalization and valuations to narrow the field a bit. Securities passing this screen are then subjected to further quantitative analysis that eliminates companies with excessive risk profiles relative to their peer group, such as companies with excessive leverage or balance sheet risk and securities lacking sufficient liquidity for investment.
The rigidity of the quantitative screens is entirely up to you, and will determine the number of companies on your prospect list. The more rigid the criteria, the fewer the companies that make the list. Broader criteria will increase the number of companies.
Examples How can you perform such a screen? Here are two examples of quantitative factor screenings to show how broad or specific you can be. You might want to apply very strict criteria, or you may prefer to be broader.
Strict Criteria
• First, you decide you want to search for only Materials firms. By definition, that excludes all companies from the other nine sectors. Already, you’ve narrowed the field a lot!
• Now, let’s say that based on your high-level drivers, you only want European Materials stocks. By excluding all other regions besides Europe, you’ve narrowed the field even more.
• Next, let’s decide to search only for Steel firms in the Materials sector.
• Perhaps you don’t believe very small stocks are preferable, so you limit market capitalization to $5 billion and above.
• Lastly, let’s set some parameters for valuation:
• P/E (price -to - earnings) less than 12
• P/B (price -to -book) less than 8
• P/CF (price-to-cash-flow) less than 10
• P/S (price -to -sales) less than 10
This rigorous process of selecting parameters will yield a small number of stocks to research, all based on your higher-level themes. But maybe you have a reason to be less specific and want to do a broader screen because you think Materials in general is a good place to be.
Broad Criteria
• Materials sector
• Global (no country or region restrictions)
• Market caps above $10 billion
This selection process is much broader and obviously gives you a much longer list of stocks to choose from. Doing either a strict or broad screen isn’t inherently better. It just depends on how well-formed and specific your higher-level themes are. Obviously, a stricter screen means less work for you in step three—actual stock selection.
Step 3: Stock Selection
After narrowing the prospect list, your final step is identifying individual securities possessing strategic attributes consistent with higher-level portfolio themes. (We’ ll cover the stock selection process specifically in more detail in Chapter 8.) Your stock selection process should attempt to accomplish two goals:
1. Find firms possessing strategic attributes consistent with higher-level portfolio themes, derived from the drivers that give those firms a competitive advantage versus their peers. For example, if you believe owning firms with dominant market shares in consolidating industries is a favorable characteristic, you would search for firms with that profile.
2. Maximize the likelihood of beating the category of stocks you are analyzing. For example, if you want a certain portfolio weight of Diversified Mining companies and need 4 stocks out of 12 meeting the quantitative criteria, you then pick the 4 that, as a group, maximize the likelihood of beating all 12 as a whole. This is different than trying to pick “the best four.” By avoiding stocks likely to be extreme or “weird” outliers versus the group, you can reduce portfolio risk while adding value at the security selection level.
In lieu of picking individual securities, there are other ways to exploit high-level themes in the top-down process. For instance, if you feel strongly about a particular sub-industry but don’t think you can add value through individual security analysis, it may be more prudent to buy a group of companies in the sub-industry or a category product like an exchange-traded fund (ETF). There are a growing variety of ETFs that track the domestic and global Materials sector, industries, and even specific commodity prices. This way, you can be sure to gain broad Materials exposure without much stock-specific risk. (For more information on ETFs, visit www.ishares.com, www.sectorspdr.com, or www.masterdata.com.)
MANAGING AGAINST A MATERIALS BENCHMARK
Now we can practice translating this specifically to your Materials allocation. Just as you analyze the components of your benchmark to determine country and sector components in a top-down strategy, you must analyze each sector’s components, as we did in Chapter 4. To demonstrate how, we’ ll use the MSCI World Materials Sector index as the benchmark. Table 7.5 shows the MSCI World Materials sub-industry weights as of December 31, 2007. We don’t know what the sample portfolio weights should be, but we know it should add up to 100 percent. Of course, if managing against a broader benchmark, your Materials sector weight may add up to more or less than the Materials weight in the benchmark, depending on over- or underweight decisions.
Keeping the sub-industry weights in mind will help mitigate benchmark risk. If you have a portfolio of stocks with the same sub-industry weights as the MSCI World Materials Index, you’ re neutral—taking no benchmark risk. However, if you feel strongly about a sub-industry, like Paper Packaging and decide to only purchase those firms (one of the smallest weights in the sector), you ’re taking a huge benchmark risk. The same is true if you significantly underweight a sub-industry. All the same rules apply as when you do this from a broader portfolio perspective, as we did earlier in this chapter.
Table 7.5 MSCI World Materials Sub-Industry Weights vs. Sample Portfolio
Source: Thomson Datastream; MSCI, Inc.8 as of 12/31/07.
| Sub-Industry | MSCI World (%) | Sample Portfolio |
|---|---|---|
| Diversified Metals & Mining | 28.3 | ? |
| Steel | 14.0 | ? |
| Gold | 6.1 | ? |
| Aluminum | 2.4 | ? |
| Precious Metals & Minerals | 0.5 | ? |
| Commodity Chemicals | 2.5 | ? |
| Specialty Chemicals | 5.9 | ? |
| Diversified Chemicals | 15.3 | ? |
| Fertilizers & Agricultural Chemicals | 8.5 | ? |
| Industrial Gases | 5.1 | ? |
| Construction Materials | 5.2 | ? |
| Paper Products | 3.3 | ? |
| Forest Products | 1.0 | ? |
| Paper Packaging | 0.8 | ? |
| Metal & Glass Containers | 1.2 | ? |
| Total | 100.0 | 100.0% |
The benchmark’s sub-industry weights provide a jumping-off point in making further portfolio decisions. Once you make higher-level decisions on the sub-industries, you can make choices versus the benchmark by overweighting the sub-industries you feel likeliest to perform best and underweighting those likeliest to perform worst. Table 7.6 shows how you can make different portfolio bets against the benchmark by over- and underweighting sub-industries.
Table 7.6 Portfolio A
Source: Thomson Datastream; MSCI, Inc.9 as of 12/31/07.

Note: Portfolio A might be a portfolio of all Materials stocks, or it can simply represent a neutral Materials sector allocation in a larger portfolio.
The “difference” column shows the relative difference between the benchmark and Portfolio A. In this example, Portfolio A is most overweight to Diversified Metals & Mining and Steel and most underweight to Diversified Chemicals and Construction Materials.
In other words, for this hypothetical example, Portfolio A’s owner expects Diversified Metals & Mining and Steel to outperform the sector and Diversified Chemicals and Construction Materials to underperform the sector. But in terms of benchmark risk, Portfolio A remains fairly close to the benchmark weights, so its relative risk is quite modest. This is extremely important: By managing against a benchmark, you can make strategic choices to beat the index and are well-diversified within the sector without concentrating too heavily in a specific area.
Table 7.7 Portfolio B
Source: Thomson Datastream; MSCI, Inc.10 as of 12/31/07.
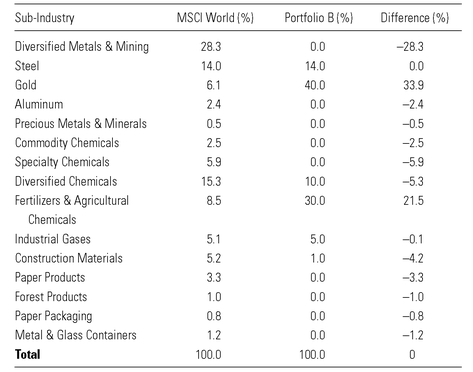
Table 7.7 is another example of relative portfolio weighting versus the benchmark. Portfolio B is significantly underweight to Diversified Metals & Mining and most overweight to Gold and Fertilizers & Agricultural Chemicals. Because the sub -industry weights are so different from the benchmark, Portfolio B takes on substantially more relative risk than Portfolio A.
Regardless of how your portfolio is positioned relative to the benchmark, it’s important to use benchmarks to identify where your relative risks are before investing. Knowing the benchmark weights and having opinions on the future performance of each sub-industry is a crucial step in building a portfolio designed to beat the benchmark. Should you make the correct overweight and underweight decisions, you’ re likelier to beat the benchmark regardless of the individual securities held within. But even if you’ re wrong, you’ ll have diversified enough not to lose your shirt.

Chapter Recap
A more effective approach to sector analysis is “top-down.” A top-down investment methodology analyzes big picture factors such as economics, politics, and sentiment to forecast which investment categories are likely to outperform the market. A key part of the process is the use of benchmarks (such as the MSCI World Materials or S&P 500 Materials indexes), which are used as guidelines for building portfolios, monitoring performance, and managing risk. By analyzing portfolio drivers, we can identify which Materials industries and sub-industries are most attractive and unattractive, ultimately filtering down to stock selection.
• The top-down investment methodology first identifies and analyzes high-level portfolio drivers affecting broad categories of stocks. These drivers help determine portfolio country, sector, and style weights. The same methodology can be applied to a specific sector to determine industry and sub-industry weights.
• Quantitative factor screening helps narrow the list of potential portfolio holdings based on characteristics such as valuations, liquidity, and solvency.
• Stock selection is the last step in the top-down process. Stock selection attempts to find companies possessing strategic attributes consistent with higher-level portfolio drivers.
• Stock selection also attempts to find companies with the greatest probability of outperforming its peers.
• It’s helpful to use a Materials benchmark as a guide when constructing a portfolio to determine your sub-industry overweights and underweights.
..................Content has been hidden....................
You can't read the all page of ebook, please click here login for view all page.