
In This Chapter
Installing SPSS
Getting SPSS to run
Understanding your configuration options
This chapter is all about installing your software and setting the options that determine how it works. If the software you'll be using is already installed, you can skip the first part of this chapter and jump right to configuration a little further on. I mention that because it's a For Dummies book, and I was told not to leave anything out.
The installation process guides you, step by step, and then does most of the work itself. The configuration settings all default to something reasonable, so I suggest leaving them alone for now. You can always come back later and make a change if you develop a gripe.
Soap powder comes in boxes, paint comes in cans, corn dogs come on sticks, and SPSS comes on the Internet. Well, it can also come on a CD, but the installation process is fundamentally the same. The only real difference is where the files come from.
Warning
Don't lose track of anything. If you get your software on a CD, find a place to put the package and all its contents. Don't throw out anything. That includes the plastic box in which you found the CD and the cardboard stiffener that came inside the mailing package. If you download the software, keep meticulous records of the Web site, which files you download, all numbers and identifiers you encounter. Trust me, you'll need them later.
The Mac and Linux versions of the software are similar in operation, but details of the installation procedure described here are specific to Windows.
You won't have to worry about the minimum requirements for the computer — unless yours is an antique. I mean, who doesn't have at least 256MB of RAM and 300MB of free disk space?
SPSS comes in a variety of flavors. They're fundamentally alike, but some versions have more parts than others. You may have all, some, or none of the add-ons described in Chapter 20. In any case, you need an authorization code to enable whatever you do have. You will need to authorize your base system as well as any add-ons. You may have more than one authorization code — it depends on how your SPSS system is configured, which is determined by what parts are included with it.
For the installation procedure to work, you must be logged in to your Windows system with administrator privileges. You don't have to be logged in as an administrator, but whatever login you're using must have the privileges that the administrator has.
You should also be connected to the Internet. You can install SPSS without being connected, but it's a pain to do it that way. Make it easy on yourself and connect your computer to the Internet before you start. And keep it connected at least until you get SPSS installed.
In summary, before you begin the installation:
The installation procedure is dead simple: You simply start the installation program and answer the questions. And the questions are easy.
Note
If you have a previous version of the software installed, you have to remove it before you can install the new version. To remove it, use the Windows Control Panel dialog box and select SPSS (or PASW, depending on what you have installed). Then, click the Remove button or Uninstall button to delete it.
You can start the installer in more than one way. The first method is automatic: You insert the SPSS CD into the drive and wait a bit. Most Windows computers will recognize what's on the CD and start the installer. If the installer doesn't start automatically (or if you fool around and close the window after it started), you can execute and then find and run the program called setup.exe on the SPSS CD. If you have downloaded your version of the software, you've gotten an executable program. All you need to do is run it. However you do it, you get the window shown in Figure 2-1.
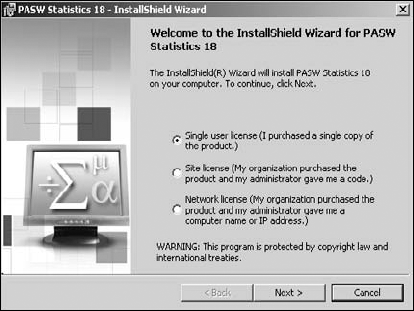
As you can see in Figure 2-1, you install SPSS according to the type of license you've purchased. The example described in this chapter is for a single-user installation, but you can also install it under a site license or a network license.
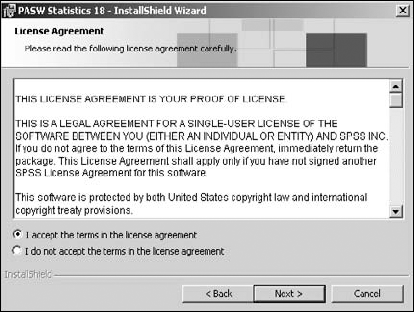
With the window shown in Figure 2-1 on your screen, select the type of license you have and click the Next button. After you make your selection, you're greeted by the license agreement, as shown in Figure 2-2. Simply do what it says: Read the license, and if you accept the terms, select the I Accept the Terms in the License Agreement option and then click the Next button.
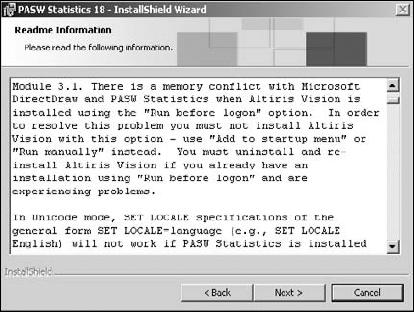
Now the installation gets talky and displays the ReadMe file, as shown in Figure 2-3. If you thought the license was something, wait until you read this stuff. Not all of it will apply to you, but you should read it anyway because you might come across something you need to know, such as where temporary files are stored or the Klingon numbering system. After you've gained all the pleasure you can stand from the ReadMe file, click Next to move on.
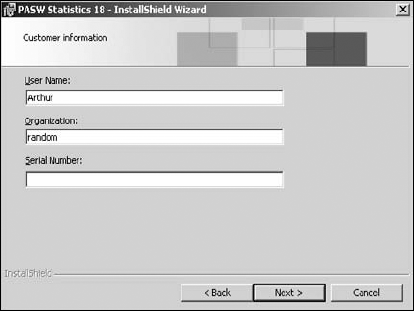
The next screen, shown in Figure 2-4, asks for your name and organization. (I always take it as a compliment that the software thinks of me as being organized, but I can never figure out what to put in the blank. You can put anything you like in there, but keep it clean, because it could pop up on the screen one afternoon while your mom is watching.) The third piece of information is a little more important. It wants you to enter the serial number of your copy of the software. This is not the authorization code — that comes later. You can find the serial number in two places: on a tag inside the plastic box in which you found the CD and on the cardboard stiffener that came inside the mailing package. If you got your copy online, you should find everything you need somewhere in the e-mails you've received — if not, you may need to request the information.
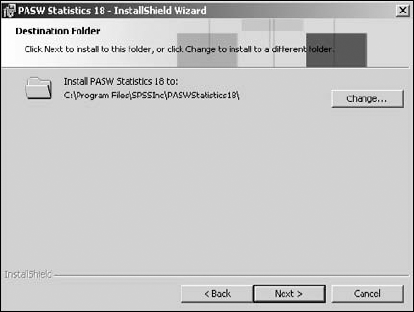
When you click the Next button, you get a window that asks for the directory in which you want SPSS installed, as shown in Figure 2-5. The directory that the installer normally chooses is fine; change it only if you have a really good reason. If you can't think of a reason, accept what's there and move on by clicking the Next button.
The window that shows up at this point asks you whether you really want to install SPSS. All you've done so far is answer some questions; nothing has been installed. This window has a Back button you can use to go back and change your answers. The Next button unleashes the installation software onto your computer. The screen also has a Cancel button if you chicken out, or if you enjoyed the process so much that you want to drop everything and do the entire thing over again. If you actually want SPSS on your computer, click Next.
The next window, shown in Figure 2-6, lists every file being installed, while a progress indicator moves across the screen. The filenames flicker by pretty fast; only Superman or Data from Star Trek could read them. Normal mortals see mostly a line of constantly flickering letters.
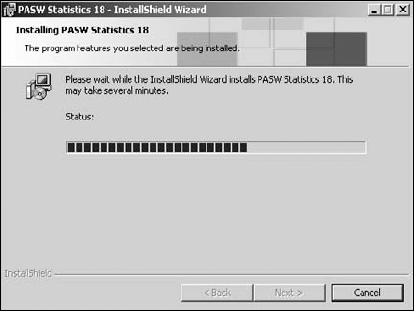
The progress indicator marches across the screen until it reaches the far right. At that point, the flickering of file names will stop. For a time, nothing moves. Be patient. Just about the time you start to wonder whether something has gone wrong, the display presents the window shown in Figure 2-7.
We're coming to the point where it's convenient to be connected to the Internet. You need to select the Register with SPSS.com option shown in the lower-left corner of the window in Figure 2-7. The authorization code is on one of your pieces of paper, or maybe someone else has it. Whether or not you have it, click OK so you will get the product authorization window shown in Figure 2-8.
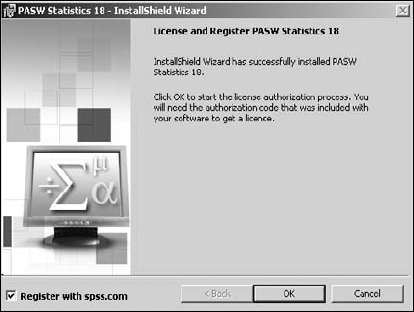
For full access to the software, you must register it with SPSS.com. If you're not connected, and you don't register, you can actually get it to work anyway, but only temporarily. You will have to authorize it (either now or later) before you can use it permanently. You use this window to select which you want to do, and then click the OK button.
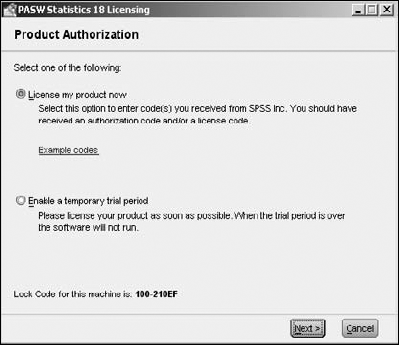
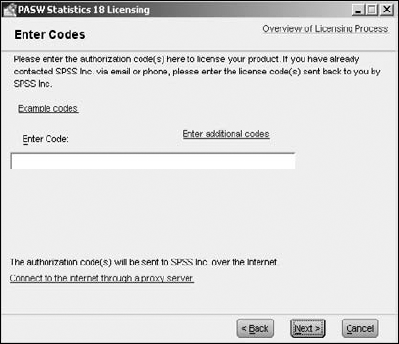
You can use the window in Figure 2-9, which appears next, to enter your code. If you think the number you've got is too long, it's probably the right number (authorization codes are long). If you're not sure the number you've got is an authorization code, you can click the Example Codes link and see what an authorization code looks like. The code will be sent over the Internet to SPSS.
Note
If you're behind a proxy server, you'll have to provide information that allows a message to get out and a reply to get in, so that SPSS can get a message to come back into your computer.
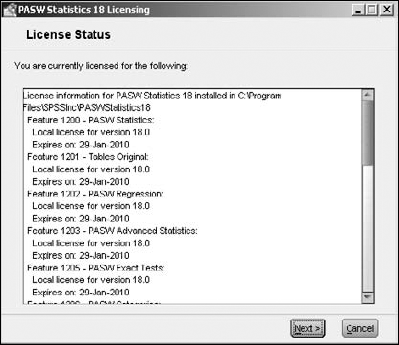
When you're ready, you can enter the code and click the Next button. A window appears with a message verifying authorization. Clicking the Next button brings up the window displayed as Figure 2-10.
Note
An important piece of information included in the window in Figure 2-10 is the expiration date of your license. You'd be well advised to check the dates, and make notes of them for future reference.
Click the Next button. The window disappears and your software is ready to run.
If you installed SPSS but chose to register it later, or if you want to check the status of your registration. you can do that easily. Simply select Start
Tip
The Internet being the Internet, your connection might get dropped right in the middle of the registration process. If that happens, just start over from the Start menu.
You now have SPSS installed on your computer. You'll find a listing for it with the other programs on your Start menu. Choose Start
PASW Statistics 18
PASW Statistics 18 License Authorization Wizard
The first choice is the main program itself — and that will be the number-one selection on your hit parade in days to come. The second choice is the authorization stuff you went through earlier.
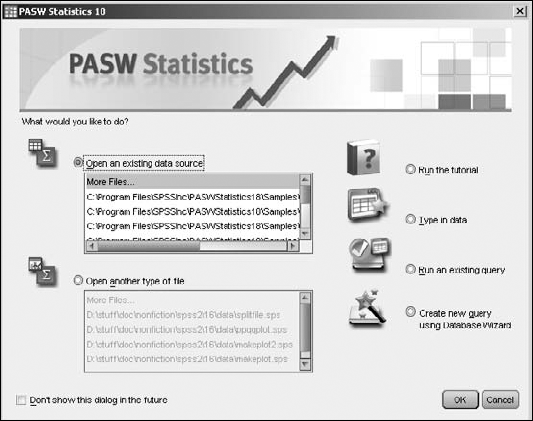
When you first start SPSS, you get a window like the one in Figure 2-11. This window makes it possible for you to go directly to the window you want to work with. The problem is that it assumes you already know what you want to do, but so far you have no idea what you want to do with SPSS yet, so just click the Cancel button to close the window.
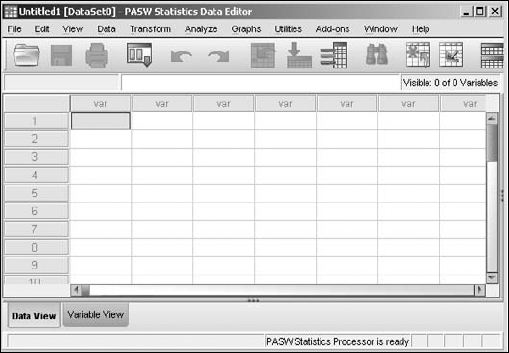
You see the regular Data Editor window, shown in Figure 2-12. If you've ever worked with a spreadsheet, this display should look familiar. And it works much the same way. This window is the one you use to enter data. I generally like to expand the window to fill the entire screen because more spaces are displayed at one time. Besides, I don't need to see any other windows because I almost never do two things at once.
Over time, you'll find that you want to configure your system to work in ways that are different from the defaults. SPSS has lots of options that you can set to do just that. If you're new to this and have just started looking at the software, you probably don't want to change any options just yet, but you need some idea of the possibilities it offers. Later, when you absolutely, positively have to make some sort of change, you'll know where to go to do it.
With the Data Editor on the screen (refer to Figure 2-12), choose Edit
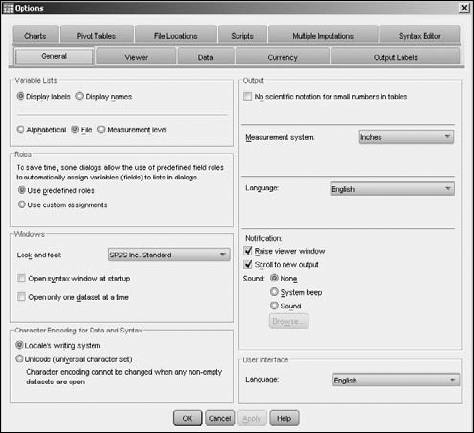
The first tab in the Options window, the General tab (shown in Figure 2-13), displays a dialog box with options that don't fit into any of the categories defined by the other tabs.
The options displayed by the General tab are as follows:
Variable Lists: Lists of variables in your output can be identified by either their labels or their names. You can think of these as short titles and long titles, and you can have your data items, by default, tagged by one or the other as they appear in lists. Also, you can have your data appear in alphabetical order by the titles you use for individual items, or simply by the order in which the data appears in the file. File order usually makes more sense.
Roles: When you select some actions, variables of the types that can play certain roles in the processing to follow can be preselected for you if you have the first option (
Use predefined roles) selected. If you have the other option (Use custom assignments) selected, you will be required to choose all the variables yourself.Windows: These are cosmetic options. You can choose how you like the dialog boxes of SPSS to appear.
Look and Feel: Your choices are SPSSInc Standard, SPSSInc Classic, and Windows.
Open the Syntax Window at Start-up: Makes SPSS begin with the syntax window instead of the data editor. Choose this option if you use the scripting language more often than the windowing interface to enter data and run your predefined procedures.
Open Only One Dataset at a Time: Whenever you open a new dataset, the new information appears in a new window and any that are already open are closed. With this option set, the already open dataset is closed when the new one is opened. By the way, this does not apply to datasets opened inside a syntax language process.
Character Encoding for Data and Syntax: You can choose to read and write files in Unicode mode, but you shouldn't unless you have a good reason to do so. The files are read and written in UTF-8 format. If you write a Unicode file, you need to be sure that the software that reads it understands that format. When you read a file in Unicode mode, it's much larger in memory than it would be otherwise.
Output: These options control the appearance of tables and graphs:
No scientific notation for small numbers: Suppresses scientific notation for small numbers. For example,
12appears as12instead of1.2e1, which is a little harder to read. SPSS doesn't say exactly what it considers to be a small number.Measurement System: Units used to specify the margins between table cells, the width of cells, and the spacing between printed characters. You can use inches, centimeters, or the default, points. (A point is 1/72; of an inch.)
Language: The output language can be set to any one of about a dozen choices, and it determines the language used to output files. You may have use Unicode mode to handle all the characters in some languages.
Notification: The method the software uses to notify you when the results of a calculation are available. With the Raise Viewer Window option, the display window opens automatically. With the Scroll to New Output option, the window scrolls and exposes the location of the new data. You also can have the system beep, tweet, or sing when an analysis is complete. (It's considered impolite to have it make rude comments when an analysis finishes.)
User Interface: The user-interface Language setting determines the language used to display menus and dialog boxes. Life is so much easier if you choose a language that you actually know how to read.
Output from SPSS is formatted for viewing with either the draft viewer or the regular viewer. SPSS thinks in terms of a printed page, but the same layouts are used for displaying data on the screen. The options you can set for the regular viewer can be accessed with the Viewer tab, shown in Figure 2-14.
The options in the Viewer tab are as follows:
Initial Output State: Determines which items are displayed each time you run a procedure. You choose an item by either selecting its name (Log, Warnings, Notes, Title, and so on) from the pull-down list or by selecting its icon. Then you can select whether you want it to appear or remain hidden, how you want its text justified (Align Left, Centered, or Align Right), and whether the information occurrence should be included as part of the log (Display Commands in the Log).
Title: Here you choose the font used for main output titles. It appears at the top of the first page of a report.
Page Title: Choose the font used for the title appearing at the top of subsequent pages of a report.
Text Output: Determines the font used for the text of your report and the labels on graphs and tables. The font size also affects the page width and length because the sizes are measured by counting characters.

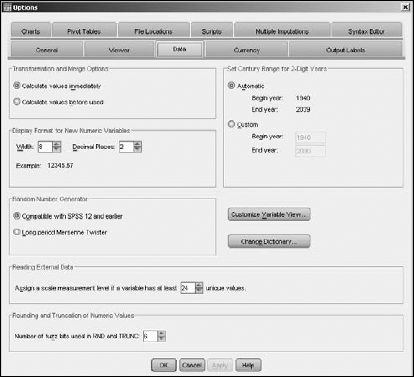
The Data tab, shown in Figure 2-15, can be used to specify how SPSS handles a few special numeric situations. The options in the Data tab are as follows:
Transformation and Merge Options: Determines when — not how — results are calculated. You can have SPSS perform calculations immediately, or you can have it wait until it needs the number for something (either another calculation or a displayed value). Both methods have their advantages and disadvantages.
Display Format for New Numeric Variables: Determines how many digits are used in the display of values, and how many digits are to the right of the decimal. Width is the total number of characters, including the decimal point. The Decimal Places setting determines the number of digits that appear to the right of the decimal point. If the number of places to the right is too small, values are rounded to fit. If the number of places is too large, values are put in scientific notation.
Random Number Generator: Ever since a need for random numbers was discovered, generating them on a computer has been a problem — because computers naturally do things in a non-random way. SPSS offers you two ways to do it: the old way and the new way. If you'd rather not generate your random numbers the same way you did in older versions of SPSS (version 12 and earlier), use the Twister.
Reading External Data: When SPSS reads numeric data, it counts the number of unique values assigned to a variable and uses the count to determine whether the variable is nominal or scalar. The count you enter here determines the threshold used to make that determination.
Rounding and Truncation of Numeric Values: This setting determines the threshold for rounding numbers. SPSS does the calculation in base two, so the count is a number of bits. Fuzz bits refers to a count of the number of bits to be considered.
Set Century Range for 2-Digit Years: A solution to the Y2K problem. I'll bet you thought that was all over. It is, but the solutions are still with us — and this is one of them: You put in two four-digit years here, and any two-digit value that you supply to identify a year is assumed to be between the two years you specify. This is mostly for old data. If you always use four digits for years in your data, this century range setting is never used.
Customize Variable View button: Allows you to determine which variable attributes are displayed, and in what order they are displayed, in the Variable View window of SPSS.
Change Dictionary button: Allows you to determine which dictionary is used to check the spelling in Variable View.
Different parts of the world use different symbols and formats when writing about currency. The window shown in Figure 2-16 lets you specify the display format of your currency.
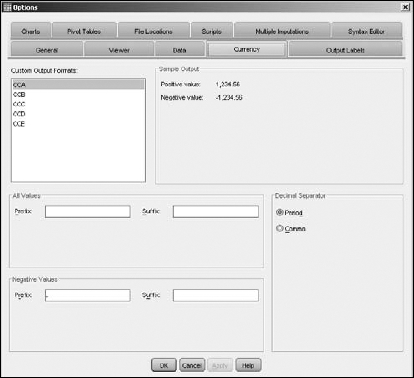
Figure 2.16. Number formats and symbols can be set so SPSS displays things correctly for your currency.
Following are the options in the Currency tab:
Custom Output Formats: The default format for presenting currency values. The five formats have the unlikely names CCA, CCB, CCC, CCD, and CCE. Those are the only ones you can have, but that has to be enough for anybody (I mean, really, if you work with more kinds of money than that, buy another copy of SPSS). The calculations are always performed the same way — the differences are in the display. You can set the display configuration for each one to be anything you'd like (dollars, euros, yen, and so on), and then switch among them as often as you wish.
Sample Output: Displays the printed format of positive and negative currency values. As you switch from one currency selection to another, and as you change the formatting of any of them, the sample displays examples of the format.
All Values: Specifies the characters that appear on-screen to identify the currency, at the front or back of all values. Such characters include the British pound sign and the cent mark.
Negative Values: Specifies the characters placed in front and in back of negative values. For example, some folks like to use
<and>to surround negative money values.Decimal Separator: Many currency notations use commas instead of periods to denote the fractional portion of the amount.
Every variable can be identified in two ways: by a label and by a name. In your output, you can specify to have variables identified by one or the other or both. You configure output labeling on the Output Labels tab, shown in Figure 2-17.
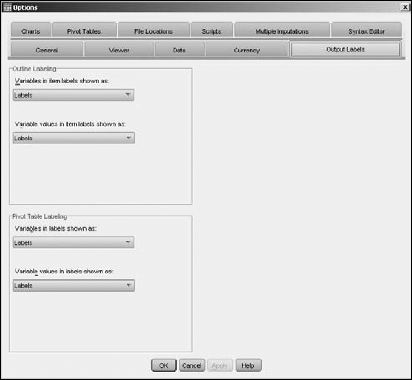
With these options, you can choose to display the variable names, the variable labels, or both. Longer labels can be descriptive and make your data easier to determine, but they can also screw up some formats. Following are the options in the Output Labels tab:
Outline Labeling: The text used to identify the parts of charts and graphs.
Pivot Table Labeling: The text used to identify the rows and columns of tables.
The default appearance of charts is determined by the settings in the Charts tab, shown in Figure 2-18.
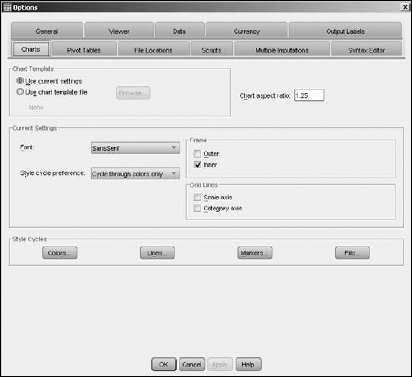
The options in the Chart tab are as follows:
Chart Template: A file that contains a set of starter settings that you can use for designing a new chart. When you create a new chart, it can use the settings in this configuration window, or it can use this file. You can select any file to be your default starting template. It's easy to create a chart template: Simply create a chart that has all the configuration settings you like — and save it so you can use it as the template file.
Current Settings: This section offers two pull-down menus, as follows:
Font: The default font for the text in any chart you design.
Style Cycle Preference: How SPSS chooses the styles and colors when laying out data items in a chart. You can have SPSS cycle through just the colors so each item included in the graph is identified only by its color. If you're using a black-and-white printer or display, choose Cycle Through Patterns Only: Each data item is identified by a graphic pattern of line styles and marker symbols.
Style Cycles: Customizes the sequence of colors and patterns to be cycled through.
Chart Aspect Ratio: The ratio of the width to the height of the produced charts, initially set to 1.25. Which ratio looks better is a matter of opinion; you'll have to experiment.
Frame: Determines whether charts display an inner frame, an outer frame, both, or neither.
Grid Lines: Displays dividing lines on the scale axis, on the category axis, or on both.
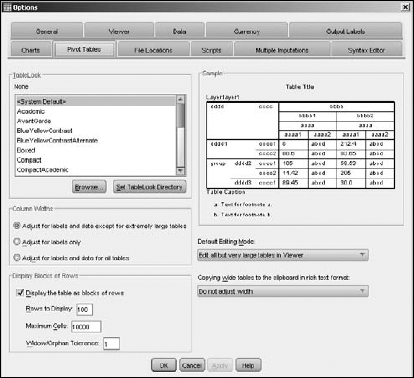
The tabular output format of SPSS is the pivot table. An example is shown as the sample in Figure 2-19, which is the Pivot Tables tab used to set display options for the tables.
The options in the Pivot Tables tab are as follows:
TableLook: A file that contains your standard pivot table and determines the initial appearance of any new tables you create. Several such files come with the system and are listed in the window. You can also create your own file by choosing TableLook from the menu in the Pivot Table Editor window. The Set TableLook Directory button sets the currently displayed directory as the one in which your new table files are stored. You can choose any directory you like; clicking this button causes your chosen directory to appear in this window by default.
Column Widths: Controls the way SPSS adjusts column widths in pivot tables. You can adjust them according to the width of the labels or according to the width of the data or labels, whichever is wider.
Display Blocks of Rows: These settings determine the size at which pivot tables appear on-screen in the Viewer window. You can set the number of rows to display in each section and the maximum number of cells to display in each section. The widow/orphan setting has to do with the number of categories that must appear before and after a row is split.
Default Editing Mode: When you double-click a pivot table, you can edit it in place or a separate edit window is opened, depending on this setting.
Copying Wide Tables to the Clipboard in Rich Text Format: When a table is copied to the Word format or Rich Text Format, tables too wide for the document are wrapped to fit, scaled to fit, or left as they are, depending on what you choose for this setting.
The options on this tab specify the locations of the files opened for input and output. The option settings are shown in Figure 2-20.
The options for the file locations are as follows:
Startup Folders for Open and Save Dialogs: The startup folders are the names of the directories that initially appear in the Save and Open dialog boxes when you read or write data files. Optionally, you can select to simply use the last directory used to read or write a file.
Session Journal: You have the option to configure a journal file to receive a copy of every Syntax language command, whether it comes from a script or from a user entering instructions through a dialog box.
Temporary Folder: You can specify the name of the directory where SPSS creates its temporary working files.
Number of Recently Used Files to List: The most recently read or written files are listed in the Files menu. This option specifies how many are listed.
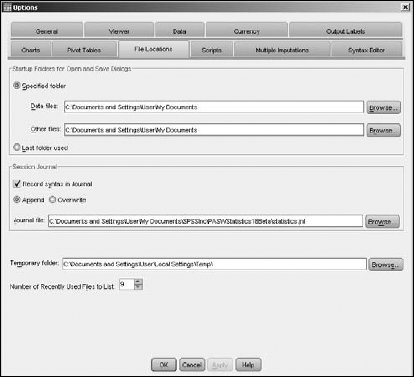
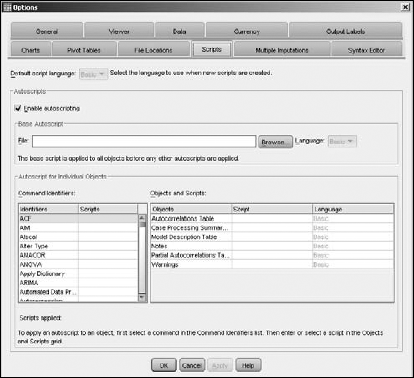
Figure 2-21 displays the Scripts tab, which is used to determine some fundamental defaults about scripts.
Note
Don't mess with any of these until you've been writing scripts for a bit and know what you're doing because a single change here can affect the execution of a number of scripts:
Default Script Language: This setting determines which script editor is launched when new scripts are created. The default script language is Basic. No other choice is available unless you have the Python add-on installed.
Enable Autoscripting: If you choose this option, you enable the autoscripting feature.
Base Autoscript: A script, if it's stored in the file you name here, defines a global procedure that runs automatically when you create an object. It always runs before any other autoscript for that object. The choice of languages for it can be either Basic or Python (and then only if the Python add-on is installed).
Autoscript for Individual Objects: By associating a type of object with an autoscript, you can make an autoscript execute when an object of that specific type is created. To associate an autoscript with an object type, first select the command that generates an object of the desired type (these commands appear in the Identifiers column on the left). On the right, the Objects column then displays the types of objects that your chosen identifier command will generate. In the script cell to the right of the object type you want to tag, enter the path name of the file containing the autoscript. Alternatively, you can click the ellipsis button that appears in the cell and browse for a script file. When you've chosen the file you want, click the OK or Apply button to make the association.
To delete an autoscript association, in the Script column on the right, select the name of the script file you wish to disassociate, and then delete it. Select some other cell to make sure your deletion has been accepted, and then click the OK or Apply button.
SPSS keeps track of which data has been entered and which has been imputed (assumed). The imputation process is that of calculating what the values of your missing data would be. You can set multiple imputation options using the window shown in Figure 2-22.
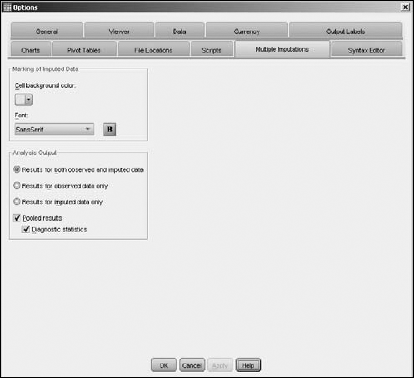
Following are the options in the Multiple Imputations tab:
Marking of Imputed Data: You can change the appearance of imputed data in the Data View display. You can highlight it by changing the background color of the cell in which it's displayed, and by using a different font to write its values.
Analysis Output: You can choose to do analytical calculations using imputed data, without using it, or both ways. Also, you can set the imputation process to pool previously imputed data for further imputation. I'd suggest leaving this setting alone for now — it takes a hairy-legged mathematician to figure it all out. Some analysis procedures can produce separate analysis results using only imputed data — you can choose to generate output from such pooled data.
The editor of the Syntax Command language is capable of recognizing various language parts and highlighting them for you. The Syntax Editor options window is shown in Figure 2-23.
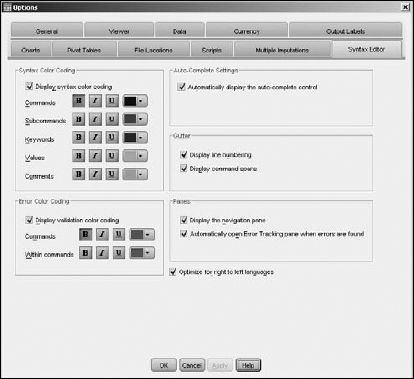
Following are the options in the Syntax Editor tab:
Syntax Color Coding: You can specify different colors for commands, subcommands, keywords, values, and even comments. You can also specify each one as bold, italic, or underlined. A single switch turns on all coloring and highlighting.
Error Color Coding: You can specify the font style and the color coding of error information. A single switch turns on all coloring and highlighting.
Auto-Complete Settings: Use this switch to suppress or allow the display, in the Syntax Editor window, of the option button that turns auto-complete on or off.
Gutter: The space to the left of the commands is called the gutter. Various types of information are displayed there. You can use the gutter to display the line numbers or the span of a command (the beginning and ending of a single command).
Panes: You can display or hide the navigation pane, which contains a list of all Syntax commands. You can also cause the error-tracking pane to automatically appear when SPSS encounters an error.
Optimize for Right to Left Languages: You have to select this option when you're working in a language that reads right to left.