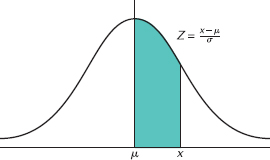
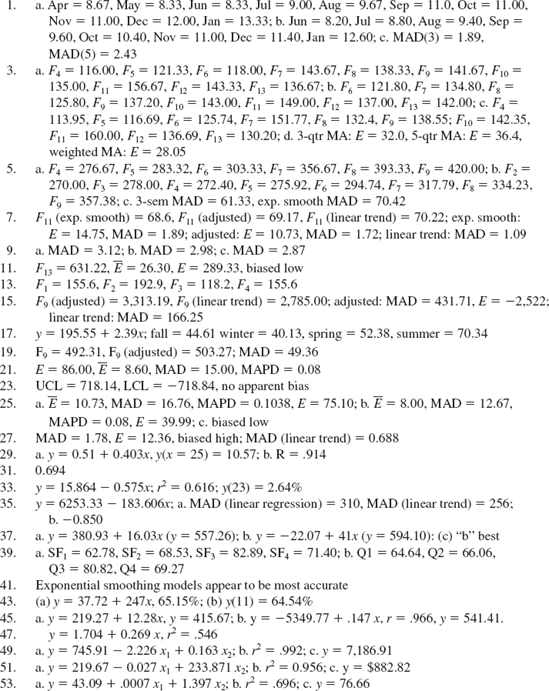
Table A.1. Normal Curve Areas
Z | 0.00 | 0.01 | 0.02 | 0.03 | 0.04 | 0.05 | 0.06 | 0.07 | 0.08 | 0.09 |
|---|---|---|---|---|---|---|---|---|---|---|
0.0 | 0.0000 | 0.0040 | 0.0080 | 0.0120 | 0.0160 | 0.0199 | 0.0239 | 0.0279 | 0.0319 | 0.0359 |
0.1 | 0.0398 | 0.0438 | 0.0478 | 0.0517 | 0.0557 | 0.0596 | 0.0636 | 0.0675 | 0.0714 | 0.0753 |
0.2 | 0.0793 | 0.0832 | 0.0871 | 0.0910 | 0.0948 | 0.0987 | 0.1026 | 0.1064 | 0.1103 | 0.1141 |
0.3 | 0.1179 | 0.1217 | 0.1255 | 0.1293 | 0.1331 | 0.1368 | 0.1406 | 0.1443 | 0.1480 | 0.1517 |
0.4 | 0.1554 | 0.1591 | 0.1628 | 0.1664 | 0.1700 | 0.1736 | 0.1772 | 0.1808 | 0.1844 | 0.1879 |
0.5 | 0.1915 | 0.1950 | 0.1985 | 0.2019 | 0.2054 | 0.2088 | 0.2123 | 0.2157 | 0.2190 | 0.2224 |
0.6 | 0.2257 | 0.2291 | 0.2324 | 0.2357 | 0.2389 | 0.2422 | 0.2454 | 0.2486 | 0.2517 | 0.2549 |
0.7 | 0.2580 | 0.2611 | 0.2642 | 0.2673 | 0.2704 | 0.2734 | 0.2764 | 0.2794 | 0.2823 | 0.2852 |
0.8 | 0.2881 | 0.2910 | 0.2939 | 0.2967 | 0.2995 | 0.3023 | 0.3051 | 0.3078 | 0.3106 | 0.3133 |
0.9 | 0.3159 | 0.3186 | 0.3212 | 0.3238 | 0.3264 | 0.3289 | 0.3315 | 0.3340 | 0.3365 | 0.3389 |
1.0 | 0.3413 | 0.3438 | 0.3461 | 0.3485 | 0.3508 | 0.3531 | 0.3554 | 0.3577 | 0.3599 | 0.3621 |
1.1 | 0.3643 | 0.3665 | 0.3686 | 0.3708 | 0.3729 | 0.3749 | 0.3770 | 0.3790 | 0.3810 | 0.3830 |
1.2 | 0.3849 | 0.3869 | 0.3888 | 0.3907 | 0.3925 | 0.3944 | 0.3962 | 0.3980 | 0.3997 | 0.4015 |
1.3 | 0.4032 | 0.4049 | 0.4066 | 0.4082 | 0.4099 | 0.4115 | 0.4131 | 0.4147 | 0.4162 | 0.4177 |
1.4 | 0.4192 | 0.4207 | 0.4222 | 0.4236 | 0.4251 | 0.4265 | 0.4279 | 0.4292 | 0.4306 | 0.4319 |
1.5 | 0.4332 | 0.4345 | 0.4357 | 0.4370 | 0.4382 | 0.4394 | 0.4406 | 0.4418 | 0.4429 | 0.4441 |
1.6 | 0.4452 | 0.4463 | 0.4474 | 0.4484 | 0.4495 | 0.4505 | 0.4515 | 0.4525 | 0.4535 | 0.4545 |
1.7 | 0.4554 | 0.4564 | 0.4573 | 0.4582 | 0.4591 | 0.4599 | 0.4608 | 0.4616 | 0.4625 | 0.4633 |
1.8 | 0.4641 | 0.4649 | 0.4656 | 0.4664 | 0.4671 | 0.4678 | 0.4686 | 0.4693 | 0.4699 | 0.4706 |
1.9 | 0.4713 | 0.4719 | 0.4726 | 0.4732 | 0.4738 | 0.4744 | 0.4750 | 0.4756 | 0.4761 | 0.4767 |
2.0 | 0.4772 | 0.4778 | 0.4783 | 0.4788 | 0.4793 | 0.4798 | 0.4803 | 0.4808 | 0.4812 | 0.4817 |
2.1 | 0.4821 | 0.4826 | 0.4830 | 0.4834 | 0.4838 | 0.4842 | 0.4846 | 0.4850 | 0.4854 | 0.4857 |
2.2 | 0.4861 | 0.4864 | 0.4868 | 0.4871 | 0.4875 | 0.4878 | 0.4881 | 0.4884 | 0.4887 | 0.4890 |
2.3 | 0.4893 | 0.4896 | 0.4898 | 0.4901 | 0.4904 | 0.4906 | 0.4909 | 0.4911 | 0.4913 | 0.4916 |
2.4 | 0.4918 | 0.4920 | 0.4922 | 0.4925 | 0.4927 | 0.4929 | 0.4931 | 0.4932 | 0.4934 | 0.4936 |
2.5 | 0.4938 | 0.4940 | 0.4941 | 0.4943 | 0.4945 | 0.4946 | 0.4948 | 0.4949 | 0.4951 | 0.4952 |
2.6 | 0.4953 | 0.4955 | 0.4956 | 0.4957 | 0.4959 | 0.4960 | 0.4961 | 0.4962 | 0.4963 | 0.4964 |
2.7 | 0.4965 | 0.4966 | 0.4967 | 0.4968 | 0.4969 | 0.4970 | 0.4971 | 0.4972 | 0.4973 | 0.4974 |
2.8 | 0.4974 | 0.4975 | 0.4976 | 0.4977 | 0.4977 | 0.4978 | 0.4979 | 0.4979 | 0.4980 | 0.4981 |
2.9 | 0.4981 | 0.4982 | 0.4982 | 0.4983 | 0.4984 | 0.4984 | 0.4985 | 0.4985 | 0.4986 | 0.4986 |
3.0 | 0.4987 | 0.4987 | 0.4987 | 0.4988 | 0.4988 | 0.4989 | 0.4989 | 0.4989 | 0.4990 | 0.4990 |
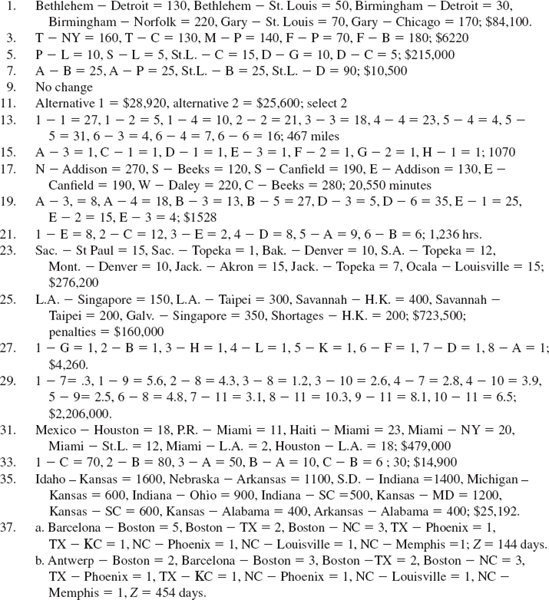
1. Blacksburg
3. last year; yes
5. U.S.
7. Hall; Dayne
9. a. 15.38, 26.67, 40.54; b. decreases; c. yes
11. John
SUPPLEMENT 1
1. a. Mexico; b. China; c. Taiwan; d. Taiwan
3. a. office building; b. parking lot; c. parking lot or shopping mall; d. parking lot
5. a. risk fund; b. savings bond; c. bond fund; d. bond fund
7. a. Widget; b. EVPI = $24,000; c. maximax-widget, maximin-nimnot, regret-widget, equal likelihood-widget
9. major content revision; EVPI = $85,080
11. a. Singapore; b. Singapore
13. $237,740
15. lockers and showers
17. a. stock 28 boxes, $53.50; b. EV = $54.90, EVPI = $1.60
19. press, EV = $10,800
21. a. Gordon; b. Jackson; c. Gordon; d. Jackson
23. medical technology; EV = $187, 501
25. a. Ramon, EV = 112.4; b. probably Terry; c. Ramon, EV = 109.74
27. Hong Kong; EV = $0.724 billion
29. Do not install power generator; EV = $552,000
31. oil change and sample; $400
33. settle; EV = $600,000
35. grower B; EV = $39,830
1. a. 2000: 84.24%, 2001: 80.22%, 2002: 72.28%, 2003: 65.6%, 2004: 58.3%, decreasing trend; b. 2000: 1.71% and 14.05%, 2001: 5.3% and 14.48%, 2002: 13.32% and 14.4%, 2003: 21.97% and 12.43%, 2004. 29.96% and 11.74%; c. 2000: 6.93 and 44.48, 2001: 7.50 and 47.64, 2002: 7.85 and 50.04, 2003: 6.90 and 44.46, 2004: 5.79 and 38.32
3. a. 139.8; b. good = 91.67%
5. 2005: $10.54, 2006: $9.74, 2007: $9.34; 2005–06:–8.21%, 2006–07:–4.22%
7. a. alternative 2, 204; b. alternative 2
9. a. 5.11; b. 5.11; c. 5.58; d. 5.24
11. a. 6.39; b. $32,266
13. w/o defects = 875 units; w/o defects = 761 units.
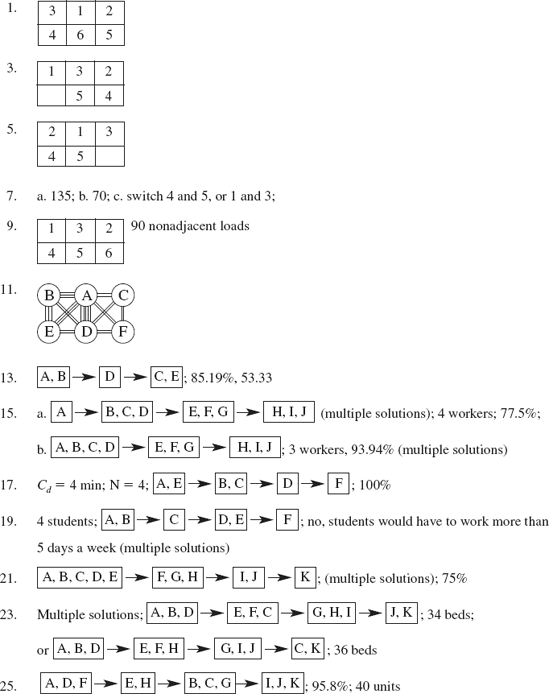
1.
3.
5.
7.
9.
11.
13.
15. a.
17.
19. no pattern
21. pattern may exist
23. patterns exist
25.
27.
29.
31.
33.
35. Cp = 1.27, Cpk = .82
37. process mean = 1125 hr, UCL = 1230, LCL = 1020
39.
41.
43.
45. a.
47. a.
b. Cp = .32, Cpk = 0.36; process not currently capable of consistently achieving desired customer satisfaction.
SUPPLEMENT 3
1. a. n = 131, c = 5, α = .0049, β = .095
3. no; n = 208, c ≤ 18
5. n = 131, c = 5
3. 0.934
5. .994
7. a. no; b. 0.9919
9. a. professional; b. standard
11. 80.65%
13. Airway
15. a. .839; b. .966
1. Lq = 1.33, Wq = 4.80 min; not good service
3. a. Lq = 0.5, W = 0.20 hr, Wq = 0.10 hr; b. λ > μ
5. λ = 9/hr
7. no
9. a. Lq = 5.14 trucks, W = 0.05 day, Wq = 0.03 day; b. yes
11. L = 1.01, Lq = 0.177, W = 0.101 hr, Wq = .0175 hr; yes
13. Yes, assign an operator
15. P0 = 0.005, L = 7.94, Lq = 2.938, Wq = .783, W = 2.11
17. Yes, hire a third doctor
19. 3 servers should be sufficient
21. Add more employees; expected savings = $25.50/day
23. Lq = 1.94, Wq = 0.176 hr
25. Pn≥ = 10 = 0.4182
27. 7:00 a.m. – 9:00 a.m. = 4, 9:00 a.m. – noon = 2, noon – 2:00 p.m. = 6, 2:00 p.m. – 5:00 p.m. = 4
29. L = 0.1476 car out of service, W = 13.52 hr.
31. Select new service agreement, savings = $1813.50
33. Lq = 16.35 manuscripts, L = 27.78 manuscripts, Wq = 2.09 weeks, W = 3.47 weeks, U = 0.952
35. high-speed copier
37. a. Wq = 17.34 min.; b. P(x ≥ 6) = 0.0006
39. 4 registers
41. Wq = 0.31 hr, W = .81 hr, system adequate
43. a. Lq = 1.177, Wq = 2.33 hr, W = 3.82 hr, U = 0.7551; not effective; reduce athletes to 6.
45. 4 cranes
3. 500; $7500
5. 625; $31,250
7. a. 18,118; b. 363 days, 91 days; c. 84 days, yes
9. choose supplier if demand < 800; choose process B if demand > 2000; choose process A otherwise
11. a. > 187 min; b. > 226 min
13. choose provider 1 if claims > 10; choose provider 2 if claims <5; otherwise, choose provider 3
15. choose labor-intensive if units <6667; choose fully automated if units <41,666; otherwise, choose automated
17. choose A if demand <2400; choose C if demand >20,000; otherwise, choose B
19. choose A if rent <20 movies; choose C if rent >40 movies; choose B otherwise
21. choose A > 2000; C < 1000; Botherwise
SUPPLEMENT 7
1. Mall 1 = 62.75, mall 2 = 73.50, mall 3 = 79.50, mall 4 = 67.00; select mall 3
3. South = 73.80, West A = 74.50, West B = 67.25, East = 73.90; select East
5. C = 76, E = 75, D = 74, B = 70, A = 69; select E
7. A = 77.5, B = 75.5, C = 74.25, D = 78.75 select Dowling.
11. x = 19.68, y = 19.26
13. LD(A) = 22,549.4, LD(B) = 20,505.1, LD(C) = 19,640.5; site C
15. x = 1,665.4, y = 1,562.9
17. a. x = 78.8, y = 106.0; b. Seagrove closest, Ashboro better
19. x = 265.33, y = 363.84
21. x = 1559.8, y = 1766.8
1. t100 = 20.5 min; 16,424.1 min per week
3. t60 = 48.89 hr, t120 = 44.98 hr
5. 0.9024
7. t80 = 45.1 sec
9. t136,000 = 3 min per line; 250 lines
SUPPLEMENT 8
1. 4.163 min
3. a. 2.39 min; b. avg. = $4.52/hr, subject = $4.82/hr
5. a. 4.52 min; b. n = 31
7. n = 12.2 or 13 cycles
9. a. 1.383 min; b. n = 7.7 or 8 cycles; c. poorer quality
11. n = 683
13. a. 88.8%; b. 151 more observations
15. 3.946 min
17. a. n = 271
19. a. 347 additional observations; b. 69%
1. Time 10 weeks
3. a. 23 weeks; s1 = 0, s2 = 1, s3 = 0, s4 = 10, s5 = 1, s6 = 0, s7 = 9, s8 = 0, s9 = 11; b. 1-3-6-8
5. 1: ES = 0, EF = 7, LS = 2, LF = 9, S = 2; 2: ES = 0, EF = 10, LS = 0, LF = 10, S = 0; 3: ES = 7, EF = 13, LS = 9, LF = 15, S = 2; 4:ES = 10, EF = 15, LS = 10, LF = 15, S = 0; 5: ES = 10, EF = 14, LS = 14, LF = 18, S = 4; 6: ES = 15, EF = 18, LS = 15, LF = 18, S = 0; 7: ES = 18, EF = 20, LS = 18, LF = 20, S = 0; CP = 2-4-6-7
7. 1: ES = 0, EF = 10, LS = 0, LF = 10, S = 0; 2: ES = 0, EF = 7, LS = 5, LF = 12, S = 5; 4: ES = 10, EF = 14, LS = 14, LF = 18, S = 4; 3: ES = 10, EF = 25, LS = 10, LF = 25, S = 0; 5: ES = 7, EF = 13, LS = 12, LF = 18, S = 5; 6: ES = 7, EF = 19, LS = 13, LF = 25, S = 6; 7: ES = 14, EF = 21, LS = 18, LF = 25, S = 4; 8: ES = 25, EF = 34, LS = 25, LF = 34, S = 0; CP = 1-3-8 = 34
9. CP = 1-3-7-8-10-12 = 15 days
11. CP = a-b-f-h = 15 wk
13. CP = a-d-g-k = 33 wk, σ = 3.87, P(x ≤ 40) = .9649
15. e. CP = 1-3-7-8-10-12; f. 18 months
17. c. CP = b-f-j-k; d. 28.17 wk; e. 0.0113
19. 57.33 days; P(x ≤ 67) = .9535
21. CP = a-c-d-h-l-o-q = 118.67; P(x ≤ 120) = .59
23. crash = cost = $23,250
25. CP = a-d-g-k, crashing cost = $5100
27. CP = a-e-f-g-j-o-p = 91.667; P(x ≤ 101) = .9976
29. CP = a-b-c-g-j-k-l-m; P(x ≤ = 52) = 1.00
31. CP = d-h-i-j-l-m-n = 92.33; P(x ≤ 90) = .348
1. Inventory turns = 14.2; days of supply = 25.94
3. Inventory turns = 18.4; weeks of supply = 2.7
5. (a) year 1: inventory turns = 8, days of supply = 45.7; year 2: inventory turns = 8.3, days of supply = 44.1; year 3: inventory turns = 11.1, days of supply = 32.8; year 4: inventory turns = 12, days of supply = 30.5. (b) marginally improved
7.
9.
11.
SUPPLEMENT 11
1. a. Q = 120.1; b. TC = $15,612.49; c. 12.49 orders; d. 29.14 days
3. a. Q = 292.5; b. TC = $7,897.47; c. 56.41 orders; d. 5.67 days
5. a. Q = 278,971.3; b. TC = $22,317.71; c. 5.07 orders; d. 72 days
7. a. Q = 79, TC = $5,924.53
9. a. Q = 1,264.9; b. TC = $632.46; c. R = 54.79
11. Q = 20,263.88; TC = $486,333.22
13. a. Q = 2,529.8; b. TC = $12,648; c. 4 orders; d. 42.2 days
15. Q = 90,137.52; TC = $3,020.45
17. a. Q = 9.1; TC = $1,095.45; b. Q = 6, TC = $1,193.33
19. Q = 70,000; TC = $56,000; 4 orders
21. Q = 5,000; TC = $68,725
23. Q = 500; TC = $64,704
25. Q = 6,000; TC = $87,030.33
27. Q = 20,000; TC = $893,368
29. R = 30,603.42; safety stock = 2,603.42
31. R = 83,016.7
33. R = 259.2; safety stock = 46.67
35. R = 32.38
37. Q = 122 pizzas, 117 pizzas
41. R = 9.22
SUPPLEMENT 13
1. b. μ = 3.48, EV = 3.65, not enough simulations; c. 21 calls, no, repeat simulation
3. μ = $251
5. reorder at 5-car level
7. avg. waiting time = 22 min
11. avg. rating of Salem dates:2.92
1. a. $2,457, 000; b. $2,367, 000
3. a. $448,000; b. $443,250; c. $367,600; d. $388,400; choose chase demand
5. a. $1,638, 800; b. $284,800; c. $61,400
7. a. $381,600; b. $432,900; no, more work is subcontracted
9. $367,000
11. $1,308, 900
13. $314,000
15. $1,800, 000
17. $451,500
19. $144,700
21. 5; 105
23. 16, 0, 0, 0, 55, 27
25. 85, 13, 0, 28, 77, 95; 6 weeks
27. 2 seats; 1 seat
29. 55 seats
31. 20 trees
33. a. 100; b. 75; c. 43, d. 1
SUPPLEMENT 14
1. a. 6; b. 7; c. 3
5. b. 800; c. day 1
7. $240.80
9. 100 B's, 50 C's, 50 D's, 400 E's, 900 F's, 200 G's, 100 H's, 100 I's
13. order in periods 1–6 for quantities 50, 50, 56, 50, 50, and 50
15. b. 5 days; c. no; d. back panel, side panel, legs, drawer guide
17. a. POQ or EOQ; b. POQ; c. POQ; d. POQ
19. a. Machining 250 hours; Heat treat 500 hours; Assembly 50 hours
1. SS50—SS100—SS50—SS200
3. 4 (these answers are rounded up)
5. 125/hr
7. c; decreases
9. a. 9 kanbans, inventory increases; b. 3 kanbans, inventory halved; c. 14 kanbans, no change in inventory
1. Jones to Nurse 1, Hathaway to Nurse 2, Sweeney to Nurse 3, Bryant to Nurse 4
3. Product 1 to machine B, product 2 to machine D, product 3 to machine A, product 4 to machine C, product 5 to machine E
5. A to Finance, B to Production, C to Customer Service, D to Logistics, E to Sales, F to Marketing Research
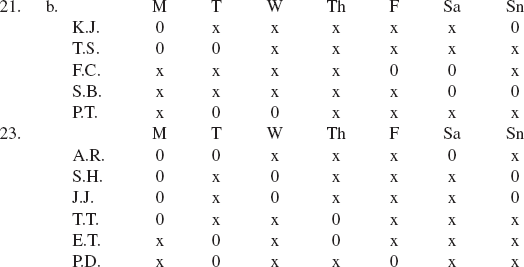
7. FCFS; DDATE or SLACK; Point value of assignment, grade in class, major
9. SPT: 23.88, 9.75, 22, 5; DDATE: 30.75, 8.25, 13, 7; SLACK: 3.63, 9.13, 17, 7; depends on criteria
11. a. 12, 3, 7; b. 12.25, 3.25, 6; c. 13, 3.75, 6; depends on criteria
13. a. 18 hours, b. 20 hours; FCFS
15. E, B, D, C, A; 23
17. 6, 5, 4, 2, 1, 3; 5 hr 35 min
19. Backlog 20, 10, 5, 5, 10