
In December of 2009, six partners in the accounting firm Ernst & Young paid $8.5 million to settle long-standing charges that they failed to see problems at Bally Total Fitness. Bally had overstated its stockholders' equity by $1.8 billion and had understated net losses in its business by approximately $100 million in each of several years. The company had recognized revenue it never actually received from initiation fees and prepaid dues. The partners were charged with failure to spot the warning signs at Bally as it slid from profitability to bankruptcy, but the firm itself paid an even higher price.
The longer such problems go unsolved, the harder it is to turn around a company. To determine the effort needed to turn around any organization, one must understand the degree of trouble and how quickly time is running out; an organizational distress curve illustrates this concept. To help determine where an organization is on the curve, there are early warning signs that signal to a board of directors, investors, and management that action is needed.
Regardless of the cause or nature of a distressed company's struggles, it will invariably find itself somewhere on the curve in Figure 1.1, which demonstrates how companies slide down a slippery slope through five phases: the blinded, inaction, faulty action, crisis, and dissolution phases.[12] If the company cannot fix its problems in any one phase, they will eventually fall to the next one, with less time to repair the damage and greater effort required to do so.
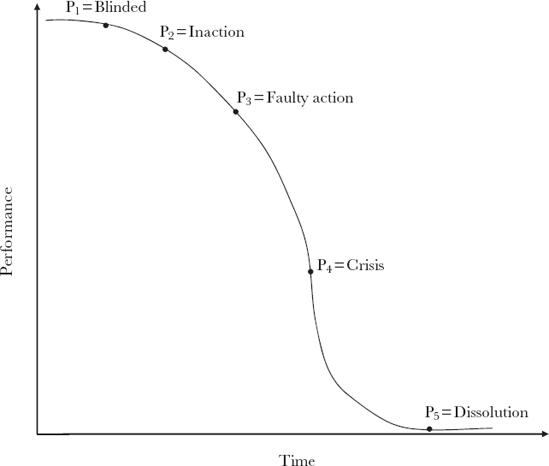
Companies typically begin in the blinded phase. Revenues may have stagnated or even fallen off slightly, but in general, the company has not yet recognized the crisis. Management often writes off one bad quarter—or even two or more—as a blip, only too happy to assume that business will recover in the coming weeks or months. They attribute decreases in sales or profits to seasonal or cyclical variations or temporary customer fickleness, blissfully ignorant of the potentially impending catastrophe. Our examination of Electronic Data Systems in this chapter shows that EDS lay in the blinded phase for years when it overlooked the explosion in popularity of the client/server architecture that would undermine its core competency in the traditional mainframe architectures it served.
Companies in the blinded phase can languish there for months or even for years, as represented by the smooth slope of the curve there. If management fails to take corrective action, however, the company will eventually enter the inaction phase when growth continues to stagnate, competitors steal market share, or cash reserves begin to run low. The company is likely to remain fundamentally sound, and may even be profitable, but its problems have grown to the point at which they cannot be denied. Despite the clear need for action, however, companies often linger in the inaction phase, their inertial resistance to change inspiring irrational hope that things will turn around on their own. For example, Pier 1 took years to react to price competition from Wal-Mart and Target. Such managers often invoke images of past recessions weathered, crying, "This company has suffered through far worse than this," hoping that their previous run of luck continues. The examination of the Middleby Corporation in Chapter Four will demonstrate a company in the inaction phase, as the manufacturer of diversified food equipment remained passive throughout the late 1990s despite excessive concentration of sales to a few very large customers and four years of investment in an expensive, unsuccessful product line.
Other examples of inaction include Schwinn management ignoring the growing consumer preference for lighter mountain bikes, insisting that "people want to ride bikes, not carry them."[13] IBM exhibited comparable denial, saying for years that the Internet was "a university thing."[14]
Sometimes those companies do rebound, but they just as often do not, and instead slide further down the organizational distress curve into the faulty action phase. At this point, the company's problems have grown in severity to the point that management is spurred to action, but due either to inaccurate information or incompetent leaders, these proposed remedies only make the situation worse.
It is not always easy to distinguish inaction from faulty action. A young friend and fellow turnaround professional who prided himself on fast action, once found himself on a new engagement as a chief restructuring officer (CRO) for a struggling company, and decided to take matters into his own hands. Convinced that employees at one of the plants had gotten lazy, he showed up unannounced during the night shift, determined to ferret out the malingerers. He was convinced his actions that night would solve all the company's personnel problems.
He arrived just before the official break time and saw one young man leaning against the wall, daydreaming while everyone else worked arduously. Furious, the CRO demanded the plant manager stop all work and gather the employees together.
In his anger, he emptied his wallet, taking more than $400 in travel money and jamming it into the hands of the young man. "That," he exclaimed, "is all you'll get in severance pay. You wanna sue me? Go ahead! You'll just lose all your legal bills. Get out. Now!"
The young man glanced around, hesitant and confused, and left. With great satisfaction, the CRO measured the shocked look on the other workers' faces—precisely the desired reaction—before asking the plant manager, "What did that loafer do, anyway? The rest of these people should be able to take up the slack."
"He was the pizza delivery guy," the plant manager replied. "He was waiting for me to bring him a tip."
The story quickly became legend among turnaround professionals.
By contrast, when Jamie Dimon took over as CEO of Bank One in Chicago, he sent a clearer, more effective message to the company's executive team. The executive floor was undergoing an expensive renovation and interior decorating. Dimon ordered all work to stop, leaving several executive offices partly spackled or wallpapered for almost a year. That message rang loud and clear to all the bank's employees: Dimon expected everyone to watch spending. His plan to avoid faulty action worked as he went on to take well-planned immediate action to reduce costs while increasing revenue through more responsive service to the bank's customers.
Sara Lee's failed turnaround efforts in 1997 and 2000 both represent faulty action, as the company remained decentralized in critical product and marketing efforts, causing inefficiencies in achieving scale in purchasing raw materials and winning retail space. Similarly, Blockbuster continued to open stores and even attempted to merge with Circuit City (which later liquidated in bankruptcy court), saying that customers wanted to visit stores to make movie rental decisions despite the growing success of the Netflix model. Borders (a spinoff from Kmart) thought the answer to Amazon was to expand their chain internationally, which proved a painfully regrettable decision. Both Blockbuster and Borders focused on continuing and even expanding their business model in the face of a changing competitive environment. They never reexamined their strategy or core competencies, methods described later in this book.
One most often finds faulty action when executives perform across-the-board downsizing without first reexamining the company's strategy, reengineering, or seeking niche markets. These concepts are all discussed in later chapters.
Sustained faulty action will drive a company into the crisis phase. At this point, the company has probably tripped covenants with its lenders and is bleeding cash. Employees are jumping ship, suppliers insist on cash in advance or cash on delivery payment terms, and auditors raise genuine concerns about the company's ability to continue as a going concern. Companies often retain an investment bank to "consider strategic alternatives," or even direct their outside counsel to begin drafting documents for a bankruptcy filing. The examination of Winn-Dixie's 2004 bankruptcy filing in Chapter Six will demonstrate a company "securely" in the crisis phase. American newspapers were also in the crisis phase for years, and still did nothing but cut the people that gather and create its content.
The crisis phase represents a company's last chance to salvage itself and get back on course to profitability. Should all restructuring and turnaround efforts fail, it will descend into the fifth and final dissolution phase, which typically requires a bankruptcy filing. Unable to continue as a going concern, the company goes through painful changes or liquidates its assets and distributes them according to the absolute priority rule that is examined in Chapter Six. This is when the sheriff and locksmiths arrive.
These phases present a valuable framework, because study after study has shown that the earlier a company recognizes itself in one of these phases and launches a turnaround effort, the greater the likelihood of its success. As companies slide down the organizational distress curve, they find themselves in a rapidly tightening noose. In order to maintain breathing space for the greatest number of stakeholders, early detection through the monitoring of the warning signs detailed in this chapter in the section "Early Warning Signs" is critical. If a management team recognizes its problems and begins addressing them earlier, it can take action outside of an atmosphere of panic, before a cash crisis severely restricts its options and before employees, customers, and suppliers begin abandoning it.
Moreover, early detection allows a company to monetize assets at greater than fire sale prices. Whether they decide to pursue a sale of the entire company—perhaps to a "greater fool"—or simply sell a division or product line, management will invariably receive a better price if the market does not yet perceive them as distressed. Similarly, if management settles upon additional financing or refinancing as the solution, it will find lenders significantly more receptive to a company having only experienced mild setbacks rather than one in full-on crisis mode.
Perhaps most important, early action limits the likelihood of managers finding themselves personally liable to stakeholders for the mismanagement of the company. Many American courts hold that a board of directors' fiduciary liabilities shift when a company enters a nebulously defined "zone of insolvency." Some courts define the zone as when the market value of a company's assets is less than its book value of liabilities. Others say it's when the company cannot meet its debts when due. It exists when the organization is in the crisis phase even before hitting the dissolution phase on the distress curve.
Previously bound in their duties exclusively to equity holders, the board's duties shift to include other stakeholders—most notably, to creditors and to the "entity"—once the company enters the zone of insolvency. Should the company subsequently enter bankruptcy, courts will examine transactions as much as five years prior to the filing, particularly those dealing with company insiders, and might possibly void such transactions as fraudulent or preferential. Even outside the context of a bankruptcy filing, the risk of director liability has grown in the past decade, with some institutional investors placing "bounties" on directors and officers by offering a much higher percentage contingency fee to lawyers for every dollar of recovery that comes out of the personal assets of corporate executives and directors who are named as individual defendants. The recent economic downturn and foolish acts by executives have even threatened to weaken that panacea of directors and officers accused of wrongdoing: the business judgment rule.
The business judgment rule used to protect almost every decision made, as it assumed each individual used his or her business knowledge, even if the result appeared stupid in hindsight. The officers and directors of Bally couldn't use the business judgment defense, however, when they ignored the warning signs that the company's policies of high-pressure sales tactics and changing accounting practices were leading to serious problems.
Enron's directors also used the business judgment rule as their primary defense, saying they knew nothing of the deceit created by Ken Lay and his staff. That defense fell and the directors paid millions out of their own pockets when the institutional investors paid a bounty to contingency law firms for getting money out of the directors' pockets rather than the company's insurance policies. The motive was revenge for failing to do their jobs and watch for the warning signs.
At a meeting with institutional investors in late 2008, Justice Carolyn Berger of the Delaware Supreme Court suggested that she and her colleagues—the de facto standard for American business law given the concentration of companies incorporated in the state—would also consider limiting the protection afforded by the business judgment rule with respect to questions of executive compensation. This potential threat to executives of troubled companies, who after all, are the only ones typically sued for professional liability, makes it more important than ever to recognize the earliest possible warning signs of distress and take action immediately.
In order to prevent these internal and external causes of distress from festering until it is too late, effective management teams must proactively look for potential challenges, because the sooner they are identified, the greater the likelihood that management can address them successfully. Companies should remain vigilant by using four major analyses: management analysis, trend analysis, industry analysis, and diagnostic and prediction models.
As the most common cause of internal distress, it should come as no surprise that management of a struggling company should be subject to a rigorous analysis to determine whether it has the personnel and skills in place to handle challenges. First, one should examine whether management is paying attention to critical measures of financial performance, such as true cash flow and working capital management. Without management keeping a keen eye on such metrics, even the healthiest of companies will falter. Many small companies have charismatic CEOs who grow the business through sheer force of will, but who lack adequate financial expertise and all too often resist hiring someone who can provide those complementary skills. Similarly, many middle market companies can coast along through times of prosperity with an absentee principal who prefers to focus on leisure or other business activities. This can put undue stress on middle managers in a downturn or, in a family-held business, on inexperienced second-or third-generation participants in the business who lack the entrepreneur's passion or insight.
Another sign of an unprepared management team is a failure to take responsibility for the firm's performance. If management is constantly pointing fingers at events ostensibly beyond its control, or pitting internal divisions against each other (with manufacturing blaming sales for slow market penetration, sales blaming finance for inadequate funding, and so on), it is probably hiding the real source of problems: itself. Ford and GM were well known for this.
Caterpillar, however, decided to break down the organizational silos, forcing everyone to work together. The silos were based on functional areas such as manufacturing, purchasing, and marketing, each with a senior executive reporting to the CEO. This structure prevented information sharing and individual performance accountability, such that product and plant managers had no idea whether their particular unit or plant was profitable or not. By breaking the silos and scattering the employees into newly created profit centers, behavior changed. Employees were held accountable for results, given agreed-upon profit goals as well as the information and tools they needed, with compensation programs developed to reward them for good performance. As a result, the company went from losing $1 million a day to record profitability.
Constant changes in direction similarly indicate a management team incapable of guiding a company through difficult times. The scattershot acquisition strategy of companies such as Sara Lee constitutes one example of such indecision, which distracts a company from its core competencies. Worse, it obfuscates the company's core principles from stakeholders, such that employees never know which missive from management to follow or whether it will simply be cast aside in six months for a new management fad.
All of these problems tend to be reflected in one difficult-to-measure but critical metric: employee morale. It may require diligent, granular interviews with employees down and across the organizational chart to determine, but once a morale problem is discovered, it must be addressed immediately before it spreads. Turnarounds are challenging enough without the company's best and brightest employees jumping ship for a competitor that they consider more stable.
One of the best ways to determine whether a company is heading for trouble is to analyze the trends in its operating and financial performance. In postwar Japan, Dr. W. Edwards Deming used trend analysis as a way to help then-struggling Japanese car manufacturers produce high-quality products, with the key observation that a trend is often more important than the actual numbers. He proved that constantly measuring critical components and gaps between parts can show a trend that signals that adjustments can be made before any faulty cars are produced. His statistical techniques were later applied to many business control areas.
Table 1.1 shows the deterioration of several key financial performance indicators at Sara Lee from 2001 to 2007, during which time Sara Lee attempted to rebound from its disastrous acquisition binge. Note that even without comparing these figures to comparable companies in the same industry, an astute observer can discern that the company is in trouble, for with few exceptions, the figures all began slipping in 2002, stabilized or recovered slightly in 2003, and then resumed their slide for the next four years. Many companies slide much faster.
Table 1.1. Trend Analysis at Sara Lee, 2001–20074
2001 | 2002 | 2003 | 2004 | 2005 | 2006 | 2007 | |
|---|---|---|---|---|---|---|---|
Interest Coverage[a] | 5.9x | 5.2x | 5.9x | 5.9x | 5.0x | 3.5x | 2.7x |
Gross Margin Operating | 37.4% | 38.5% | 38.9% | 37.9% | 36.2% | 37.1% | 38.5% |
Income Margin[b] | 9.6% | 8.9% | 9.1% | 8.4% | 7.5% | 6.8% | 5.7% |
EBITDA Margin[c] | 10.0% | 11.2% | 12.8% | 12.5% | 11.5% | 11.3% | 10.3% |
Net Margin from Continuing Operations | 9.6% | 5.7% | 6.6% | 6.5% | 3.8% | 2.6% | 3.5% |
Return on Average Assets[d] | 14.7% | 8.4% | 8.1% | 8.2% | 5.0% | 2.8% | 3.2% |
[a] EBIT/gross interest expense. [b] Excludes extraordinary items. [c] Excludes gain on sale of coach brand and impairment charges. [d] Based on income from continuing operations. | |||||||
For public companies, of course, share prices and volumes can indicate growing concern in the marketplace. Large blocks of shares dumped on the market immediately following upticks caused by positive news releases can indicate faltering faith in the company's prospects by institutional shareholders who wish to reduce their exposure. However, share price itself is typically a lagging indicator of distress rather than a leading one, so investors must look deeper within the company to determine its outlook.
The ratios referred to in Box 1 serve as a solid starting point for trend watching. Because in a turnaround one must "manage to cash" as opposed to using GAAP principles, the more stringent cash flow and quick ratios are typically more representative of a company's true liquidity. However, even these metrics are not immune to manipulation, for an aggressive manager can artificially increase accounts receivable (increasing the quick ratio) by stuffing the distribution channel, by selling to less and less creditworthy customers, or by simply changing accounting assumptions.
Regardless of how close to or far from its lender-stipulated thresholds a company is, consecutive quarters of declining current ratio or increasing funded debt to EBITDA should cause concern. The strength of such trend analysis is that it compares a company's performance to its own history, rather than to competitive companies whose idiosyncrasies may make them less than perfectly comparable. For example, a computer or copier manufacturer that also provides post-sale maintenance and repair services to its customers will have higher asset utilization ratios as compared to a pure-play manufacturer in the same industry, for the services component of its revenues may require significantly fewer hard assets to remain operational. Trend analysis uses internal metrics to ensure that all comparisons are made on an apples-to-apples basis over time.
In addition to the metrics frequently used for covenants listed in Box 1, managers should carefully monitor the following profitability and asset management metrics:
Gross margin declines should raise immediate red flags; they require examination into whether they occur at the company, divisional, or product-line level. Eroding margins can indicate a larger problem such as increased competition, increasing returns or product failures, or growing consolidation among customers. It's especially important in a turnaround situation to look at actual gross margins rather than merely the margin reported by the sales or accounting departments. Short-sighted sales representatives giving back-end discounts, improper allowances for returns or volume incentive rebates, and inaccurate allocation of shipping or overhead costs can distort the company's perception of its true gross margin, thus masking such declines.
Profit margin declines may result from a decrease in top-line revenues, or an inability to pass on increased input costs to customers. In addition, they could result from a negative change in the product mix, with demand shifting from higher-to lower-margin products, possibly indicating cannibalization by the cheaper product.
Sales declines can result from a general loss in market share, competitive pressures, changes in customer preferences, or quality problems.
Negative cash flow quarters are also a significant cause for concern, as they can quickly cause liquidity shortages. It is important to look to true cash flow rather than EBITDA or a GAAP proxy for cash flow, for it is too easy to use such measures to hide the company's true ability to generate cash.
Declining tangible net worth indicates a company's dwindling asset base, or a stagnant asset base outpaced by the company's growth in additional liabilities. By stripping out intangible assets such as goodwill, noncompete agreements, and trade secrets, a manager can get a clearer picture of the company's actual cash-generating assets.
Growth in accounts receivable faster than real sales increases can indicate a host of problems, as it implies that a company is incurring costs in manufacturing and delivering products without the corresponding inflow of cash to keep the company afloat. This could result from slower turnover when struggling customers try to extend payment terms to conserve their own cash, or from an increase in receivables dilution. So-called "big box" retailers such as Wal-Mart have earned a notorious reputation for finding the slightest problem with shipped goods—a label out of place or a pallet missing the proper identifying tags—to shave off as much as 10 percent of the agreed-upon price for the shipment. This taking of discounts after the fact is known as dilution, and it can strangle a cash-hungry company. Meanwhile, growth in accounts receivable exceeding a company's sales growth can indicate that sales staff are selling to less and less creditworthy customers, perhaps desperate to move product out the door. Finally, aged receivables (those older than, for example, ninety days) can point to serious problems lurking around the corner, such as deadbeat customers, customer disputes regarding product quality, or even fraud.
Inventory levels must be monitored religiously to ensure that existing inventory has not become obsolete. Frequently, companies fall in love with their own products, seemingly content to let them sit on the plant floor taking up space even if the company has overproduced a certain model, received a high number of returns on a defective product, or customer preferences have shifted to a new competitor. Such companies may be afraid to liquidate inventory because it could result in a write-down, particularly if they are personally compensated based on GAAP measures such as net income. Managers must pay close attention to changes in the rate of inventory turnover and in inventory composition, and make the necessary adjustments both to the balance sheet and to the physical location of the inventory. For example, Schwinn's inventories exploded despite flagging sales, partly because its Budapest plant's low quality killed sales. Schwinn's local advertisements, translated into Hungarian, read, "Buy Schwinn bikes: They're not as bad as you think." Under Hungarian law, the plant had to remain operational regardless of sales, so workers simply threw the poorly made bikes into the river behind the plant.
Accounts payable that increase faster than sales and total cost of goods sold indicate a company has begun stretching out its payments, which could make it more difficult to retain suppliers in the future.
Revolving loan balances can show a company's ability to finance itself through cash generation instead of borrowing. If the company's revolver balance is increasing (and it is not related to or is greater in magnitude than the usual seasonal increases) and it is faced with decreasing availability, then a near-term cash crunch is highly likely. As shown in Chapter Three, Sunbeam's increasing revolver balance should have served as a warning that CEO "Chainsaw" Al Dunlap's claims to have sold large numbers of outdoor gas grills during the winter was false.
In addition to monitoring trends in a company's own performance, managers should use benchmarking to see where a company stands in relation to its peers. Though no set of comparables will ever be perfectly equivalent, it is valuable to see how a company is performing compared to the best, mean, or median performers in its field. For example, Figure 1.2 in the Introduction clearly shows that Sara Lee's sales, general, and administrative overhead costs (SG&A) as a percentage of sales had grown to among the highest in its peer group, suggesting that it should examine ways to reduce corporate overhead. While it might not ever reach the 15.9 percent figure attained by Conagra, it should certainly aim to reach the median range of 21 to 24 percent achieved by Kraft, Heinz, and Campbell Soup.
Other industry analyses can determine the likelihood of performance deterioration by measuring the concentration of customers' buying power and the company's sensitivity to increased input costs. Typically, a Porter's Five Forces analysis serves as a solid groundwork, examining supplier power, technology development, buyer power, new market entrants, and competition. Note that a company's distress makes it increasingly important to conduct the analysis not as a snapshot of the industry in time, but rather one that looks to the next twelve months.[16]
Finally, several diagnostic and prediction models exist to assist in the analysis of a company's situation. Naturally, these models work on a "garbage in, garbage out" basis, so any inputs, such as financial data, must be heavily scrutinized to ensure that they drive the proper conclusions. (See Box 2, this chapter, for an example of how creative accounting information can skew reported results.) This can be especially difficult at private companies, where accounting controls are often more lax, and cozy (or even familial) relationships between the board and the CFO can slow or block the flow of information.
Once the reliability of financial information is verified, managers can use the most famous predictor of financial distress: the Z-score, developed by Dr. Edward Altman, a professor of finance at New York University. Altman created this analytical tool by running a massive logistic regression of various financial data against a binary variable to indicate whether a firm would file for bankruptcy protection. Altman's work ultimately resulted in the following equation, which produces a single "Z-score" that predicts the likelihood of the company filing for bankruptcy within two years.
As you can see, each of the five components (X1–X5) of the Z-score represent internal ratios measuring the company's liquidity, leverage, profitability, market valuation, and asset turnover. The final outcome is the Z-score, which practitioners can apply to the matrix in Table 1.2 to determine the likelihood of bankruptcy.
Altman has since determined that U.S. businesses have grown more risky than when he first created the Z-score in 1968, and so he has fine-tuned this three-zone model into one that assigns a bond rating equivalent (BRE) to a range of scores. These scores have changed over time, as pictured in Table 1.3.
The power of the Z-score stems from its basis on empirical data, which has fueled its popularity as an indication of financial stability. The metric has become so widespread that Bloomberg terminals now list Z-scores for every company that files its financial statements publicly, and Altman himself testified before the House Financial Services Committee during the hearings on whether General Motors required a governmental bailout. Upon running his Z-score analysis, Altman determined that upon emerging from bankruptcy under the restructuring plan then on the table, General Motors would be likely to file for bankruptcy again (so-called "Chapter 22"), so the reorganization plan was supposed to be expanded and improved until the reformed entity would be more viable in preparation for an initial public offering (IPO).
Table 1.2. Original Z-Score Interpretations
Score | |||
|---|---|---|---|
Z-Score Results and Interpretations | Publicly Held Manufacturing Company | Privately Held Manufacturing Company | Non-Manufacturing and Emerging Market Companies |
Low Probability of Bankruptcy | ≥3.075 | ≥2.90 | ≥2.60 |
Company Requires Monitoring | 1.875–3.075 | 1.23–2.90 | 1.10–2.60 |
Insolvency Likely Within 12 Months | ≤1.875 | ≤1.23 | ≤1.10 |
Table 1.3. Revised Bond Rating Equivalent Z-Score Interpretations
Rating | 2004–2005 | 1996–2001 | 1992–1995 |
|---|---|---|---|
Source: Cole-Gomolski, Barb, "Client/Server Outsources Changing Pricing Methods," Computerworld, June 28, 1999. | |||
AAA | 5.31 | 5.60 | 4.80 |
AA | 4.99 | 4.73 | 4.15 |
A | 4.22 | 3.74 | 3.87 |
BBB | 3.37 | 2.81 | 2.75 |
BB | 2.27 | 2.38 | 2.25 |
B | 1.79 | 1.80 | 1.87 |
B– | 1.34 | 1.31 | 1.38 |
CCC+ | 0.90 | 0.82 | 0.89 |
CCC | 0.45 | 0.33 | 0.40 |
D | −0.19 | −0.20 | 0.05 |
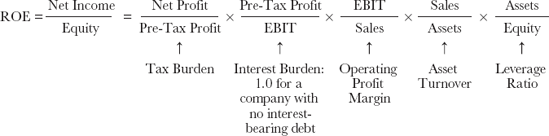
Practitioners can also use the DuPont analysis to examine the sources of a company's return on equity (ROE) to reveal both strengths and areas of weakness. This calculation is pictured in Figure 1.2.
Each of these five components provides helpful information as to how well the company performs a financial task, particularly in conjunction with the trend analysis and benchmarking already described. If a disproportionate amount of the company's ROE is coming from the leverage ratio, for example, it is poised to suffer disproportionately in a downturn. Similarly, an asset turnover ratio below industry norms would suggest that the company is using its assets inefficiently, and should either devise a way to use them to drive additional revenues or strip out the assets that do not support sales.
A related measure of profitability is ROA, or return on assets, which is simply calculated by dividing net income by total assets. A downward trend obviously signals impending peril and should be compared to other companies in the same industry. A general rule of thumb for all industries, however, is that ROA should exceed the company's weighted average cost of capital (WACC). If ROA falls below WACC, the company must determine whether it makes sense to continue in certain business lines or to undergo an organizationwide overhaul and refocusing.
Performing such analyses would have revealed looming financial difficulties at Canadian cinema chain Cineplex Odeon in the late 1980s. Careful review of the company's financials shows that CEO Garth Drabinsky was steering the company toward bankruptcy and hiding it through a variety of financial shenanigans. The company's board of directors ignored the warning signs of accounting method changes, plummeting ROA, low Z-score, and others, and the company later went into bankruptcy along with another theater company with which it had merged. A colorful character who once barbwired the entrance to a competitor's office building under cover of darkness, Drabinsky was later indicted for "cooking the books" at Live Entertainment and will serve seven years in prison for fraud and forgery.
Finally, there are several other indicators that can identify a company entering a period of distress. Excessive staff turnover suggests that employees are fleeing a sinking ship, and unfortunately, those who leave are typically the best, most qualified employees because it is they who can most easily find comparable positions elsewhere. Aside from the costs of plummeting morale that result from good people leaving, such turnover can create a painful cycle of lost organizational knowledge, thus making it difficult to train new hires to replace those who have left. In addition, newly constructed lavish headquarters during a period of declining profitability should serve as a red flag by indicating that management has become complacent, distracted, or overly concerned with perquisites rather than creating shareholder value.
Companies who have recently changed accounting firms also deserve scrutiny, as such changes often result from a quarrel over the veracity of the company's financial information. The auditor may have gone so far as to notify the company that they would have no choice but to issue a letter questioning the firm's ability to continue as a going concern, thereby prompting their dismissal. Threats of delisting are another obvious sign of distress for public companies, as they result from failing to meet minimum share price and volume levels.
There are many examples of companies that slide down the entire distress curve, in spite of warning signs along the way. Chapter Six of this book examines a number of them. By contrast, there are companies that manage to stop the plunge, even if it takes multiple tries. One example is EDS.
Launching the company in 1968 with a $1,000 loan from his wife, Ross Perot received seventy-eight refusal letters before landing his first client for Electronic Data Systems. He persevered, and the company's success resulted in its $2.5 billion acquisition by General Motors (GM) in 1984.
After years of success, EDS began a multiyear slide down the distress curve. EDS's historical expertise in legacy mainframe systems and their programming languages created a strategic mismatch with the rapid adoption of the client/server model in the 1990s[17] and blinded management to the wide-scale introduction of personal computers into the workplace. GM spun off EDS in 1996, signing a ten-year, below-market contract with its former subsidiary.
During the Internet explosion of the late 1990s, EDS quickly came to represent a plodding, technologically backward relic of the dismissively labeled "old economy." EDS also failed to move quickly on the massive outsourcing contracts awarded to address the problems anticipated from reaching the year 2000 to avoid causing computers that abbreviated years with double-digits to malfunction.
Competitors swooped in to take advantage of these strategic blunders. This competitive pressure resulted in steady market share declines for EDS. In response, EDS began bidding more aggressively on the increasingly frequent multibillion-dollar "mega-deals." Lack of bidding discipline by EDS management—particularly CEO Les Alberthal—had focused on just getting contracts signed, no matter what the profitability; they would worry about red ink later.[18]
Several warning signs should have alerted observers that EDS faced an upcoming crisis in the mid to late 1990s; these can be grouped according to the four types of analysis that could have been used to detect them.[19]
Management analysis. The most common cause of internal distress is weak management. The complexity of EDS's operations clearly overwhelmed Alberthal, such that he overlooked critical changes in the marketplace. Moreover, his detachment from the workforce grew, as exemplified by his inexplicable decision to cut the phone lines in his office to prevent distractions or complaints.
Trend analysis. EDS significantly underperformed during one of the greatest sustained bull markets in history, at a time when competitive technology services providers thrived. Operating cash flows stagnated and operating margins plummeted to 6.6 percent despite a booming economy during this time. Meanwhile, debt increased at an 18 percent annual rate and accounts receivable increased at a 20 percent rate, both much faster than any growth in sales. These trends clearly denote an organization on the decline.
Industry analysis. Due largely to weak, disconnected management, EDS completely missed critical industry changes such as the emergence of the client/server architecture, the run-up to the Y2K bug, and the Internet explosion. As a result, EDS's market share plunged to just 7 percent in 1999.
In response, the California Public Employees' Retirement System (CalPERS), a large shareholder, added EDS to its annual list of the worst corporate performers based on corporate governance and stock performance, and began publicly questioning the board's role in EDS's governance.[20] With morale tumbling and shareholders crying out for a change, EDS's board of directors decided a new CEO was needed. Questions should be raised as to why the board failed to take action sooner, for it took a revolt by shareholders to prompt Alberthal's removal.
The board then hired Richard Brown as CEO. Brown came to EDS from Cable & Wireless PLC, where he had negotiated and integrated twenty-one merger transactions in just twenty-nine months as its CEO. Brown's aggressive pursuit of acquisitions had left Cable & Wireless's cash flows flat during his tenure despite a 27 percent growth rate in top-line revenues and a 7 percent growth in net income, as acquisitions depleted the company's cash balance by some $2.5 billion during his tenure. None of this bothered the EDS board at the time.
At EDS, Brown found an organization whose rapid growth had created a sprawling, inefficient operation with forty-eight distinct business units. The company's internal complexity frustrated employees and confused clients, who often found themselves receiving sales calls from several different units with duplicative and sometimes conflicting offerings, thus revealing EDS's failure to go to market with a clear, cohesive strategy.
Brown found that he could not access monthly financials because of poor internal systems. He even found e-mailing all of EDS's 140,000 employees impossible, as haphazard growth had led to their using sixteen different e-mail systems, including free online services such as Hotmail and client systems.[21]
Amid the chaos resulting from his ironic efforts to bring a technology company kicking and screaming into the Internet age, he described his four-point plan to return the company to profitability. First, he vowed to push EDS's revenue growth. Second, he would pair this growth with nearly $1.4 billion in cost-cutting, including laying off employees, selling half of its corporate aircraft, and eliminating its 2,000-vehicle executive car program.[22] Third, he would personally oversee the GM contract and stabilize its decreasing margins. Fourth, he would focus on organizational change.
Already depressed by EDS's fall in its traditional IT outsourcing business, employee morale suffered further as Brown laid off a total of 15,300. Meanwhile, short-term financial performance suffered as Brown's turnaround resulted in more than $1 billion in recorded restructuring charges and asset write-downs in 1999 alone.
However, just as Brown tried to lead the company back to growth and profitability, storm clouds brewed on the horizon, with critical mistakes by the new CEO ultimately undermining EDS's competitiveness, plunging EDS down the faulty action phase of the distress curve. EDS failed to anticipate the growth of Indian outsourcing and allowed new entrants to gain significant footholds in a market that demonstrated explosive growth both before and after the turn of the millennium. By overlooking the rise of offshoring, Brown's EDS found its market share slipping in the face of brutal pricing pressure.
On October 6, 2000, EDS won the largest IT outsourcing contract in the history of the U.S. federal government: the Navy/ Marine Corps Intranet, or NMCI. The eight-year, $6.9 billion project sought to integrate 400,000 workstations, 500,000 laptops, and 1,000 internal networks across one secure, integrated voice and data platform, with universal sign-on capabilities and a single, unified help desk.
Unfortunately, warning signs emerged even before the project's launch. Eager to win such a high-cachet project, Brown had insisted on a razor-thin 4 percent margin, cutting the initial $8.6 billion bid by $1.7 billion despite the CFO's admonition that the NMCI contract would not be profitable. Even more ominously, the revamped bid included deferred payment terms that required Navy approval for any disbursement. In effect, EDS would have to invest $1.9 billion in infrastructure merely to begin the project, would pay out cash for many years after that, such as buying and holding thousands of laptops for two years (during which time they became obsolete), but could not receive payment until the Navy expressed its satisfaction with end-user systems.[23] In order to fund these payments, EDS levered up its balance sheet, increasing total debt from $1.2 billion at Brown's hiring in 1999 to $5.4 billion in 2002.
Then the project's execution went awry. Many end users expressed such frustration with the project's delays and unfriendly user interface that EDS created that they relied on commercial e-mail services for official communiqués rather than their NMCI-issued accounts.[24] As you might expect, an organization as security-conscious as the Navy was not shy about expressing its dissatisfaction with EDS's performance.
Other projects also went wrong. EDS's eleven-year $6 billion network services arrangement with WorldCom left it with significant exposure to the telecom's bankruptcy. A Texas attorney general's report concluded an EDS subsidiary had violated its contract with the Texas Medicaid program and had engaged in improper accounting, double-billing, and inappropriate payments to providers,[25] which called into question EDS's ability to retain contracts with the sixteen other state Medicaid programs it listed as clients. There were also market concerns over the company's exposure to the airline industry's collapse—particularly a complicated airplane leaseback arrangement with United Airlines that unraveled when the airline filed for bankruptcy in December, costing EDS $40 million in write-downs.
Brown refused to acknowledge even the possibility of problems, going so far as to single naysayers out as "quitters." Delivering bad news to Brown met only with denials and reprisals. While Brown seemed blinded to the problems, in reality his mismanagement led the company further down the organizational distress curve by taking faulty actions that exacerbated problems.
Management analysis. Much of the blame for EDS's failure to anticipate and respond to the growth of the outsourcing market falls at Brown's feet, as does the blame for EDS's overlooking the growth of the Business Process Outsourcing (BPO) market. Furthermore, the emergence of overly aggressive accounting policies suggests weak managerial control and a refusal to listen to and deal with bad news. Finally, Brown's obsessive pursuit of zero- or even negative-margin mega-deals crippled the company. Brown's insistence on winning the NMCI contract can be considered his Waterloo, a fatal misstep that is not without irony, given the lessons EDS should have learned about market share grabs under Alberthal.
Trend analysis. The effects of Brown's mismanagement were masked slightly by the explosive growth of the IT market from 1998 to 2001. Once the tech bubble burst, however, EDS went into free fall, with operating margins falling to 2.9 percent in 2003, while debt climbed.
Industry analysis. As previously stated, the growth of competitors represented a seismic shift in the industry, one to which EDS failed to respond properly or in time. EDS was bleeding cash and customers when the industry was growing at a rapid pace.
Based on these warning signs, EDS found itself deep in the faulty action phase of the organizational distress curve, with its debt load, negative cash flow, and customer discontent pulling it into the crisis phase of the organizational distress curve. When the board appointed Brown as CEO, it knew that Brown had negotiated twenty-one merger agreements in just twenty-nine months as CEO of Cable & Wireless PLC, which should have undermined his credibility as the right person for the job of uniting a sprawling, inefficient organization. Also, one should question the board's governance role throughout Brown's tenure at EDS, for it appears that the board failed to take its fiduciary duties seriously. For example, it surely had to approve the aggressive bidding on the NMCI project and its required $1.9 billion in capital expenditures, with no corresponding cash inflows expected for years.
With shareholders again threatening to revolt, EDS's board of directors finally took action, announcing in March 2003 that it would replace Brown. After paying Brown's $30 million severance package, EDS hired Michael H. Jordan to right the ship.
Jordan set about fixing the dozen problem contracts that it designated as critical accounts and immediately reassigned some of EDS's best engineers and managers to the NMCI group in order to restore accountability. Jordan renegotiated contract terms in an effort to speed agonizingly slow cash collection, and exited others.
Management under Brown had allowed the company's costs to spiral out of control, adding to the pressure that overly aggressive bidding put on its margins and undermining its ability to compete for other contracts. Jordan made drastic changes: he centralized EDS's procurement activities, reduced surplus labor, and moved jobs—including EDS's own employee help desk—to India and Eastern Europe. He moved to standardize and automate processes and tools, thus reducing costs across the board and resulting in savings of more than $1 billion a year through better purchasing, $1 billion through more efficient data center capacity utilization, and $1 billion through more than 20,000 layoffs.[26] He further restructured sales team processes, replacing Brown's mantra of pampering the client at any cost with a philosophy of charging additional fees for any customized service outside of EDS's standardized product offerings.
Jordan also took the opportunity to raise cash and pay down the debt Brown took on by exiting myriad business units and subsidiaries that did not fit in his vision of EDS's future core business strategy, such as the divestiture of A.T. Kearney, the fourth largest management consulting firm in the world, acquired by EDS for $600 million in 1996. The envisioned synergies failed to develop. Kearney had negative $10 million in operating income, so Jordan cut EDS's losses through a buyout by the consulting firm's partners in 2006. Although it raised only $52 million in cash, it eliminated an underperforming division and refocused EDS on its core businesses. Between 2004 and 2006, Jordan raised more than $2.8 billion from divestitures, which eased the company's liquidity crisis and reduced its leverage significantly.
Finally, EDS focused on working capital improvements such as shortening its receivables collection period, which drove a steady increase in free cash flow. As of December 31, 2006, the company had total positive liquidity of approximately $3 billion, a stark contrast with the $5.3 billion in debt under Brown's tenure.
In order to grow the IT outsourcing business and catch up to low-cost competitors such as Wipro and Infosys, Jordan announced that EDS would pursue a "best-shoring" approach, which incorporated a combination of offshore, onshore, and near-shore services in client contracts. Jordan refocused EDS's remaining employee base on its core outsourcing business, stating that "the concepts of low cost and high value must be present in every action we take, in every service we provide, in every piece of new business we pursue."[27]
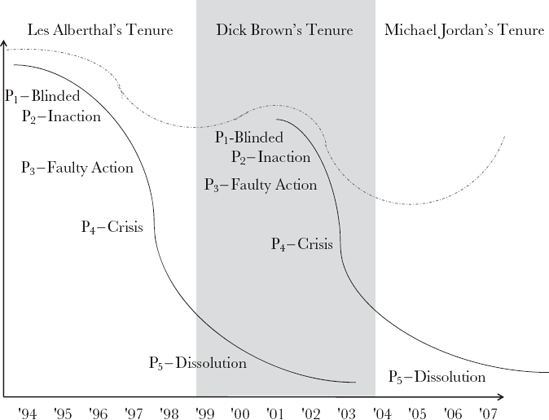
EDS's twin turnaround efforts created an unusual situation wherein the company descended down the organizational distress curve into inaction, at which point the board replaced CEO Alberthal with Brown. As the case illustrates, Brown righted the ship temporarily—although one could argue that the go-go atmosphere of the late 1990s contributed as much to EDS's brief resurgence as did his leadership—before his mismanagement led the company onto a new organizational distress curve, where it became blinded to new problems, remained inactive in the face of them, and even began taking faulty actions that exacerbated those problems, such as repeating Alberthal's mistakes of overbidding for "mega-deals" that boosted the company's stock price by means of razor-thin margins on top-line growth only. As such, EDS actually rode two different organizational distress curves, as illustrated in Figure 1.3. Despite leading the company out of inaction on the first organizational distress curve to a record-setting 2001, Brown's overbidding on the NMCI contract and aggressive accounting policies led the company down a second curve into faulty action, such that only his replacement with Jordan could return the company to stable growth (and ultimately its acquisition by HP). Had Brown been permitted to remain as EDS's CEO, it seems possible that the company would have slid further down the curve into crisis, and possibly even dissolution.
Any organization that gets into trouble, even if just underperforming compared to its peers, goes through several phases, some at a much faster pace than others. Understanding where one is on the organizational distress curve gives one an idea of how long a company has to fix its problems and what resources must be brought to bear in order to do so. Recognizing the warning signs and taking the correct actions are critical to stopping the slide down the curve. The next chapter examines the three elements necessary to begin any successful turnaround process.