
CHAPTER 8
Patterns and Antipatterns: Know Your Mark
In the movie Rounders the climactic scene takes place between Matt Damon as a young card shark and a menacing Russian mobster called Teddy KGB, played with slouching malevolence by John Malkovich. Damon and Malkovich are playing high-stakes poker in a garishly lit New York private club and Damon is about to call when he sees Malkovich twist open an Oreo cookie and calmly lick out the middle in a casual gesture of self-satisfaction. Damon hesitates and then quickly folds.
Stunned, Malkovich's character blurts out angrily, “No! you were supposed to bet!” Damon of course goes on to win the game, recover all his money, and head to California to reunite with the girl of his dreams and live happily ever after. Why did Damon withdraw his bet at the last moment? Because the exact same dynamic occurred at the beginning of the movie when Teddy KGB devoured the Oreo cookie in the same manner just prior to setting Damon up and winning all of Damon's life savings. This time the Damon character caught the move before falling into Malkovich's trap.
In poker this practice of looking for key patterns of behavior is called “reading a tell,” and world-class poker players are masters at not only playing the cards but also observing their opponents’ physical moves for any potential clues to the strength of their hands. So, for that matter, are master con men and master magicians. There once was a wonderful New Yorker article on Ricky Jay, a virtuoso magician who in recent years has become a solid character actor in movies and television, including HBO's Wildwood. Another magician, an expert at his craft, was stunned at how Mr. Jay was able to pull a complex magic trick on him. “He must have marked me,” he says of Mr. Jay, meaning that Ricky had carefully observed the man's behavior and then taken advantage of his habits to set up the magic trick.
In every life situation where only imperfect information exists, observation and pattern recognition are critical to successful decision making. Technical analysis is no different. Common price patterns exist and repeat themselves endlessly. In fact, as I once wrote in an article, “For anyone who has ever actually watched price flow on a tick-by-tick basis for months on end, what soon becomes strikingly clear is not the wild randomness of price patterns, but their mundane repetitiveness.” Indeed, the common technical formations are all well known and have long ago been classified. This chapter focuses on not only the basic trading patterns that all technicians look for in the FX market, but also their “antipattern” counterparts, because in order to trade patterns successfully, the well-versed technical trader must also understand how these price patterns can fail and often morph into completely different technical setups.
DOUBLE TOPS AND DOUBLE BOTTOMS
No chart pattern is more common in trading than the double bottom or double top. This pattern appears so often that it alone may serve as proof positive that price action is not as wildly random as many academics claim. If you believe, as I do, that at their core price charts simply express trader sentiment, then double tops and double bottoms represent a retesting of temporary price extremes. If prices were truly random, why do they pause so frequently at just those points? To technically oriented traders the explanation lies in the fact that many market participants are keenly aware of these levels and they serve as clear demarcation lines between the bulls and the bears.
Double tops are characterized by their M shape on the price charts, while double bottoms simply flip the pattern and form a W (see Figures 8.1 and 8.2). The classic double bottom pattern forms when prices finally find some support and begin to bounce. At this point traders who were lucky enough to be short and rode the price action all the way down may begin to cover their positions. The shorts will do so because they want to make sure they lock in their substantial profits. As their buying proceeds, pushing prices up, they will encounter selling from the lucky bottom-fishing longs who are looking to flip their positions for quick gains. Additionally, as prices rise all of the trapped longs who got caught in the downdraft may now find themselves at or near their break-even points and may join the selling spree to liquidate their positions at a minimal loss.
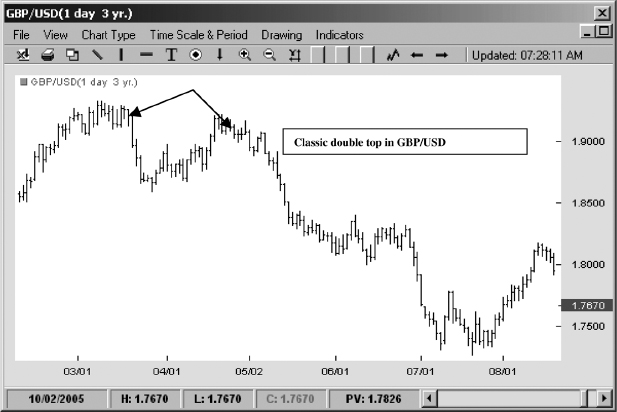
FIGURE 8.1 Double Top in GBP/USD
Source: FXtrek IntelliChart™. Copyright 2001–2005 FXtrek.com, Inc.
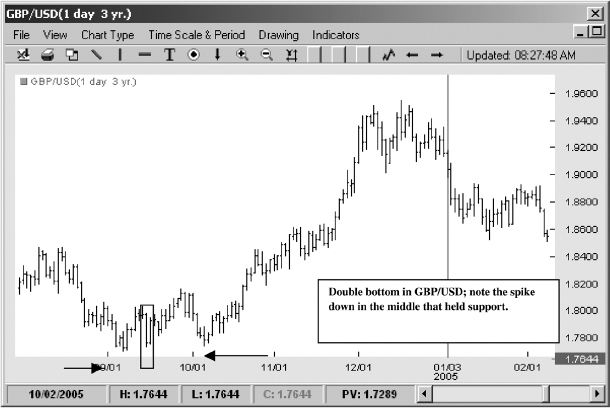
FIGURE 8.2 Double Bottom in GBP/USD
Source: FXtrek IntelliChart™. Copyright 2001–2005 FXtrek.com, Inc.
The net effect of this tug-of-war between the short-covering bears and the liquidating bulls is that the price rarely makes it back up to the original point of its decline. Frequently it may peter out at the 38.2 or 50 or 61.8 Fib levels of the amplitude of the original impulse move (see Figure 8.3).
Prices will then turn back down and may once again find support at the prior low. This time, however, the longs who purchase at these levels typically tend to be longer-term, more value-oriented players who, having observed the initial bottom, will now view it as a solid reference point for support and will likely make a powerful stand at that level. Furthermore, the scared longs who liquidated their positions on the first counterrally up will no longer add selling pressure to the currency, as they are now sidelined in cash. In fact, in watching the price action a few of them may even reenter the market on the long side as they see their initial bias become corroborated by the price action. Buying pressure will also build up from the long-standing shorts, who will realize that directional power has inexorably returned to the longs and will now want to get out for fear of seeing their winning positions turn into losers. Finally, as prices clear the point from which the decline originated, the last few profitable shorts will capitulate and price will break above, completing the double bottom formation (see Figure 8.4).
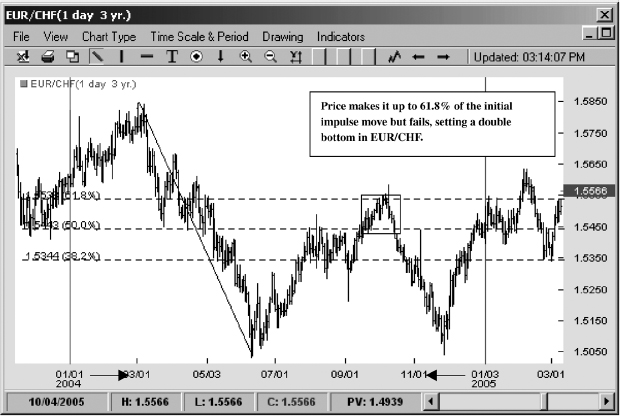
FIGURE 8.3 Double Bottom with Fib Retracement in EUR/CHF
Source: FXtrek IntelliChart™. Copyright 2001–2005 FXtrek.com, Inc.
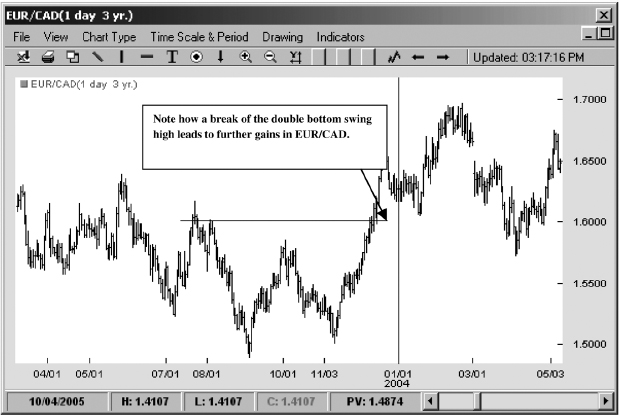
FIGURE 8.4 Double Bottom Breakout in EUR/CAD
Source: FXtrek IntelliChart™. Copyright 2001–2005 FXtrek.com, Inc.
The process of course works the exact same way in reverse for double tops. In that case directional power moves to the bears instead of the bulls as long directional momentum eventually wanes. In both examples it is very clear to see how the interplay between the longer-term, more value oriented players and the shorter-term speculators on both the long side and the short side creates a dynamic that carves out these patterns on a regular basis.
TRIPLE TOPS AND BOTTOMS AND THE ANTIPATTERN
Triple tops and triple bottoms are simply extensions of the double bottom/top price action. Though far rarer, triple tops and bottoms connote uncertainty and a sense of equilibrium between the bulls and the bears as neither party is strong enough to dominate directions. What makes triple tops and bottoms interesting and at the same time dangerous for the technically oriented trader is the possibility that these reversal patterns can morph into consolidation patterns that will provide further fuel for continuation of the trend. This is why traders must be keenly aware of how a double or triple top can turn into a consolidation and a possible further breakout. Note in Figure 8.5 how what initially appeared to be a double bottom slowly turned into range, which eventually broke to the downside as support gave way and the initial downward impulse move resumed its direction.
Because the double top/double bottom pattern that foreshadows a reversal in price can easily turn on the trader and instead become a continuation pattern it is vital to a implement a logical plan of action to deal with all the possible contingencies before putting on a trade. There are a variety of approaches to how to trade the double top or bottom, each with its own advantages and drawbacks. Choosing which approach works best is far more a function of trader personality than of the validity of the setup. The critical factor that one must remember is that regardless of which trading style one adopts, the trader must respect the logical assumptions of the scenario and immediately liquidate the position once those assumptions are violated. Traders can be either anticipatory or reactive when trading double tops or double bottoms.
An anticipatory trader would simply assume that the price will find support on the second foray lower and will place his buy order as close as possible to the original bottom and expect that buyers will materialize and will rally the currency pair higher. This is akin to standing in front of an oncoming train and hoping that the engineer will hit the brakes fast enough for the train to stop before running you over. Needless to say, this is a very low-probability setup. However, when successful this type of trade can be very profitable as the risk-to-reward ratio is very favorable. If the trader is correct, then he has essentially picked the bottom and his first technical level of resistance is the midpoint of the W as seen in Figure 8.6. His next level is the original point of decline. On the daily charts, as we can see in this GBP/USD formation, the move can be as strong as 1,000 points, while the risk is only about 100 points below the first low. With such favorable odds the trader can be wrong as many as nine times in a row and still make a profit over the long run. However, anticipatory traders must be highly disciplined with their stops. Because this type of trade frequently fails, they cannot afford to lose a large amount on any given attempt. The logic behind this setup is that the trader anticipates a bounce. If no bounce materializes, then the trade is no longer valid and for traders who insist on staying in the trade only rationalizations remain.
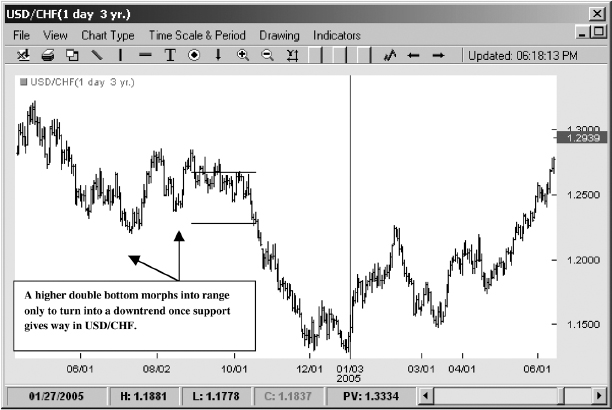
FIGURE 8.5 Double Bottom Becomes Range in USD/CHF
Source: FXtrek IntelliChart™. Copyright 2001–2005 FXtrek.com, Inc.
One of the more frustrating aspects of this approach is that prices will frequently slide below the trader's tight stop only to quickly recover and resume the reversal. Sometimes this process will happen more than once, triggering multiple stops as the anticipatory trader struggles to establish a position. This occurs because many other players in the FX market, including dealers and hedge funds, are perfectly aware of these levels and will gladly go on stop-hunting expeditions to shake out the weaker hands. Nevertheless, traders who decide to relax their stops in response to this price action will pay dearly as it takes only one serious break of support to catch the trader unawares and quickly generate losses of 4, 5, even 10 times his original risk.
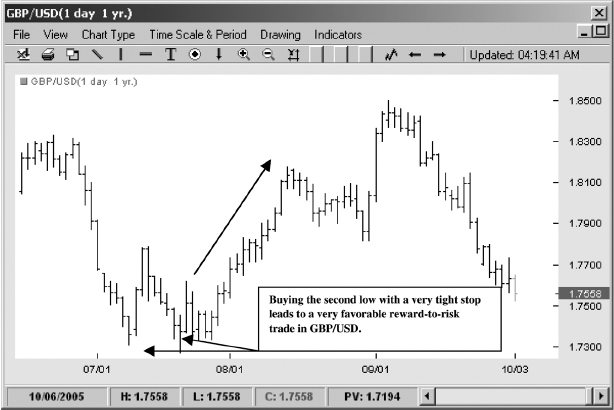
FIGURE 8.6 Double Bottom with Tight Stop
Source: FXtrek IntelliChart™. Copyright 2001–2005 FXtrek.com, Inc.
Because the anticipatory strategy can be both financially difficult and psychologically draining, some traders prefer the reactive method. Reactive traders, as the name implies, will not “front-run” the price action. Instead they will observe how the price behaves at the key support points in double bottoms and at the key resistance levels in double tops. Only after the price stabilizes at the original lows and then proceeds to make a series of higher lows will the reactive trader enter the trade. Granted, his entry will be inferior to that of the anticipatory trader and his risk-to-reward ratio will not be nearly as favorable, but the probability of success will be higher. Furthermore, the reactive trader will now have a logical reference point in terms of where he should place his stop. Again there are several choices depending on the price action and the temperament of the trader (see Figure 8.7). If price makes a higher double bottom, a trader with low risk tolerance can use the most recent low as his stop. The risk will be smaller but the possibility of stop-outs is far higher since price can easily trade down to the original low to truly test support. More aggressive traders may therefore choose to set their stops at the original low of the double bottom rather than the most recent low. This in fact is the most logical stop point. If price breaks support, the double bottom has now changed into a consolation range with high probability of continuation lower. The pattern has become the antipattern.
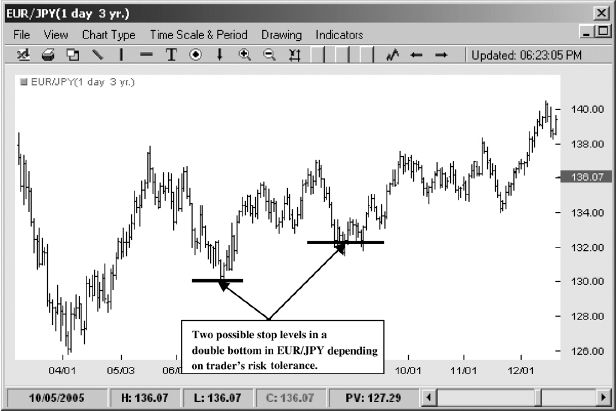
FIGURE 8.7 Double Bottom with Variable Stop
Source: FXtrek IntelliChart™. Copyright 2001–2005 FXtrek.com, Inc.
A more unusual version of the double bottom occurs when the second bottom is lower than the first. This type of pattern actually occurs with relative frequency in FX and again shows the subtle power of former support and resistance levels. The “lower low” double bottom and its opposite, the “higher high” double top, simply demonstrate the fact that the dominant directional group had enough momentum to break the original support or smash original resistance but then quickly ran out of gas. This pattern also shows the particular advantages of a reactive approach, which would simply observe the action and act only when support appeared to have been set. The anticipatory trader would of course be stopped out shortly after prices collapsed through the original bottom.
One difficult task for reactive traders is to determine exactly what constitutes support and to know when a second bottom has been put into place. Some traders suggest using a 7 percent retracement rule. The trader would simply measure the full amplitude of the downtrend from its peak to its lowest low, and if price bounced up by 7 percent or greater of the length of the downtrend, the reactive trader would assume that a double bottom had been made at the lowest low. Figure 8.8 shows how that method would work.
The 7 percent rule is of course arbitrary, since it is impossible to determine with great accuracy the exact point of support. One can only speculate and make intelligent assessments of probabilities, which is what trading is really all about. Nevertheless, the 7 percent approach offers the reactive trader a reasonable method for quickly identifying a bottom. Another way to identify the same possibility and one that I personally prefer is to wait for price to make at least three higher periodic lows to confirm that a second bottom has been put in place. That type of entry may position the reactive trader a bit later relative to the turn but it will also provide a more accurate reading of the price flow. Regardless of how one chooses to enter this trade, the clear stop behind this setup is the lowest low of the second bottom. If that low is broken, more selling is likely and the lower double bottom has simply turned into a creeper downtrend. Again, the pattern is now the antipattern, and woe to the trader who refuses to acknowledge that fact. Refer to Figure 8.9 for a view of that dynamic.
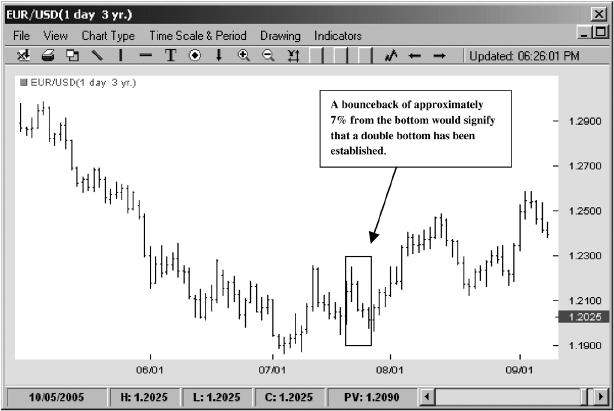
FIGURE 8.8 Seven Percent Bounceback Rule
Source: FXtrek IntelliChart™. Copyright 2001–2005 FXtrek.com, Inc.
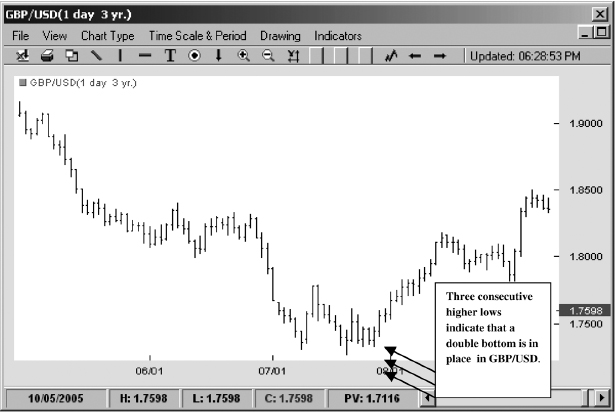
FIGURE 8.9 Three Consecutive Higher Lows
Source: FXtrek IntelliChart™. Copyright 2001–2005 FXtrek.com, Inc.
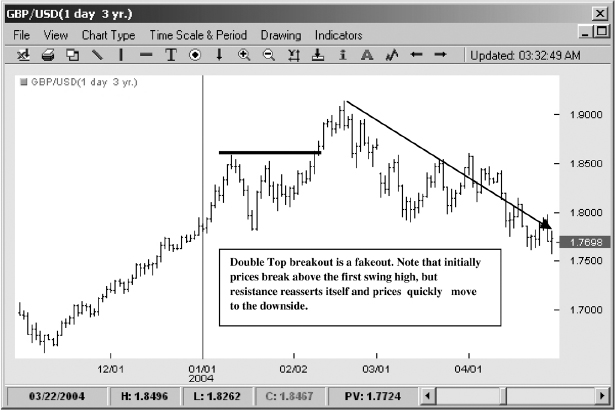
FIGURE 8.10 Double Top Fakeout
Source: FXtrek IntelliChart™. Copyright 2001–2005 FXtrek.com, Inc.
Perhaps the most interesting lesson of the fakeout double bottoms and double tops (the ones that have lower lows and higher highs) is that traders should never quit on possible patterns. Even if prices blow through the initial support or resistance levels they may foreshadow a trade setup in the near future. Just like gravity, these original levels may act as brakes on any forward momentum, and even if they don't stop the price action at the original support or resistance point the turn may occur in the near future (see Figure 8.10). That is why it is critical to follow the price action of the currency closely even if the original point of support or resistance is broken. The true reversal may be near at hand.
FLAGS AND PENNANTS
If double tops and double bottoms are the most popular reversal patterns, then surely bear and bull flags are the most popular continuation patterns. Both of these patterns occur after a sharp directional move and generally connote that price is entering a consolidation stage before pushing higher or lower. The directional move is known as the flagpole and must precede the price action in order for the pattern to be valid. Note the examples of both bull and bear flags in Figure 8.11 and Figure 8.12 with their concomitant extensions.
It is interesting to see flag formations in different contexts. Note for example how in Figure 8.13 when we apply our Bollinger band “bands” the flag is nothing more than a retracement within a channel or in Figure 8.14 it is simply the V of the W bottom. It is quite helpful to break up these patterns into their component pieces to understand how each pattern can transform into another one. Note, for example, that a pattern that begins as a bear flag, then fails to penetrate the bottom of the flagpole and becomes a double bottom, turns in the process from a continuation pattern into a reversal move.
Like the flag, the pennant shares the flagpole, but unlike the flag, which is a small rectangular pattern that slopes against the previous trend, the pennant is comprised of an asymmetrical triangle that opens wide and eventually compresses to a conelike shape. The easiest way to distinguish the two is that in the case of the bear flag the lows of the rectangle will be progressively higher whereas in the case of a bear pennant the lows will be relatively equal, forming the perfect base of the triangle (see Figure 8.15).
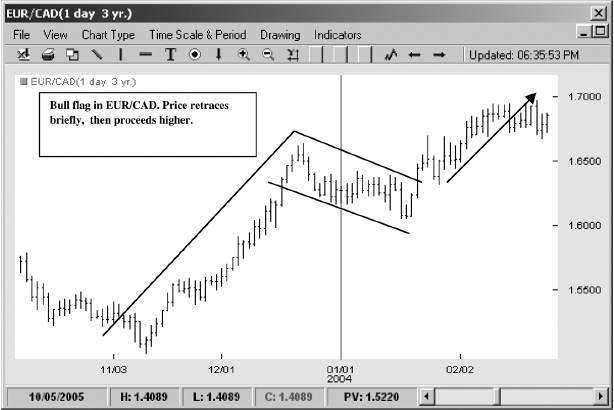
FIGURE 8.11 Bull Flag in EUR/CAD
Source: FXtrek IntelliChart™. Copyright 2001–2005 FXtrek.com, Inc.
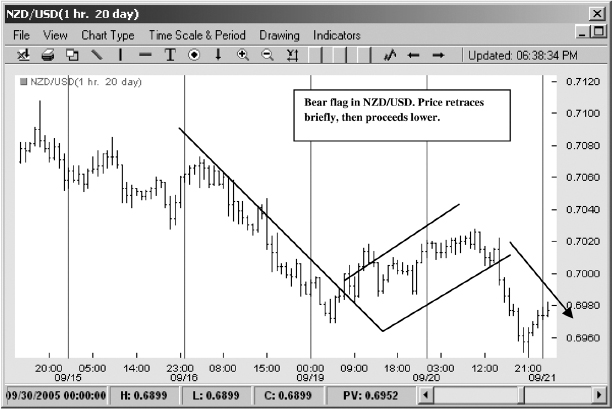
FIGURE 8.12 Bear Flag in NZD/USD
Source: FXtrek IntelliChart™. Copyright 2001–2005 FXtrek.com, Inc.
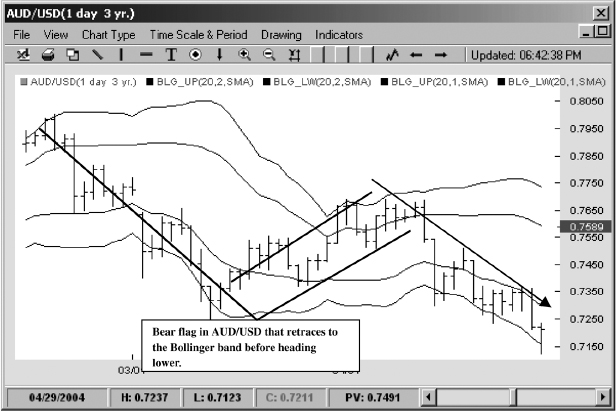
FIGURE 8.13 Bear Flag Retracement to Bollinger Band “Band” in AUD/USD
Source: FXtrek IntelliChart™. Copyright 2001–2005 FXtrek.com, Inc.
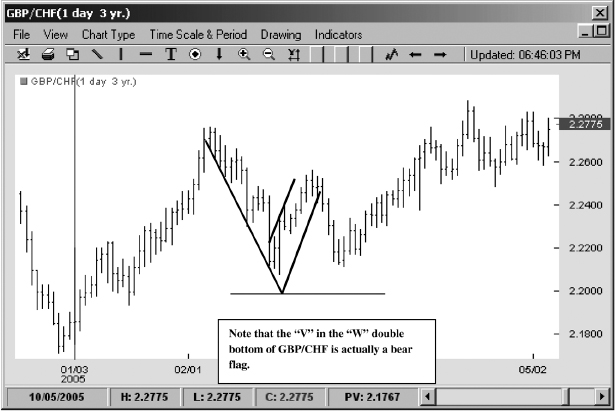
FIGURE 8.14 Bear Flag in the Double Bottom of GBP/CHF
Source: FXtrek IntelliChart™. Copyright 2001–2005 FXtrek.com, Inc.
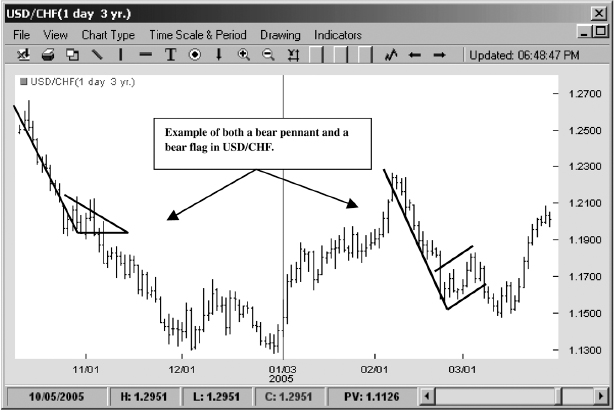
FIGURE 8.15 Bear Pennant and Bear Flag in USD/CHF
Source: FXtrek IntelliChart™. Copyright 2001–2005 FXtrek.com, Inc.
Both patterns are confirmed when their respective flagpole tops or bottoms are penetrated and the price resumes its original direction. Basically flags and pennants demonstrate a pause in market action. Just as we sometimes must sit quietly and digest the main course before we can tackle dessert, so must the market absorb new price levels and test the resolve of both the bulls and the bears before making further moves.
Because of their subtle differences, flags and pennants offer some different setups. While the classic way to trade them is by waiting for the breakout to occur and follow the continuation of price flow, the flag pattern, unlike the more constrained pennant, offers another opportunity for profit. Because the flag produces a much sharper retracement path than the pennant, we can participate in the trade not only at the point of break of the flagpole but also at the moment of flag failure. Here we can use Fibonacci levels to help us gauge the possible extent of the flag formation and its turning point. Figure 8.16 shows how in a bear flag the price retraces up to the 38.2 percent Fibonacci level and then proceeds to pull downward toward the initial downtrend. A trader could enter the setup when price falls below the 38.2 percent zone, indicating that most of the short covering and countertrend strength is gone, and set the stop at the most recent swing high. If the price reaches the bottom of the flagpole, the trader can cover half the position, move the stop to the break-even point, and await the possible break and continuation move.
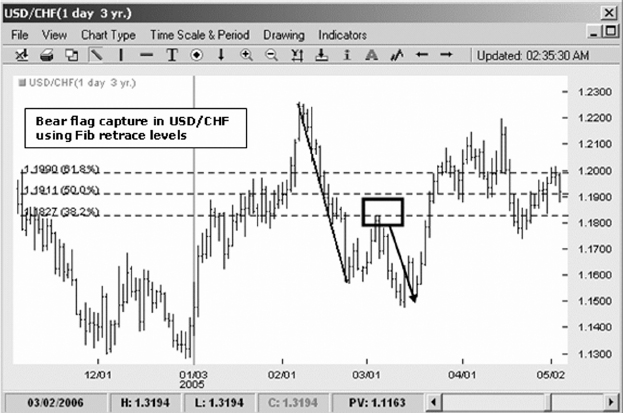
FIGURE 8.16 Bear Flag Capture in USD/CHF
Source: FXtrek IntelliChart™. Copyright 2001–2005 FXtrek.com, Inc.
One of the more attractive aspects of the flag pattern is that it can be traded profitably in this manner even if the pattern eventually fails. Capturing the flag part of the flag pattern can sometimes be as effective as trading the break.
TRIANGLES, WEDGES, AND DIAMONDS
Triangles and wedges are yet another family of consolidation patterns that can offer a variety of profitable setups to the technically oriented trader.
Triangles
There are three key patterns that most technicians focus on:
- Symmetrical triangle
- Ascending triangle
- Descending triangle
The symmetrical triangle, which shows price action becoming progressively tighter and compressing like a coil, usually forms during a trend as a continuation pattern. This pattern contains at least two lower highs and two higher lows. When these points are connected on the chart they eventually converge into a fulcrum that typically resolves itself in the direction of the initial trend. That's not always the case, however, and sometimes symmetrical triangles will produce breakdowns in an uptrend and breakouts in a downtrend. Regardless of whether the symmetrical triangle evolves into continuation or reversal, the key to trading it successfully is to wait unit the price action actually makes a move before committing to a setup. Figure 8.17 shows two separate symmetrical triangles with the price resolving in different directions.
Why is this pattern so valuable? Because it perfectly encapsulates the market struggle between the longs and shorts to assert control over price. During the period of consolidation neither the bulls nor the bears can extend their ranges. Thus we have a series of lower highs and higher lows until eventually the price action triangulates and one side blinks. Often in the currency market this pattern can give birth to a powerful move akin to a rubber ball held under water, which when released will thrust upward (see Figure 8.18).
The ascending triangle is usually a bullish formation that serves as a continuation pattern in an uptrend or a reversal pattern in a downtrend. The ascending triangle is distinguished by its series of higher lows and relatively even highs. The higher lows indicate that bulls are accumulating the currency on any and all pullbacks, inexorably building a strong line of support. At the same time the bears provide consistent resistance at the upper level of the range. As time progresses the distance between the two camps inevitably narrows, and typically as the buying pressure from the bulls builds resistance gives way and prices resolve upward (see Figure 8.19).
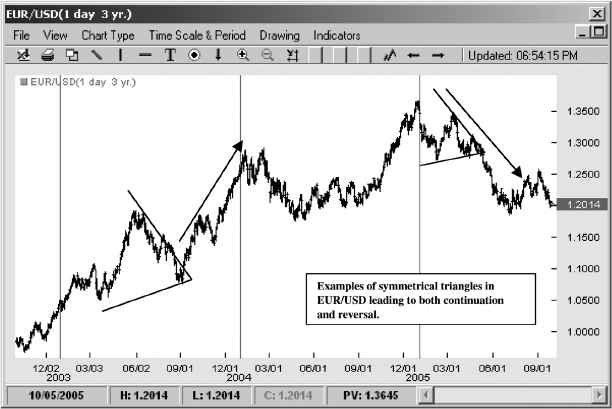
FIGURE 8.17 Symmetrical Triangles in EUR/USD
Source: FXtrek IntelliChart™. Copyright 2001–2005 FXtrek.com, Inc.
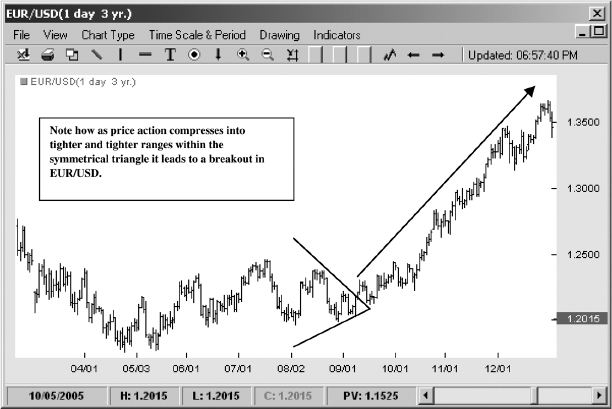
FIGURE 8.18 Symmetrical Triangle Breakout in EUR/USD
Source: FXtrek IntelliChart™. Copyright 2001–2005 FXtrek.com, Inc.
The general rule of thumb is that the price must make at least three impulse highs and two reaction lows in order for the pattern to qualify as an ascending triangle. In essence, the triangle is composed of series of double tops and higher double bottoms.
Once a breakout is made, the straight line of the ascending triangle that used to serve as resistance now becomes support. Most traders would be wise to place their stops near that point. However, the exact nature of the stop should be carefully considered. The key tenet of technical analysis is that former resistance becomes new support. The corollary to that rule is that price will quite frequently want to test that former support. In the case of the ascending triangle, the bears may make one last stand and try to drive the prices back through the breakout line. Therefore it is important to set stops not at the top line of the triangle, which would risk taking the trader out on a quick burst back to support, but rather at the bottom line of the triangle, which should avoid most of the position-jockeying noise but is still close enough to protect trading capital should the pattern break down and fail (see Figure 8.20).
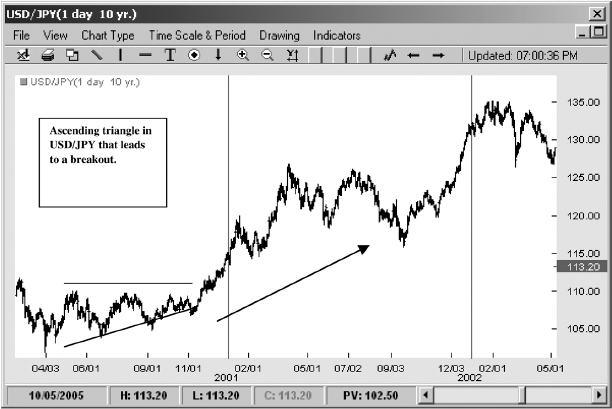
FIGURE 8.19 Ascending Triangle in USD/JPY
Source: FXtrek IntelliChart™. Copyright 2001–2005 FXtrek.com, Inc.
The descending triangle is simply the reverse formation of the ascending triangle. The pattern is bearish and typically forms during a downtrend as a continuation pattern. It can also form as a reversal pattern in an uptrend. The key distinguishing characteristic of the descending triangle is the fact that it is marked by a series of lower and lower highs and relatively equal lows, so that price eventually converges to a point of resolution headed down.
Like the ascending triangle, this pattern requires a minimum of two reaction highs and three reaction lows to be considered valid. The descending triangle basically describes the futile action of the bulls as they stage a series of ever more pathetic rallies, each smaller than the prior one. As the last of the bullish momentum eventually wanes, prices give way and a downward cascade commences.
Whereas the ascending triangle demonstrates accumulation from smart-money bulls who buy every pullback in anticipation of a rally, the descending triangle is a study in distribution where the crafty bears build short positions on every rally, confident that prices will eventually crack. Although these patterns can be evident on any time frame, including even the 5-minute charts, they are most powerful when they develop on daily charts over periods of weeks and even months. Prices that form over longer time frames tend to present a much broader array of market consensus. When resolution comes, the moves therefore can be quite powerful. Note in Figure 8.21 how the descending triangle in the GBP/USD on the daily chart ultimately leads to an almost uninterrupted 800-point decline.
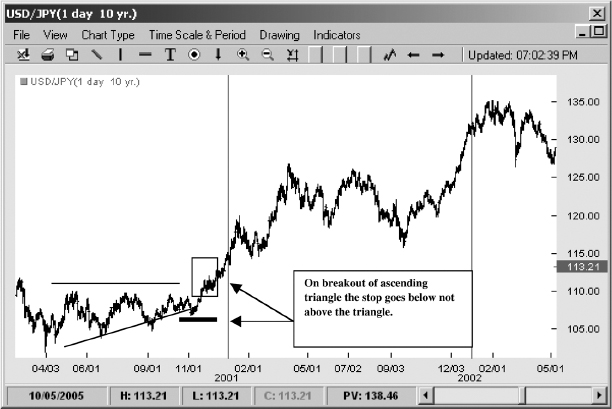
FIGURE 8.20 Placing Stops with Ascending Triangles
Source: FXtrek IntelliChart™. Copyright 2001–2005 FXtrek.com, Inc.
Wedges
Wedges can be one of the most difficult patterns to spot because of their subtle, slow formation. The falling wedge, for example, is a bullish pattern that connotes a reversal of a downtrend or a continuation of an uptrend. It begins with a wide range and slowly contracts as prices make lower highs and lower lows. The shape of the wedge resembles a cone, although it rarely compresses to a tip. Rather, price ranges continue to narrow until the upper trend line of the wedge is broken to the upside and a rally begins (see Figure 8.22).
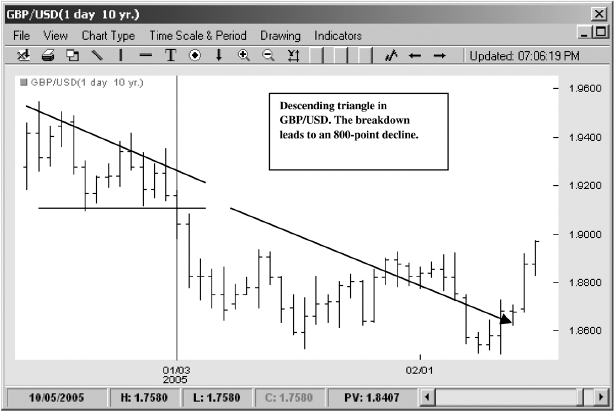
FIGURE 8.21 Descending Triangle in GBP/USD
Source: FXtrek IntelliChart™. Copyright 2001–2005 FXtrek.com, Inc.
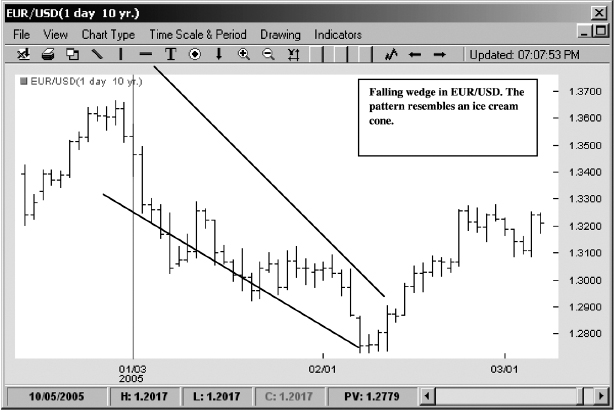
FIGURE 8.22 Falling Wedge in EUR/USD
Source: FXtrek IntelliChart™. Copyright 2001–2005 FXtrek.com, Inc.
The key difference between a symmetrical triangle and a falling wedge is the pronounced nature of the slope of the wedge. The falling wedge will always have a downward-sloping bottom trend line that will connect the series of lower lows. The wedge basically alerts the trader to declining downward momentum and provides clues as to when the move may be exhausted, allowing the trader to position early to take advantage of the turn. As such, using a momentum oscillator like the MACD histogram in conjunction with a falling wedge may be very useful to a trader trying to identify an inflection point (see Figure 8.23).
The rising wedge, like its antithesis the falling wedge, is also a longterm pattern, although it is bearish in nature. The rising wedge portrays a slow rise in prices with a series of higher highs and higher lows that provide it with its distinctly upward-leaning slope. Although the rising wedge may appear to be bullish, it is actually telegraphing a warning to a long-biased trader that upward momentum is losing steam as prices coalesce in an ever narrower channel (see Figure 8.24).
The dynamic behind the rising wedge paints a picture where the bulls are able to generate a series of new highs, but each high becomes smaller and smaller. For example, note in Figure 8.25 that GBP/USD first makes a rally 2,000 points in length; then after a retracement the second rally as measured from its swing bottom to its swing top is only 1,300 points higher; but soon afterward prices give way. In each successive up move prices make new highs but as the length of each move decreases it shows that bulls are becoming less and less productive, much like a bulldozer that can move gravel less and less distance with each successive thrust.
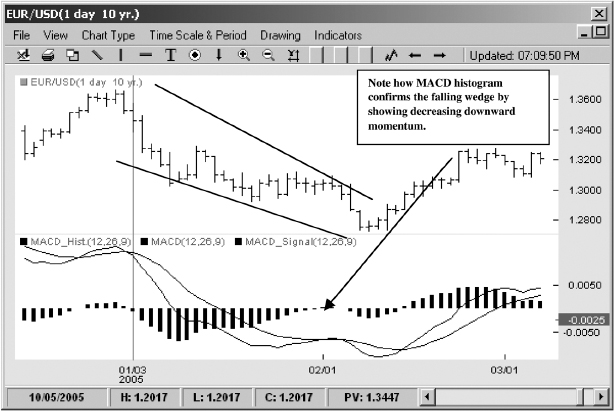
FIGURE 8.23 Falling Wedge Confirmed by MACD Histogram
Source: FXtrek IntelliChart™. Copyright 2001–2005 FXtrek.com, Inc.
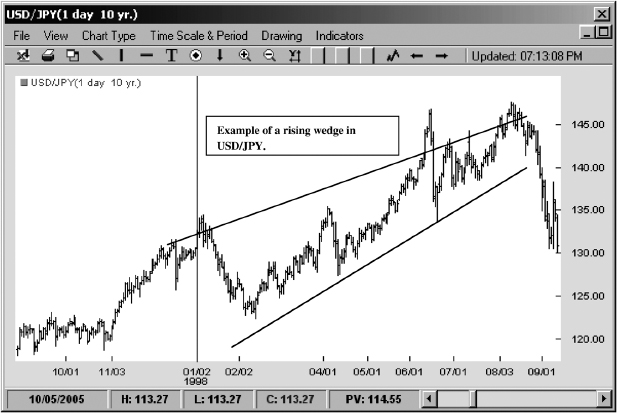
FIGURE 8.24 Rising Wedge in USD/JPY
Source: FXtrek IntelliChart™. Copyright 2001–2005 FXtrek.com, Inc.
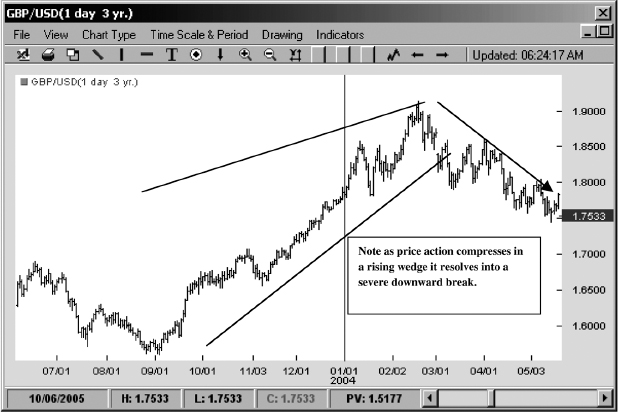
FIGURE 8.25 Rising Wedge Leads to Decline
Source: FXtrek IntelliChart™. Copyright 2001–2005 FXtrek.com, Inc.
Eventually, as prices make smaller and smaller swing highs, the rising wedge comes to a near halt. If the price retraces, tests the lower end of its channel, and then breaks it, the rising wedge provides a reversal signal that can often lead to a powerful countertrend.
Diamonds
Diamonds are one of the rarest patterns and can be incredibly frustrating for a trader caught within one (see Figure 8.26). The pattern, which is a reversal formation, is found far more frequently at market tops than at bottoms and is consistent with the chaotic, volatile environment that often characterizes such periods. The diamond pattern starts out as a series of higher double or triple tops that consolidates into a symmetrical triangle. This rather bizarre combination of broader price action followed by the narrowing of bars is what gives the diamond its distinctive shape.
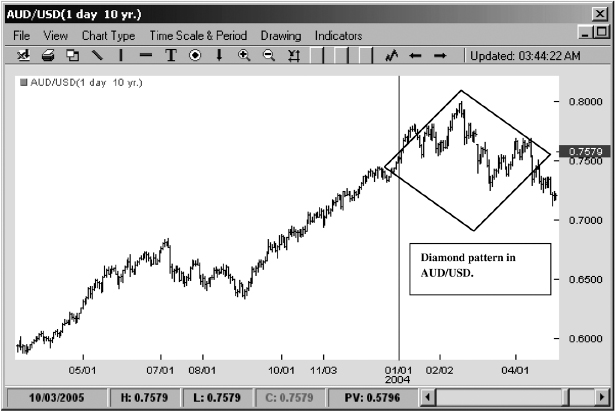
FIGURE 8.26 Diamond Pattern in AUD/USD
Source: FXtrek IntelliChart™. Copyright 2001–2005 FXtrek.com, Inc.
The price action carved by the diamond pattern is the result of wild, wide-ranging swings between the bulls and the bears, which are often a function of emotional short covering and quick, careless stop-outs as both parties become fearful of what may transpire next. Eventually the price action settles into smaller and smaller ranges as both parties, like gunslingers at the O.K. Corral, wait for the other guy to make the next move.
Since the diamonds predominantly occur at the top of the uptrend, the next move is typically down as trend exhaustion sets in and prices fall (see Figure 8.27). The break of the diamond would signal the trade entry point for a technical trader, with the swing top serving as the stop. If prices suddenly reverse and begin to race upward, the diamond will have transformed into a consolidation range, which would be highly indicative of higher prices as bulls have been able to stem the decline. At that point the pattern fails; the trader should recognize that fact and abandon the trade.
Diamond patterns with their high middle spike and winglike structure are quite similar to the final pattern that we'll examine—one that is possibly the best-known price pattern of all: head and shoulders.
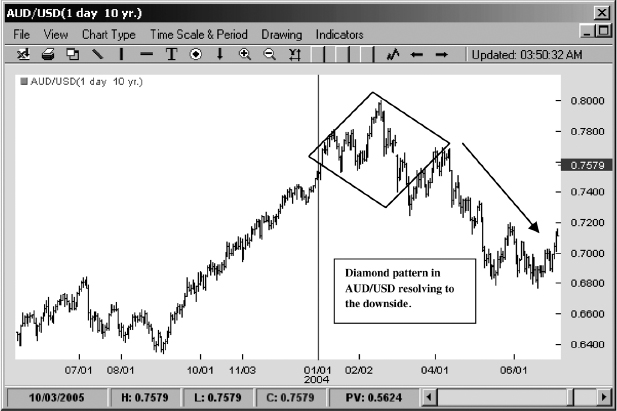
FIGURE 8.27 Diamond Pattern Resolving to Downside
Source: FXtrek IntelliChart™. Copyright 2001–2005 FXtrek.com, Inc.
HEAD AND SHOULDERS
The head and shoulders pattern is one of the most common and famous reversal patterns in all of technical analysis. The formation is basically a very specific type of triple top with the middle peak higher than the two outside peaks. The pattern vaguely resembles a human body; thus the middle peak is known as the head and the two lower peaks are the left and right shoulders. Figure 8.28 shows the classic head and shoulders formation in GBP/USD.
The head and shoulders pattern is formed after a prolonged uptrend in three distinct stages.
- The left shoulder is created while still in an uptrend as prices rally and then retrace slightly without breaking the upward trend line. This part of the pattern can also be seen as a bull flag.
- From the low of the left shoulder prices stage a massive rally that takes the currency pair to new highs. Prices then retrace the whole move and find support at or near the low of the left shoulder.
- Prices again attempt to rally but fail to make new highs. The high of the right shoulder may be greater or smaller than the high of the left shoulder. However, once again prices fail in their rally, and this time they decline past the bottom set by both the left shoulder and the head. This support line is known as the neckline, and when it breaks the head and shoulders pattern is completed as the full price reversal begins to take place (see Figure 8.29).
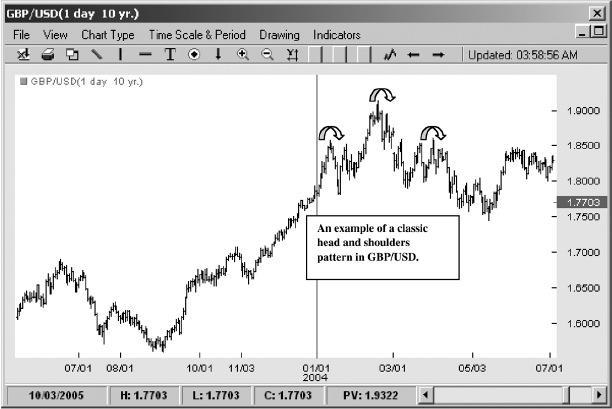
FIGURE 8.28 Head and Shoulders in GBP/USD
Source: FXtrek IntelliChart™. Copyright 2001–2005 FXtrek.com, Inc.
REVERSE HEAD AND SHOULDERS
A reverse head and shoulders pattern follows the same dynamic, but simply in the opposite manner with the head making the peak low and the two shoulders completing the reversal pattern to the upside (see Figure 8.30). One of the interesting aspects of both the regular and the reverse head and shoulders pattern is that, just as with all technical patterns, former support becomes resistance and former resistance becomes support. Thus, for example, in the reverse head and shoulders the neckline that initially served as major resistance will now become major support. For traders trading the head and shoulders pattern or its reverse, this line should now serve as a stop point, for if it is violated materially after prices make a breakout, then the pattern is most likely broken and may transform into a consolidation range that could eventually see continuation rather than a price reversal.
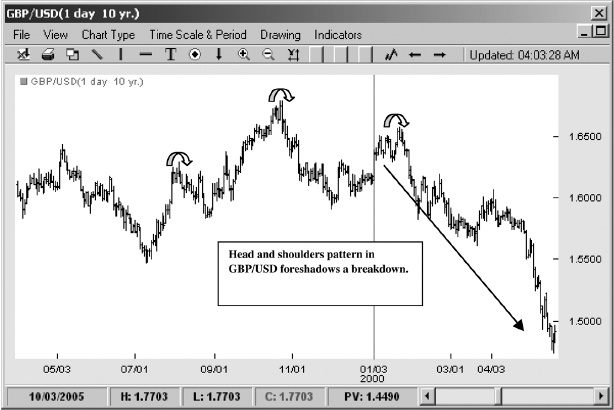
FIGURE 8.29 Breakdown from Head and Shoulders
Source: FXtrek IntelliChart™. Copyright 2001–2005 FXtrek.com, Inc.
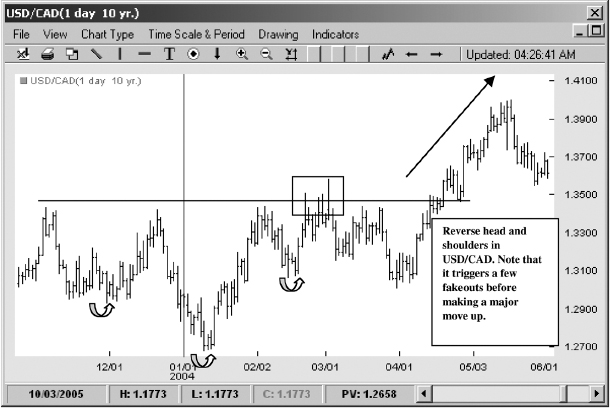
FIGURE 8.30 Reverse Head and Shoulders in USD/CAD
Source: FXtrek IntelliChart™. Copyright 2001–2005 FXtrek.com, Inc.
Setting stops in this case, however, is far more a matter of art than of science. The neckline is a volatile barrier as both bulls and bears make all-out attempts to battle for price dominance. Price may therefore frequently dip below the neckline in the case of the reverse head and shoulders or pierce it in the case of the regular head and shoulders and stop out traders before successfully resuming the pattern.
What is a good strategy for proper stops? There are several possibilities. A trader cam simply set an arbitrary band of 50 or perhaps 100 points below the neckline for the reverse head and shoulders and do the opposite (setting a stop 50 or 100 points above the neckline) for the regular head and shoulders pattern. This strategy may work most of the time, since it should provide ample room to clear most of the market noise from the position. However, another more technically based approach may be more logical and effective: Instead of using a money stop, a technically oriented trader may consider using the low of the first bar that broke through the neckline. Figure 8.31 shows the proper stop. Alternatively for less-aggressive traders the stop could be placed below the low two bars back from the breakout.
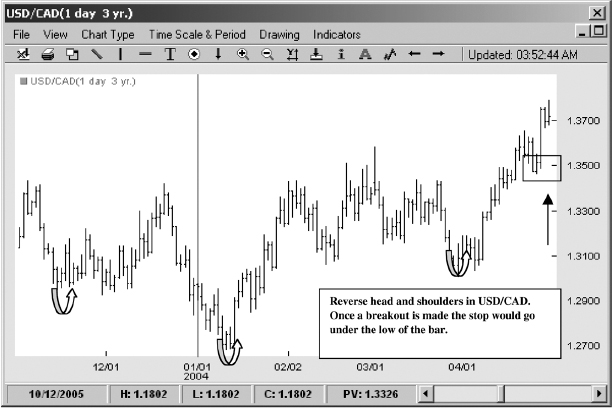
FIGURE 8.31 Proper Stop for Reverse Head and Shoulders
Source: FXtrek IntelliChart™. Copyright 2001–2005 FXtrek.com, Inc.
This approach may be more technically correct, as it uses organic levels generated by the market to provide the trader with reasonable risk parameters. The idea behind using the most recent lows prior to breakout as the stop-out points centers on the fact that they represent the value areas from which the bulls started their rally to complete the reverse head and shoulders pattern. Once those barriers are broken, the probability that the pattern is no longer operable increases significantly.
CONCLUSION
Of course no stops are perfect. It is quite possible to have the price pierce these stops only to violently rally back and resume the reversal. But technical analysis is the study of probabilities, not certainties. Patterns help the trader identify and classify the common behavior traits of market participants. Can this behavior change rapidly? Absolutely—especially in the FX market, which is so heavily driven by economic and geopolitical news that can reverse trader sentiment in a heartbeat.
However, over a long period of time these patterns repeat themselves with almost monotonous regularity. Just as most human behavior is quite predictable over a long period of time, price patterns reflect this psychological dynamic numerous times on the charts. Simply familiarizing yourself with these patterns will not make you profitable. True skill requires experience and solid systematic interpretation of both the price action and the indicator data. Nevertheless, these patterns are the basic building blocks for understanding and interpreting price flow. Just as the greatest literary talent cannot function without the knowledge of the alphabet, so, too, a technically oriented trader cannot be successful without a thorough understanding of how these patterns work.