CHAPTER 10
Setups! Setups! Setups!
Technical analysis tools in and of themselves are useless. Only when we apply them to intelligent, logical trading strategies do they prove their worth and help us make money in the currency market. What follows are several trading setups designed to exploit the value of technical indicators in currency trading. These are generalized setups and by no means are a holy grail to untold riches. In fact, I can assure you that all of these setups will fail at one time or another. Hopefully, however, these trading ideas will fail intelligently; that is, either they will fail frequently but with small losses or they will fail with much larger (though not debilitating) losses but only occasionally. Regardless of the outcome, the purpose of this chapter is to show you how to use technical analysis to develop a methodical approach to trading the currency market. Why is method so important? Because it is the only way we can study, analyze, and improve our techniques. Seat-of-the-pants, instinctive trading may work well for some traders, but ultimately it is extremely limiting. In fact, this is the critical value of technical analysis—for it allows the trader to systematically apply his ideas to the market and objectively measure their success.
Some of these ideas I trade myself, while others have come from the fertile minds of friends and colleagues. However, as always, I note that no two traders are alike nor will they trade alike. Therefore I present these setups simply in the spirit of sharing. Feel free to experiment and modify any of these strategies to accommodate your tastes or preferences. Just remember to stay true to the logic of whatever strategy you devise. In trading currencies, everybody is wrong sometimes. The difference between professionals and amateurs is that professionals accept this reality while amateurs do not and are therefore doomed to be destroyed by it.
TREND DETECTION/TREND EXHAUSTION WITH BOLLINGER BANDS
When does a trend start? For some traders a new trend begins when the old trend ends. The swing high or low of the prior trend is the commencement of a move the other way and thus the birth of a new trend. For other traders, true trend must display a concerted evidence of directionality—that is, prices must make consecutive new highs or new lows for trend to be truly in place. Regardless of how one defines trend, the Bollinger band “bands” setup is one of the most flexible tools to implement either strategy.
Let's quickly review the premise behind this trade idea. The classic Bollinger bands, invented by John Bollinger, plot the standard deviation of price around the 20-period simple moving average.
The Bollinger band formula consists of the following:
BOLU = Upper Bollinger band
BOLD = Lower Bollinger band
n = Smoothing period
m = Number of standard deviations (SD)
SD = Standard deviation over last n periods
Typical price (TP) = (HI + LO + CL)/3
BOLU = MA(TP, n) + m × SD(TP, n)
BOLD = MA(TP, n) − m × SD(TP, n)
Generally we know that price tends to be range-bound 70 to 80 percent of the time. During these periods Bollinger bands serve as very accurate points of oversold or overbought value. Traders can effectively sell when prices hit the upper Bollinger band and buy when prices tag the lower Bollinger band. Note how a range-bound consolidation zone in EUR/USD provides several opportunities to sell tops and buy bottoms, harvesting nice profits for the trader. Typically the best time to trade seesaw setups is right after the price has made a major move in one direction, for as surely as day follows night, consolidation follows trend.
The basic rules to trade range are:
- Establish at least one swing high and one swing low for the range.
- Measure the amplitude of the range.
- Go long the next time the price hits the lower Bollinger band.
- Set a stop at the low of the entry bar plus half the value of the amplitude of the range.
- Exit the long when the price hits the upper Bollinger band and immediately establish a short, placing a stop at the high of the entry bar plus one-half the value of the amplitude of the range (see Figure 10.1).
- Make minor adjustments by recalculating the range value as it expands.
- Repeat the process until you are stopped out.
Between April and October of 2004 this strategy worked exceedingly well in the EUR/USD pair, registering five consecutive profitable trades. To fully appreciate just how profitable this kind of trading can be, note that this method was able to bank cumulative gains of 1,000 points in an environment in which the currency pair never moved more than 300 points either way.
Why was this strategy so successful? First, it was implemented after a strong trend move as EUR/USD gained nearly 1,000 points from 2003 to 2004. After trends prices will very often experience a long period of consolidation as the market digests and adjusts to new values. Second, the strategy used the classic money management technique to control risk. By using one-half the amplitude of the range, this trading technique provided enough room to avoid market noise while keeping the reward-to-risk ratio at 2:1. In highly range-bound markets such as that of April to October of 2004 this method was extremely profitable, but even in markets where it generated only one profitable trade before stopping the trader out, the method was a net winner because of its 2:1 reward-to-risk money management rules.
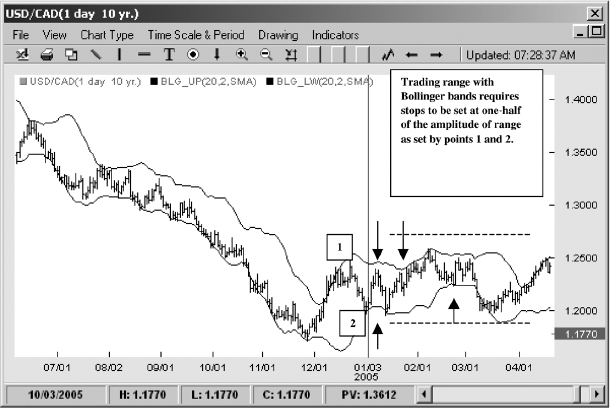
FIGURE 10.1 Trading Range with Bollinger Bands
Source: FXtrek IntelliChart™. Copyright 2001–2005 FXtrek.com, Inc.
Going back to Figure 10.1, if we connect every point of entry and exit we realize that the pattern forms a Z-shaped line. Looking at this line we can see that this in fact is a horizontal trend. Although this concept may seem like an oxymoron, if we were to stretch out the Z-shaped line it would be as long and as impressive as any vertical trend. Thus we can see that trends need not be vertical to be profitable. Horizontal price action, boring as it may seem to an untrained eye, can be a gold mine to an astute trader using Bollinger bands and proper money management to trade them.
TREND TRADING WITH BB BANDS
Although the classic use of Bollinger bands is to trade range, Bollinger bands can be extremely effective in trading trend as well. I already introduced you to the concept of Bollinger band “bands” in Chapter 5, but let's review the idea once more. In the Bollinger band “bands” setup the trader superimposes two sets of Bollinger bands. First he lays down the standard Bollinger bands set to 2 standard deviations and then he applies another set of BB's set to only 1 standard deviation. The result of this exercise is that the trader now has access to a set of very accurate dynamic trend channels. If the price trades in between the two upper Bollinger bands it's in an uptrend; if the price trades in between the two lower Bollinger bands it's in a downtrend. If it trades somewhere in between the two channels it's considered to be in no-man's-land and trend-less (see Figure 10.2).
Bollinger band “bands” can be used both as a trend detection tool and as a trend exhaustion tool. Let's first take a look at how we can use the Bollinger band “bands” to spot trend exhaustion and consider several trading tactics to take advantage of such a setup. If trend is defined as price trading between the two Bollinger bands, then price leaving the BB channel connotes trend exhaustion. The Bollinger band “bands” trend exhaustion setup is fairy straightforward.
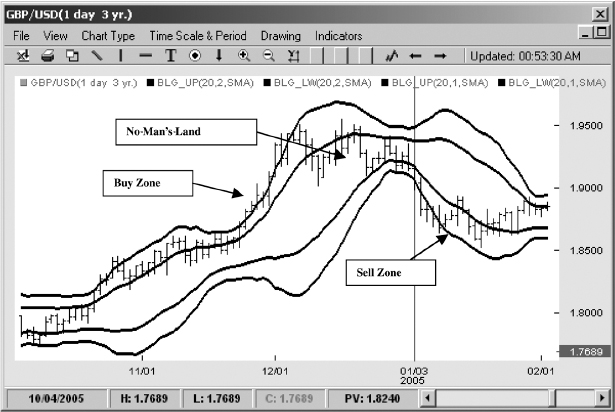
FIGURE 10.2 Trend Exhaustion with Bollinger Band “Bands”
Source: FXtrek IntelliChart™. Copyright 2001–2005 FXtrek.com, Inc.
- The price must trade within either upper or lower Bollinger band “band.”
- If the closing price of the period is either above the preceding Bollinger band sell channel or below the preceding Bollinger band buy channel, a trend exhaustion signal is generated.
- In the case of a sell channel break, the trader would buy at market at the start of the next bar, and in the case of a break of a buy channel the trader would sell at market at the start of the next bar.
Here is where the trade becomes very interesting, depending on the tactics the trader employs. The simplest approach is to put on the trade and place a stop in the case of long at the swing low minus 1 point and minus the spread, which would exit the trade if the swing low was broken. The target on the trade would be the opposite Bollinger band (see Figure 10.3).
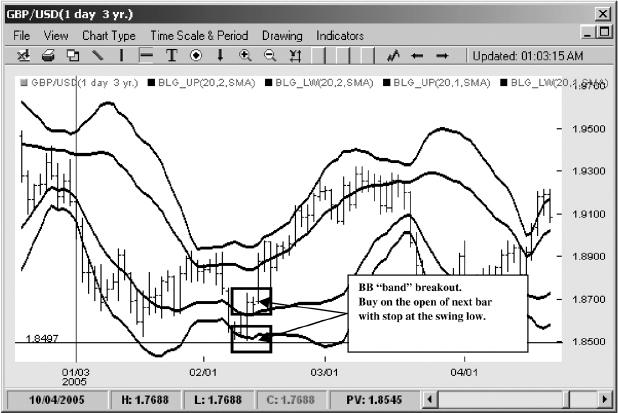
FIGURE 10.3 Bollinger Band “Band” Trade with Price Stop
Source: FXtrek IntelliChart™. Copyright 2001–2005 FXtrek.com, Inc.
Although this type of trade will generate many stop-outs as prices rarely make V-shaped bottoms, it carries a very favorable reward-to-risk structure. Note that in Figure 10.3 the risk is only 50 points but the reward is 200 points. The trader can be wrong three out of four trades and still be profitable under such circumstances.
Another technique to this setup would call for the following game plan:
- Enter the setup at market when the trend exhaustion signal is given.
- Place a stop below the swing low.
- Liquidate one-third of the position when the price reaches the 20-period simple moving average (20 SMA).
- Place stop at break-even point.
- Liquidate one-third of the position at the tag of the opposing 2 standard deviation bollinger band.
- If the price decides to climb the Bollinger band channel, liquidate the final one-third of the position if the price bar closes outside of the Bollinger band channel zone.
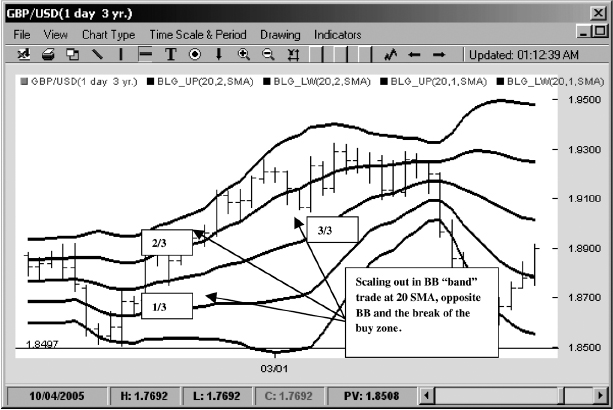
FIGURE 10.4 Scaling Out of Bollinger Band “Band” Trade
Source: FXtrek IntelliChart™. Copyright 2001–2005 FXtrek.com, Inc.
This technique is designed to dynamically adapt to various market conditions (see Figure 10.4). Under this strategy a trader will get stopped out for a relatively small loss if the price fails to make a turn or he will harvest a modest profit if the price makes a reflex retracement to the 20-period simple moving average. On occasion when prices make a strong move to the opposite Bollinger band, the trader will bank meaningful profits on two-thirds of his position. Finally, in those very rare instances when the price makes a V-shaped bottom and generates a very strong countertrend, the trader has the opportunity to collect massive profits on part of his position. Essentially by gradually scaling out of the position a trader can take advantage of every possible scenario that the market may present. The malleability of this approach is its most attractive feature.
VOLATILITY STOP
One of the problems with the prior techniques is the large number of stop-outs they tend to generate. Prices will very frequently exceed their swing highs or swing lows if for no other reason than the fact that dealers are well aware of those price points and will make stop-hunting forays to collect easy profits. What happens next can be very disheartening as the price makes a turn in the original direction but the trader is taken out of what ultimately becomes a winning position. For traders who are psychologically comfortable with multiple small stops, the approaches listed earlier present little problem. But for traders like myself, who absolutely cannot stand a constant series of small losses but are more than willing to accept an occasional large loss, the following strategy to trade trend exhaustion with Bollinger band “bands” may be a much better approach. Instead of using a hard price stop, this method uses a volatility stop generated off the Bollinger bands themselves (see Figure 10.5).
Here are the basic rules for this setup.
- Enter the setup with one-half position size at market when the trend exhaustion signal is given.
- At the point of entry measure the distance between the Bollinger band +1 standard deviation and −1 standard deviation.
- Add the value from step 2 to the swing low if trading long or to the swing high if trading short.
- Place stop at that point.
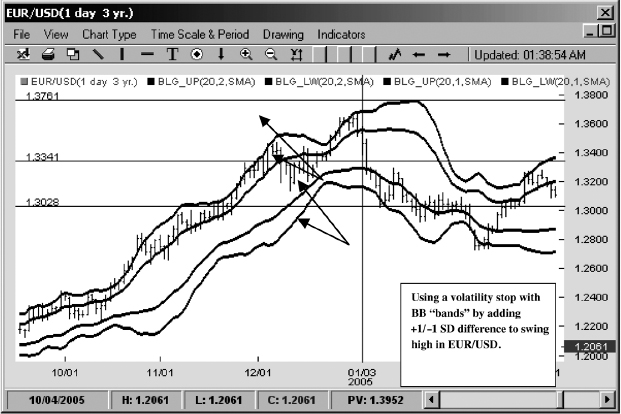
FIGURE 10.5 Bollinger Band “Band” Trade with Volatility Stop
Source: FXtrek IntelliChart™. Copyright 2001–2005 FXtrek.com, Inc. - If trade moves to profit, exit at the opposite Bollinger band.
- If trade moves against you, add the second half of the position on the next tag of the 2 standard deviation Bollinger band.
- Exit the full trade on the tag of the opposite Bollinger band.
This is a trading tactic that uses a highly probative approach to price action. It assumes that the trend channel break signal provided by the Bollinger bands is simply a clue rather than an exact sign of trend exhaustion. As such, it uses a wide stop and a scale-in approach that materially improves the reward-to-risk odds and increases the probabilities of success as well.
Why use the bandwidth of +1 SD to −1 SD of Bollinger bands as a stop-out value? Because Bollinger bands by their essence measure volatility. Therefore, in highly volatile markets Bollinger bands will be naturally wide while in low-volatility markets they will be quite compressed. In other words, by using this type of dynamic volatility stop the trader will be able to respond to the present market conditions rather than impose uniform risk-control measures over highly diverse market environments. Note, for example, how in Figure 10.6 this method generates a tight stop causing minimal damage when the setup fails, but in Figure 10.7 this setup uses a wide stop that keeps the trader in the trade until it eventually turns around and becomes profitable.
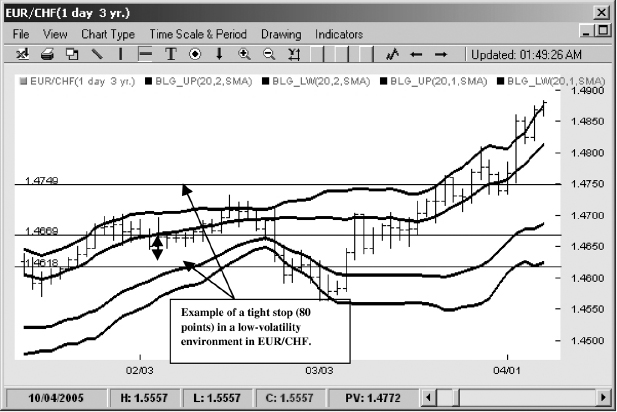
FIGURE 10.6 Low-Volatility Stop with Bollinger Band “Bands”
Source: FXtrek IntelliChart™. Copyright 2001–2005 FXtrek.com, Inc.
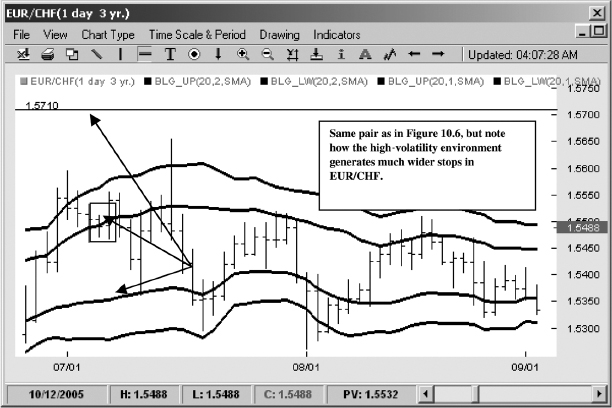
FIGURE 10.7 High-Volatility Stop with Bollinger Band “Bands”
Source: FXtrek IntelliChart™. Copyright 2001–2005 FXtrek.com, Inc.
TRADING PURE TREND WITH BOLLINGER BANDS
As we have already seen, Bollinger band “bands” present a trend trader with an elegant natural way to draft trend channels and therefore present several interesting trend trading setups. The simplest and purest setup follows these rules (see Figure 10.8). (Note that these describe a long setup, but the rules for shorts are simply reversed.)
- Price must enter the Bollinger band buy zone.
- Price should close within the buy zone to trigger a buy signal.
- Place stop at the bottom of the entry bar.
- If the trade moves in the right direction, exit only when price closes below the buy channel.
FIGURE 10.8 Trading Trend with Bollinger Band “Bands”
Source: FXtrek IntelliChart™. Copyright 2001–2005 FXtrek.com, Inc.

This is a pure trend setup that strictly follows the trend trader's most important dictum: “Either I am right or I am out.” Trend trading is a clear-cut methodology. Prices must continue to trend or there is no logical reason to remain in the trade. This is why this setup has a very tight stop. Once trend is established, though, a trend trader wants to give it plenty of leeway to fully bloom. As long as prices remain within the uptrend channel the trend trader maintains his position. Note that the stop-out rules of the setup call for prices to close below the uptrend channel rather than merely pierce it. This condition prevents too many early stop-outs, as price will often test the lower bounds of the channel. However if bulls are able to close the bar within the channel that type of price action would suggest that directional power is still tilted to the upside. Note also that just like busy office workers hopping on and off an elevator, trend traders can reenter the trend many times during a significant move as conditions turn favorable. Figure 10.9 shows a good example of just such a setup. Between October and December of 2004 the EUR/USD climbed 1,300 points. Several times during this move prices fell out of the uptrend channel, but persistent trend traders could have rejoined the bulls once price resumed the uptrend and would have captured large pieces of the move.
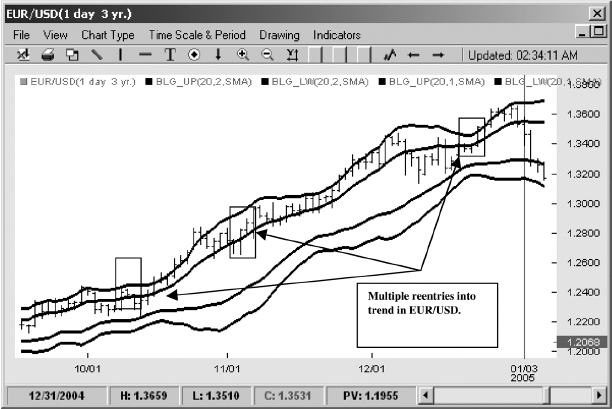
FIGURE 10.9 Multiple Trend Entries with Bollinger Band “Bands”
Source: FXtrek IntelliChart™. Copyright 2001–2005 FXtrek.com, Inc.
SCALPING TO TREND
Another interesting setup for more short-oriented traders also involves Bollinger band “bands” and allows traders to exploit the interplay between the 1 and 2 standard deviation bands. Here is how this trade sets up, and again I will use a long example with rules simply reversed for the short side.
- Price enters the buy channel and tags the upper 2 standard deviation Bollinger band.
- If price retraces down to 1 standard deviation Bollinger band, buy at market.
- Place stop at 20-period SMA.
- Exit trade on next tag of 2 standard deviation Bollinger band.
- Repeat process.
This is a very interesting setup because it utilizes both fading and trending techniques to make several quick high-probability trades. The idea behind this setup is that the underlying power of the move lies with the direction of the trend. Therefore, by absorbing the opposite side of any profit-taking move, the trader enters the trend at a favorable price and has a quick opportunity to bank profit on the next wave up. Note in Figure 10.10 how a nimble scalper is able to generate 300 points of gains before finally getting stopped out, while a more long-term trader is able to harvest only 100 points of profit.
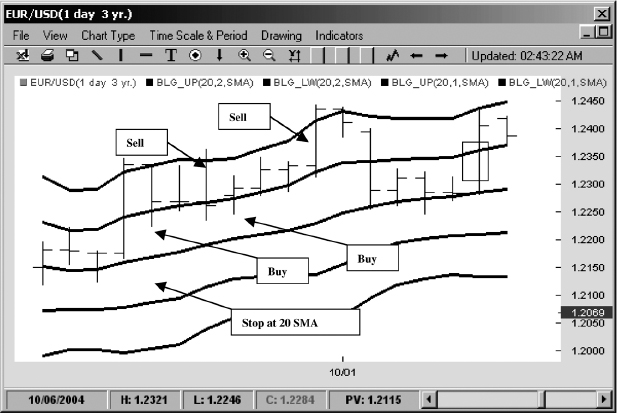
FIGURE 10.10 Scalping to Trend with Bollinger Band “Bands”
Source: FXtrek IntelliChart™. Copyright 2001–2005 FXtrek.com, Inc.
THE MACD TURN
Oscillators come in all shapes and sizes, but for my money nothing beats the MACD histogram for sheer simplicity or accuracy. The MACD turn, which is a setup I like to trade on anything from as small as 15-minute bar charts to as large as weekly candlesticks graphs, operates on a deceptively simple premise but actually uses rather fancy money management to turn it into success. The basic premise of the MACD turn is this: Momentum precedes price. That means in a battle between price and momentum always trust momentum.
Here is the setup in a nutshell (see Figure 10.11).
- Overlay Bollinger band “bands” on a chart using 20 SMA, 2 standard deviation, and 1 standard deviation settings.
- Overlay the MACD histogram using standard MACD settings of 9-period exponential moving average (EMA) and 12-period EMA.
- For short setups, price must be in the upper Bollinger band channel; for long setups, price must be in the lower Bollinger band channel.
- For a short setup look for the MACD histogram to print a lower high bar indicating that momentum is waning.
- Measure the distance between the low of the most recent bar and the most recent swing high.
- Place a sell stop at halfway between the two points for one-third of total position.
- If the trade is triggered, set a take-profit target at 20-period SMA.
- If price moves in the opposite direction of the trade and makes new swing highs but MACD histogram does not, sell another one-third of the position at market.
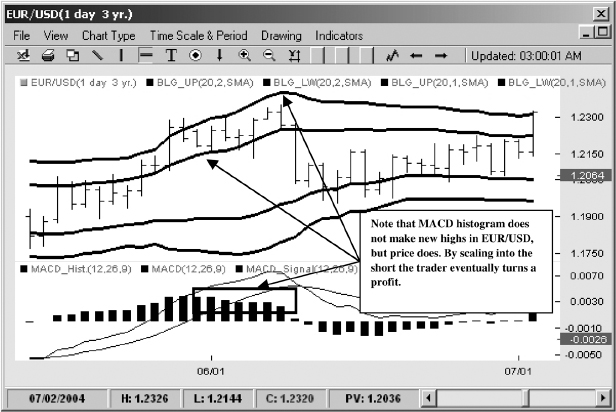
FIGURE 10.11 Trading MACD Histogram Rather Than Price
Source: FXtrek IntelliChart™. Copyright 2001–2005 FXtrek.com, Inc. - If price continues to move higher but MACD histogram has not exceeded new highs, sell final one-third of the position on next tag of upper Bollinger band.
- Stop out only if MACD histogram makes a new high.
- Reverse all steps for long setup.
As you can see, the MACD turn setup requires a lot of fancy money management but it does adhere to one simple trading rule—the trader enters the trade off an indicator trigger and exits the trade off an indicator trigger. One of the critical mistakes that many technically oriented traders make is to use an indicator-based entry but a price-based stop. This is the trading equivalent of comparing apples to oranges. The MACD turn was designed specifically to eliminate this problem.
As I've noted many times before, FX is one of the most active stop-hunting markets in the world. Dealers will always want to probe recent highs and new lows just to test out market sentiment and to pick up cheap inventory on the buy side as well as get rid of expensive product on the sell side. Therefore price in FX will often take out the swing highs or swing lows, sometimes by only a few points but sometimes by several hundred. The great value of the MACD turn is that it does not allow the trader to fall for this common bluff. As long as momentum does not reach new highs, the trader continues to scale into the trade and thereby achieves a better blended price.
The MACD turn, the way I trade it, is a very labor-intensive setup. It requires a lot of trade management to actively scale against the position and then quickly take off trades at the first sign of profit. Often I will even cover the most recent trade with the position and will go short or long once again if an opportunity presents itself. This setup the way I trade it can also suffer hideous losses. Basically the MACD turn with the scale-in approach manufactures many small profits but occasionally produces very large losses if prices never turn. Just like an insurance company that hopes to offset its few large losses by collecting many premiums (for all those in the insurance business—yes, I know it's not a perfect analogy, but please indulge me), the MACD turn follows the same business plan.
There are different ways to trade the same idea that may be more suitable for your style and risk profile. One interesting way to trade the MACD turn is to use a money management approach that is antithetical to the one I use. Instead of using a partial scale-in strategy, a trader can enter the position all at once, but in the case of a short trade, if the price made a new swing high on the next bar the trader would scale out of the position one-third of the total value at a time. This strategy may be very useful to traders uncomfortable with the idea of increasing risk as prices move against their positions. Instead of suffering ever-larger floating losses from adverse price movement, this method deleverages the trading account while at the same time allowing part of the trade to remain on the books in case of eventual turnaround to profit.
THE TAO OF RSI
The Relative Strength Index (RSI) is another indicator that works exceedingly well in the FX market, and it does so on all time levels from 15-minute charts to daily or even weekly graphs. As I've noted earlier in the book, there are myriad ways to trade RSI. Some traders even use it as a proxy for volume since volume is not reported in spot FX. They view a rapid increase in RSI much like they would a rapid increase in volume as a precursor to further price movement. Other traders will prefer to trade the RSI graph rather than the price graph because they believe that the normalization process of RSI provides a truer, more accurate picture of price action.
This setup is more straightforward than some of these methods. The Tao of RSI simply uses the original purpose of the indicator to find overbought and oversold areas and pick short-term tops and bottoms (see Figure 10.12).
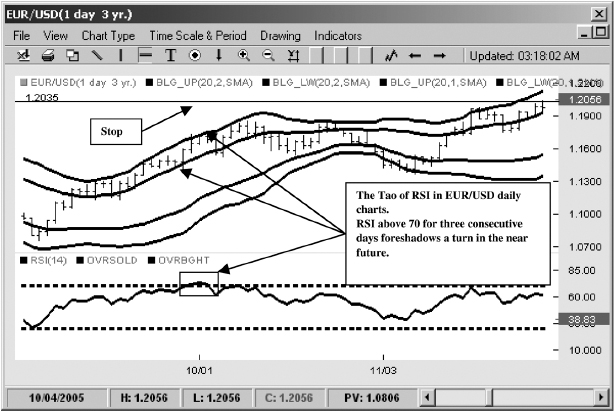
FIGURE 10.12 The Tao of RSI
Source: FXtrek IntelliChart™. Copyright 2001–2005 FXtrek.com, Inc.
- Lay out Bollinger band “bands” on a price graph (Bollingers with 20 SMA 2 SD and Bollingers with 20 SMA 1 SD).
- Plot RSI with standard setting of (14,1).
- If the price chart prints three consecutive bars with RSI readings of 70 or greater, short on the close of the third bar.
- Measure from the bottom of the first bar to the top of the third bar.
- Add that distance to the top of the third bar and place a stop there.
For a long setup the rules are:
- Lay out Bollinger band “bands” on a price graph (Bollingers with 20 SMA 2 SD and Bollingers with 20 SMA 1 SD).
- Plot RSI with standard setting of (14,1).
- If the price chart prints three consecutive bars with RSI readings of 30 or less, go long on the close of the third bar.
- Measure from the bottom of the first bar to the top of the third bar.
- Add that distance to the bottom of the third bar and place a stop there.
The exit rules for this setup can vary. Here are some possibilities:
1. If the price moves in your direction by the value of your stop (i.e., if you risked 100 points on the trade and it has moved 100 points in your favor), move your stop to the break-even point and target the opposite 2 standard deviation Bollinger band as exit.
This approach is the most aggressive and will result in many stop-outs and scratch trades, as it is very difficult to pick exact turns in the market. The risk/reward on this type of trade, however, will be superb, as the winning trades may likely generate three to four times the amount of points of losing trades, depending on the market volatility.
2. If the price moves in your direction by 70 percent the value of your stop (i.e., if you risked 100 points on the trade and it has moved 70 points in your favor), take profit on one-half of the position, move your stop to the break-even point, and target the opposite 2 standard deviation Bollinger band as exit for the rest.
This is the compromise approach that tries to harvest some profit right away, but allows the trader to benefit partially from a large turn in the market. It provides the psychological benefit of banking some profits quickly, which allows the trader to bask in the glow of a somewhat profitable trade, but at the expense of minimizing the full profit potential if the trade turns into a big winner.
3. If the price moves in your direction by 70 percent of the value of your stop (i.e., if you risked 100 points on the trade and it has moved 70 points in your favor), take full profit on the position.
This method will never produce outsized profits, but it is the highest-probability method of all three. For traders who don't mind building their fortune a nickel at a time, this may be the best approach as it tries to pinpoint the most oversold and overbought points on the price chart and then quickly skim off any retracement profits that occur. Note, however, that this strategy needs to be at least 60 percent accurate in order to make money.
Assume you make 10 trades, each with a 100-point stop. Six trades make 70 points for a total of 420 points, and four lose 100 points each for −400. The total would be a net profit of 20 points. If the trader was successful 70 percent of the time, the net profit would be 190 points [(7 × 70) − (3 – 100)]—showing the critical role of high probability in the success of this trading method.
The example also brings out a very important consideration that many novice traders overlook when testing these strategies. When measuring the efficacy of all these ideas it is very important to stay consistent in your trade time frames. For example, in the statement that the strategy requires 60 percent accuracy in order to be profitable, the implied assumption is that the trader will trade all 10 trades on the same time frame, which in the case of 100-point stops will most likely be the daily chart. Imagine, however, a trader who decides to trade this setup on a 15-minute chart risking 15 points for a 10-point target. He makes eight consecutive winning trades, harvesting 80 points of profit. Then emboldened by his success he moves over to a daily chart and decides to risk 100 points for a 70-point target. Unfortunately, the trade is a loser and he is stopped out. His total position after eight successful trades and one unsuccessful trade is a 20-point loss. Furious, the trader stops trading this idea, convinced that it doesn't work.
Unfortunately, this type of sloppy thinking is very prevalent among many new traders. The quest for easy money makes many novices abandon valuable technical tools before they properly learn how to use them.
Turning back to the Tao of RSI, however, we can see how effective this setup can be on any time frame.
Figure 10.13 shows the trade in AUD/USD on a 15-minute chart, while Figure 10.14 uses a daily graph. In both cases the RSI is able to accurately pinpoint the extremes and allow traders to make profitable turn trades.
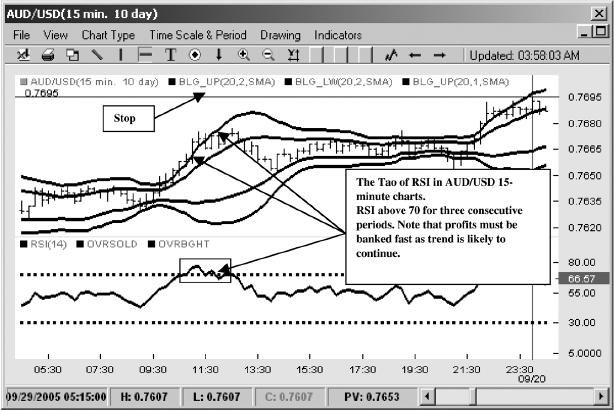
FIGURE 10.13 The Tao of RSI 15-Minute Chart
Source: FXtrek IntelliChart™. Copyright 2001–2005 FXtrek.com, Inc.
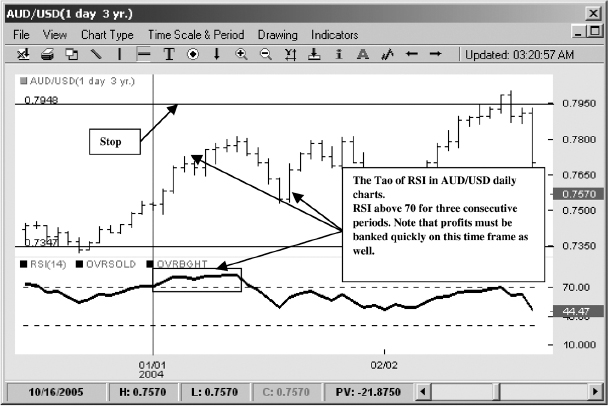
FIGURE 10.14 The Tao of RSI Daily Chart
Source: FXtrek IntelliChart™. Copyright 2001–2005 FXtrek.com, Inc.
TREND DETECTION WITH THREE SIMPLE MOVING AVERAGES
Up to now, I have shown you mainly trend exhaustion or turn setups. Part of the reason lies in my own contrarian nature, as I simply find it difficult to trade with the crowd. The other part is simply due to the fact that I genuinely find trend exhaustion easier to spot and trade. After all, it is easy to see a trend on a chart. However, once a trend is identified there are only three possibilities for where the price may go:
- Continuation
- Consolidation
- Reversal
Of the three choices, two can be successfully traded with trend exhaustion methods, providing a nice probability edge, which is why I am much more comfortable trading those strategies. There is, however, one low-risk trend method that I like very much, and it comprises my final setup.
Here are the rules for the three simple moving average (3 SMA) setup (see Figure 10.15):
- Place 7-period, 20-period, and 65-period simple moving averages on the chart.
- Wait until volatility declines and 7, 20, and 65 SMAs all compress together.
- As price breaks out in either direction watch for the 3 SMAs to fan out with the 7 above the 20 and the 20 above the 65 in the case of a long, and the 7 below the 20 and the 20 below the 65 in the case of a short.
- In the case of a long buy, as price retraces to the 7 SMA, place a stop a few points below the 65 SMA.
- Exit the trade when the 7 SMA crosses the 20 SMA.
In and of themselves moving averages are notoriously poor indicators because by definition they lag price action and send late signals that are vulnerable to whipsaws. However, the three simple moving average filter is designed to place the trader on the right side of the trend by making sure that short-term, intermediate-term, and long-term price forces are all aligned in the same direction. Furthermore, because this setup waits for low volatility environments it assumes very little risk for a potentially large reward. Price action itself can be very noisy. By showing the average price movement on the short-term, intermediate-term, and longer-term time frames, the 3 SMA setup can reveal the underlying direction that may not be visible through pure price action alone. The setup is still prone to stop-outs, but as Figures 10.16 and 10.17 show, when it catches the move the profits are large.
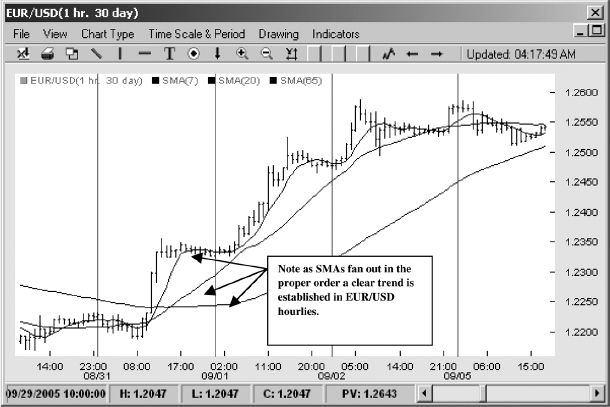
FIGURE 10.15 Three Simple Moving Average “Fan Out”
Source: FXtrek IntelliChart™. Copyright 2001–2005 FXtrek.com, Inc.
CONCLUSION
Technical analysis is a wonderful tool. Academics scoff at the value of indicators and chart patterns, blithely dismissing all price movement as random; but most real-life traders find technical analysis critical to their success. It is very difficult to mount an effective intellectual argument against the academics. To buttress their argument, researchers like to use fancy words such as stationarity (meaning that every time element in a series is independent of those preceding it) along with reams of statistical data to prove their points. On a practical level, however, the performance of thousands of technically oriented traders contradicts their thesis.
One simple example of how academic exercise is so far removed from the real world is the common assumption among academicians that any given trade has a 50 percent chance of success. I'll never forget a conversation I once had with Tom Sarnoff, who runs an options brokerage boutique called thinkorswin.com and prior to that was one of the biggest market makers on the floor of the Chicago Board Options Exchange. Tom, a true trader, once noted that while most novices approach the market thinking that their odds of success are 50–50, the actual odds are probably more like 25–75 against them.
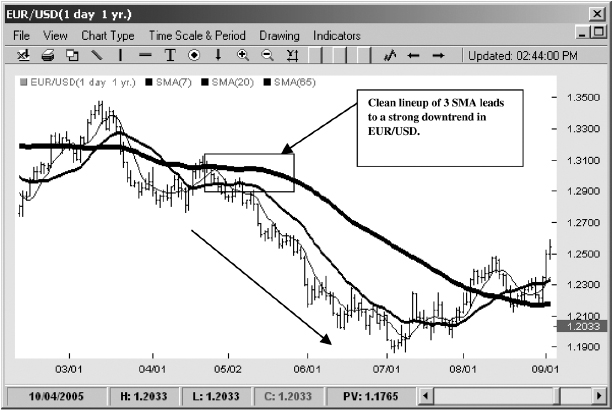
FIGURE 10.16 3 SMA Short in EUR/USD
Source: FXtrek IntelliChart™. Copyright 2001–2005 FXtrek.com, Inc.
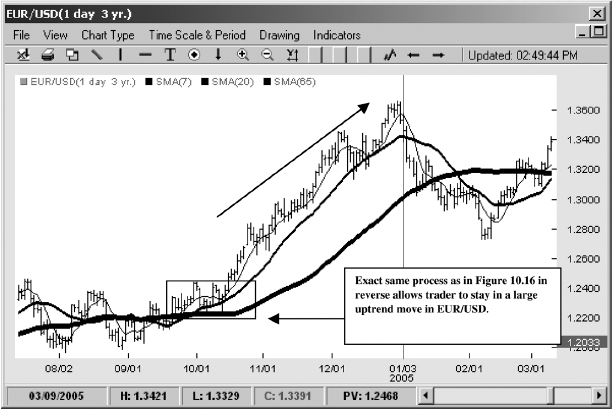
FIGURE 10.17 3 SMA Long in EUR/USD
Source: FXtrek IntelliChart™. Copyright 2001–2005 FXtrek.com, Inc.
Why? Because markets are driven not by some random number–generating machine, but by very skilled and wily human beings who constantly try to trap, bluff, and sucker newbies into losing their capital. Tom's insight explained several things. First, it demonstrates that almost all mechanical systems are doomed to fail or at the very least to trade very poorly for extended periods of time. Why? Because all systems are optimized for either range trading or trend trading. Once the environment changes they inevitably begin to degrade. Much like a frog that gets cooked in gradually hotter water, the systems are unable to adjust to the change in market conditions until it is too late.
Tom's point also explains a lot about my own journey. When I started trading seven years ago as a clueless newbie I remember a particularly nasty string of 12 consecutive losing trades followed by a cruel reprieve of one win and then an additional 10 losses. As I started to write this book in earnest in July 2005 I decided to actively day trade both my futures account in which I trade the E-mini Dow Jones index and my spot FX account in which I trade mainly the major pairs. I did this basically to see, as the saying in the software business goes, if I would eat my own dogfood—in other words, if I could trade successfully with technical analysis while I was writing a book on the subject. In the futures account I made 91 trades with 83 winners. In FX I made 46 trades and 42 of those were winners. So in seven years I went from generating a record of 1 win and 22 losses to compiling a string of 125 wins and 12 losses.
Now, does this prove anything? No, of course not. Any moderately knowledgeable analyst could make mincemeat of my data. For one, my few losses were much larger than my many wins. For another, my maximum adverse excursion (the amount I allowed positions to move against me) almost always exceeded my maximum gains. In the end I ended net positive in both accounts, making approximately 3 percent in futures and 16 percent in my currency account over that time frame. Still, any skilled statistician could easily argue that I was just lucky and the statistician may well be correct. But let's look at what I did differently this time versus my early years.
- I used technical analysis to pinpoint overbought and oversold areas and traded only when a specific setup appeared on the chart.
- I utilized risk management tactics that were in sync with my personality, which in my case called for taking profits very quickly. This type of trading generated many small wins and a few large losses that I was psychologically willing to accept.
- Once I developed my setups I was highly methodical in my approach—having thought through every possible scenario to the end. I knew exactly where I would get out on my winners and also what market conditions would force me to fold and accept my losers. I even had a plan for what I would do when my Internet connection would inevitably crash.
That's it. It's as simple as that. Comparing the results of my early years to my trading now, the single biggest difference can be summarized in one word: organization. The most random aspect of my early trading wasn't price action, but my own behavior. My responses to the market, like those of most novice traders, were wildly illogical and highly inconsistent. “The fault, dear Brutus, is not in our stars, but in ourselves,” as Shakespeare once wrote in Julius Caesar.
This is the primary reason why technical analysis is so valuable to trading. It systematizes and categorizes price data, allowing the trader to recognize discernible repetitive patterns. Technical analysis cannot guarantee success. It cannot accurately predict the next move. At best it can foreshadow and offer clues to future direction, most notably when momentum diverges from price action. This is the crux of its value. Yet for many skilled traders that is enough to provide a meaningful and profitable edge.
Success in trading can be summarized with three C's—confidence, consistency, and compounding. Confidence comes only from failure. That may sound convoluted, but allow me to explain. Confidence in trading is a direct result of experience. A trader needs to put on many trades—perhaps thousands of trades—before he will be comfortable and confident in his approach. He needs to see repetitive price patterns through a variety of market environments before he can develop the courage to consistently enter trades with strong expectation of profit. The sheer nature of this process implies that traders need to make many mistakes in order to acclimate themselves to the vagaries of the market. Thus confidence breeds consistency, and consistency leads to compounding of returns, which is the only path to wealth.
Trading with technical analysis, like any great vocation in life, is a never-ending study of self and the world around you. The currency market, with its massive liquidity, complete customization of size, and round-the-clock markets, makes this enterprise only that much more attractive. I truly enjoy the journey every day. I hope you will, as well.