CHAPTER 3
The Secret to Trading
Here is the secret to all trading.
Ready?
Prices will either trend or range. That's all there is to it. It really is that simple but clearly not that easy. These two discrete properties of price require diametrically opposite mind-sets and money management techniques. Knowing when to apply each is what makes trading so difficult. Fortunately, the FX market is uniquely suited to accommodate both styles, providing either trend or range traders with opportunities for profit. Since trend seems to be the more popular subject, let's examine it first.
What is trend? The simplest definition of trend is higher lows in an uptrend and lower highs in a downtrend. Some traders define trend as prices remaining within an upward or downward sloping 20-period moving average. Yet others may draw trend lines or channels. I have my own definition, involving Bollinger bands, which I will discuss later in the book, but regardless of how one defines trend, the goal of trend trading is the same—join the move early and hold the position until the trend exhausts itself. The basic mind-set of the trend trader is “I am right or I am out,” and his governing philosophy boils down to this: Do today what happened yesterday. The implied bet all trend traders make is that price will continue to follow its current direction. If it doesn't, there is little reason to hold on to the trade. Therefore, trend traders typically place very tight stops and often make several forays into the market in order to establish a proper entry.
By nature, trend trading generates far more losing trades than winning trades and requires rigorous risk control in order to achieve profits. The usual rule of thumb is that trend traders should never risk more than 1.5 to 2.5 percent of their capital on any given trade. On a $10,000 account trading 100,000-unit standard lots, that means stops as small as 15 to 25 pips behind the entry price. Clearly, in order to practice such a method, a trader must be confident that the market being traded is highly liquid. Of course the currency market is not only the most liquid market in the world but also the most fluid. Since the market trades 24 hours per day 5 days a week, it eliminates much of the gap risk found in exchange-based markets. Certainly gaps occur in FX, but not nearly as frequently as they happen in stock or bond markets, so slippage is far less of a problem.
When trend traders are right about the trade the profits can be enormous. This dynamic is especially true in FX where high leverage greatly magnifies the gains. It's not unusual to see a currency trend trader double his money in a short period of time if he catches a strong move. Here is a possible scenario of how it can be done. A trader starts out with $10,000 in his account. He uses a strict rule of 20-pip stops to limit his losses to 2 percent of capital. He may get stopped out five, six, or even ten times in a row, but if he finally catches a large move such as the 1,600-point decline in EUR/USD from January to July of 2005, his one-lot purchase would generate $16,000 in profit, easily increasing his account by 200 percent in a matter of months.
Of course few traders have the discipline to take constant stop-losses. Most traders dejected by a series of bad trades tend to become stubborn and fight the market, often placing no stops at all or removing the ones already in place. This is the time when FX leverage can become most dangerous. The same process that quickly produces profits can also generate massive losses. The end result is that many undisciplined traders suffer margin calls and lose most of their speculative capital on one or two bad trades.
Trading trend with discipline can be extremely difficult because if the trader uses high leverage he leaves little room to be wrong. Trading with very tight stops can result in 10 or even 20 consecutive stop-outs before a trader can find a trade with enough momentum and directionality to succeed.
For this reason many traders prefer to trade range-bound strategies. The typical process of range-bound trading involves isolating currencies that are trading in price channels and then selling at the top of the channel and buying at the bottom of the channel. This can be a very lucrative strategy, but in its essence it is still a trend-based idea, albeit one that anticipates an imminent countertrend. (What is a countertrend, after all, except a trend going the other way?)
True range traders don't care about direction. The underlying assumption of range traders is that no matter which way the currency is traveling at present it will most likely return to its point of origin. Range traders adhere to the concept of reversion to the mean. In fact, range traders bet on the possibility that prices will trade through the same levels over and over again, and their goal is to harvest all those oscillations for profit.
Clearly, range trading requires a completely different money management technique. Instead of looking for just the “right” entry, range traders actually prefer to be wrong at the outset, so they can build a trading position. For example, imagine that EUR/USD is in an uptrend and currently trading at 1.3000 (see Figure 3.1). A range trader may decide to short the pair at that level and every 100 pips higher, and then buy a portion of the trade back as it retraces every 100 pips down. His assumption is that eventually the pair will return to that original 1.3000 level. If EUR/USD indeed rises to 1.3500 and then turns back down to 1.3000, then the range trader will have been able to garner a handsome profit, especially if the currency moves back and forth in its climb to 1.3500 and its fall to 1.3000.
However, as we can see from this example, a range-bound trader will need to have very deep pockets in order to implement this strategy. In range trading, employing large leverage can be devastating, as positions can often go against the trader for many points in a row and, if he is not careful, trigger a margin call before the currency eventually turns.
Fortunately, the FX market provides a flexible solution for this type of trading. Most retail FX dealers offer mini lots of 10,000 units rather than 100,000 lots. For a pair like EUR/USD, in a 10,000-unit lot each individual pip is worth only $1 instead of $10 so the same hypothetical trader with a $10,000 account risking 2 percent per trade can have a stop-loss budget of 200 pips instead of only 20 pips. Even better, many dealers allow customers to trade in units of 1,000 or even 100-unit increments. Under that scenario our range trader trading 1,000-unit positions could withstand a 2,000-pip drawdown (with each pip now worth only 10 cents) before triggering a stop-loss. This flexibility allows range traders plenty of room to run their strategies.
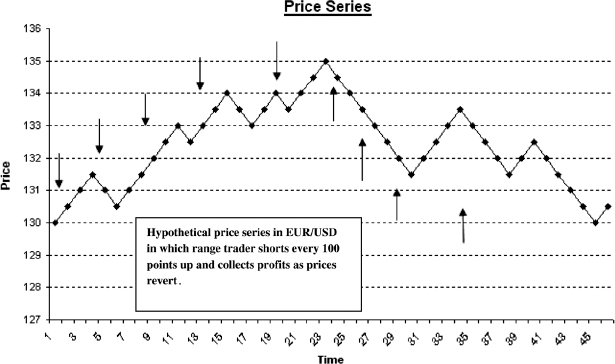
FIGURE 3.1 Hypothetical Range Trading Example
Because FX dealers do not charge commissions and will quote the same price regardless of whether a customer wants to deal for 100 units or 100,000 units, a range-trading strategy can be implemented with even a small account of $1,000, as long as the trader properly sizes his trades. Granted, this method is the trading equivalent of collecting pennies and nickels, but it is the only proper way to implement a range strategy without assuming a large risk of blowout.
TRENDING CURRENCIES
Which currencies tend to trend more? That is, of course, an impossible question. The obvious answer is that at any given time any pair can find itself in a trend or range environment. Still, as general rule of thumb, the majors and the commodity pairs tend to trend more since they directly express the big macroeconomic events of the day while the crosses (currency pairs that do not have USD in them) tend to be more range-bound.
For a technically oriented trader, one of the great aspects of this market is that unlike the stock market, which contains thousands of equities, the FX market trades only four major pairs and three commodity pairs of currencies. Certainly, there are many more currencies in the world than that, but these minor currencies, known as exotics, are not traded by many retail dealers and often have extraordinarily wide bid/ask spreads because of lack of liquidity. The vast majority of speculative capital in the currency market is concentrated in the following major pairs, and all retail FX dealers will make tight markets in these instruments.
| • EUR/USD | Euro–U.S. dollar |
| • USD/JPY | U.S. dollar–Japanese yen |
| • GBP/USD | British pound–U.S. dollar |
| • USD/CHF | U.S. dollar–Swiss franc |
It is certainly understandable why the United States, the European Union, and Japan would have the most active and liquid currencies in the world, but why the United Kingdom? After all, India has a larger gross domestic product (GDP) ($3.3 trillion vs. $1.7 trillion for the UK), while Russia's GDP ($1.4 trillion) and Brazil's GDP ($1.5 trillion) almost match the United Kingdom's total economic production. The explanation, as with so much of the FX market, is simply tradition. The United Kingdom was the first economy in the world to develop sophisticated capital markets, and at one time it was the British pound, not the U.S. dollar, that served as the world's reserve currency. Because of this legacy and because of London's primacy as the center of FX dealing in the world, the pound is considered one of the major currencies of the world. However, because the United Kingdom's economy is approximately one-tenth the size of those of the United States or European Union, liquidity in the pound can be a problem. That's why the GBP/USD will often move several hundred points per day as traders scramble to either cover or establish positions. For this reason the pound tends to be streakiest of the major pairs, which can be wonderful if you are on the right side of the trend and unbelievably painful if you are not.
The Swiss franc takes its place among the four majors because of Switzerland's famed neutrality, fiscal prudence, and long history of safety. At one time 40 percent of the “Swissie” was physically backed by gold, and to many traders in the FX market it is still known as “liquid gold.” In times of geopolitical turmoil or economic recessions, traders flock to the Swiss franc as a liquid safe haven for assets.
The largest major pair—in fact, the most liquid financial instrument in the world—is the EUR/USD. This pair turns over almost $1 trillion per day in volume as trading proceeds from Tokyo to London to New York. The two currencies represent the two largest economic entities in the world—the United States with an annual GDP of $11 trillion and the euro zone with GDP of approximately $10.5 trillion. Although in recent years U.S. economic growth has been far better than the euro zone's, the euro-zone economy generates net trade surpluses while the United States runs chronic trade deficits. The superior balance sheet position of the euro zone and the sheer size of the euro-zone economy have made the euro an attractive alternative reserve currency to the dollar. Many central banks of the world, including those of China, Russia, Brazil, and South Korea, have diversified some of their reserves into the euro. Clearly this process takes time and it highlights one of the key attributes of successful trend trading—the need for a much longer-term outlook. Take a look at Figures 3.2 and 3.3, two charts using a three simple moving average (3 SMA) filter.
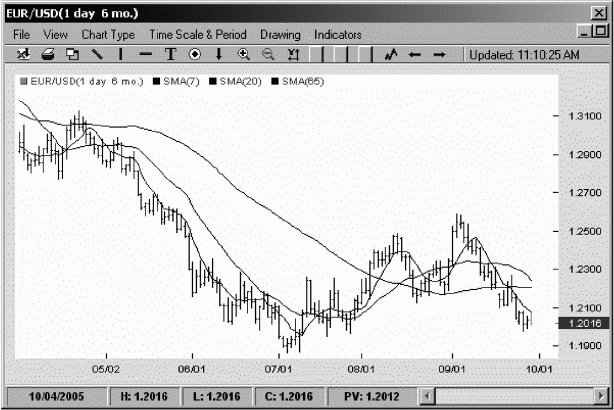
FIGURE 3.2 EUR/USD Daily Perspective
Source: FXtrek IntelliChart™. Copyright 2001–2005 FXtrek.com, Inc.
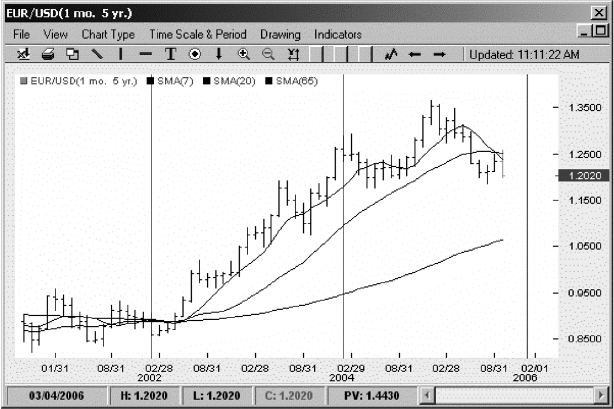
FIGURE 3.3 EUR/USD Monthly Perspective
Source: FXtrek IntelliChart™. Copyright 2001–2005 FXtrek.com, Inc.
The 3 SMA filter is a good way to gauge the strength of trend. The basic premise of this filter is that if the short-term trend (7 SMA), the intermediate-term trend (20 SMA), and the long-term trend (65 SMA) are all aligned in one direction, then the trend is strong. The importance of the 3 SMA filter does not lie in the specific SMA values, but rather in the interplay of the short-/intermediate-/long-term price trends as demonstrated by the three simple moving averages. As long as you use reasonable proxies for the short-, intermediate-, and long-term trends, the 3 SMA filter will provide valuable analysis.
Looking at the EUR/USD from two time perspectives, we can see how different the trend signals can be. Figure 3.2 displays the daily price action for the summer months of 2005, which shows choppy movement with a clear bearish bias. Figure 3.3, however, uses the monthly data for the past five years and paints a very different picture. According to Figure 3.3, EUR/USD has been in a clear up trend despite some very sharp corrections along the way.
Warren Buffett, the famous investor who is well known for making long-term trend trades, has been heavily criticized for holding on to his massive long EUR/USD position, which has recently suffered some losses. Looking at Figure 3.3, which offers a much longer time perspective, it becomes much clearer why Mr. Buffett often has the last laugh in the financial markets.
| • USD/CAD | U.S. dollar–Canadian dollar |
| • AUD/USD | Australian dollar–U.S. dollar |
| • NZD/USD | New Zealand dollar–U.S. dollar |
The three most liquid commodity currencies in FX markets are USD/CAD, AUD/USD, and NZD/USD. The Canadian dollar is affectionately known as the “loonie,” the Australian dollar as the “Aussie,” and the New Zealand dollar as the “kiwi.” These three nations are tremendous exporters of commodities and often trend very strongly in concert with demand for their primary export product. Figure 3.4 shows the performance of the Canadian dollar and crude oil prices. Canada is the largest exporter of oil to the United States, with almost 10 percent of its GDP comprised of the energy exploration sector. Because USD/CAD trades inversely (it falls as CAD goes up in value), Canadian dollar strength creates a downtrend in the pair.
Although Australia does not have many oil reserves, the country is a very rich source of precious metals and iron ore and is also the second-largest exporter of gold in the world. In Figure 3.5 note how a rally in gold from December 2002 to November 2004 coincided with a very strong up move in the Australian dollar.
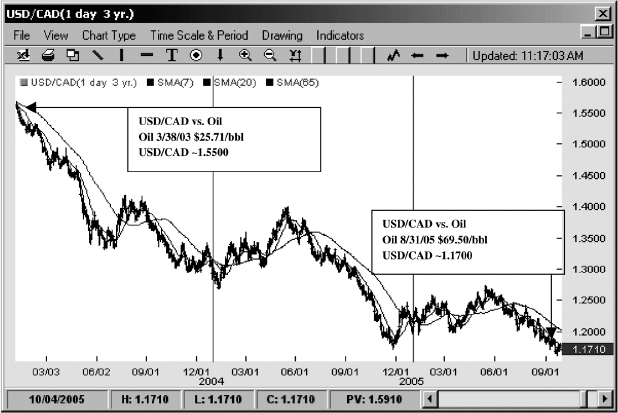
FIGURE 3.4 USD/CAD versus Oil
Source: FXtrek IntelliChart™. Copyright 2001–2005 FXtrek.com, Inc.
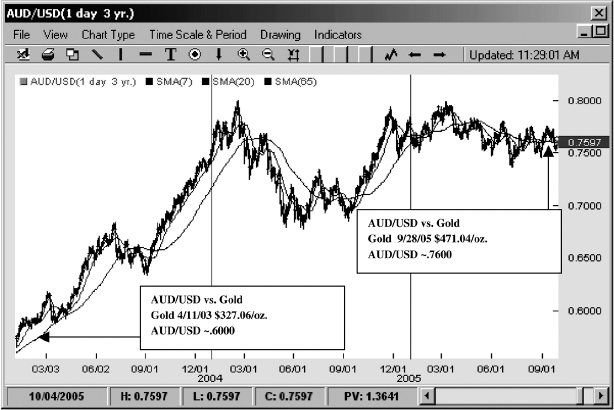
FIGURE 3.5 AUD/USD versus Gold
Source: FXtrek IntelliChart™. Copyright 2001–2005 FXtrek.com, Inc.
CROSSES ARE TYPICALLY BEST FOR RANGE TRADING
In contrast to the majors and commodity block currencies, which can offer traders some of the strongest and longest trending opportunities, currency crosses often present the best range-bound trades. Crosses are simply combinations of majors and commodity currencies that do not have the U.S. dollar as part of the pairing. There are more than 18 combinations of major and commodity crosses, but some of the most actively traded include the following pairs:
- EUR/JPY—one of the most active pairings in the currency world, as it is the primary hedging instrument for the massive amount of trade between Europe and Asia.
- GBP/JPY—a very active cross among carry trade speculators because of the wide interest rate differentials that have developed between the UK and Japan since the beginning of the millennium.
- AUD/JPY—yet another widely traded carry-based cross that often attracts flows from Japanese pensioners seeking income from much higher-yielding Australian bonds.
- EUR/GBP—a very active cross that reflects trade flows and economic performance disparities between the UK and the euro zone.
- EUR/CHF—a more muted cross that often trades on economic and political differentials between the two regions.
- CAD/JPY—one of the purest ways to express an opinion on oil in the currency market, as Canada is the primary beneficiary of high oil prices in the industrialized world while Japan is the greatest victim.
The EUR/CHF is perhaps the best range-bound pair to trade at the present time. The key reason for such tight trading is that there is very little difference between the growth rates of Switzerland and the European Union. Both regions run current account surpluses and adhere to fiscally conservative policies. Furthermore, as Switzerland's largest trading partner and biggest export market, the euro zone and its economic fate greatly impact Switzerland's economy.
One strategy for range traders is to determine the parameters of the range for the pair, divide them by a median line, and simply buy below the median and sell above it. For example, in EUR/CHF, range traders could establish 1.5600 as the top and 1.5280 as the bottom of the range with 1.5440 as the median line demarcating the buy and sell zones (see Figure 3.6).
Range traders are agnostic about direction. They simply want to sell relatively overbought conditions and buy relatively oversold conditions. One of the reasons that cross currencies are so attractive for this strategy is because imbalances between culturally and economically similar countries tend to return to equilibrium. The same cannot be said for stocks. It is hard to fathom that Switzerland would go into a depression while the rest of Europe merrily expands. In contrast, it is quite easy to imagine that while General Motors may file for bankruptcy Daimler Chrysler would continue to do business. Because currencies represent macroeconomics, they are not nearly as susceptible to microeconomic risk as individual company stocks and are therefore much safer to range trade.
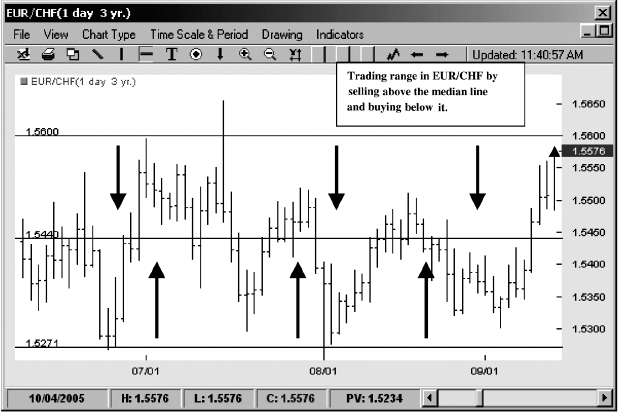
FIGURE 3.6 EUR/CHF: Example of Narrow Range
Source: FXtrek IntelliChart™. Copyright 2001–2005 FXtrek.com, Inc.
Nevertheless, risk is present in all speculation, and traders should never range trade any pair without a stop. A reasonable strategy is to employ a stop at one-half the amplitude of the total range. In the case of EUR/CHF, the stops would be at 160 pips above the high and 160 below the low. In other words, if this pair reached 1.5800 or 1.4800 the trader should stop himself out of the trade because range would most likely have been broken.
INTEREST RATES—THE FINAL PIECE OF THE PUZZLE
While EUR/CHF can have a relatively tight 320-pip range, a pair like GBP/JPY has seen a far larger 3,000-pip range (see Figure 3.7). What is the difference? Interest rates.
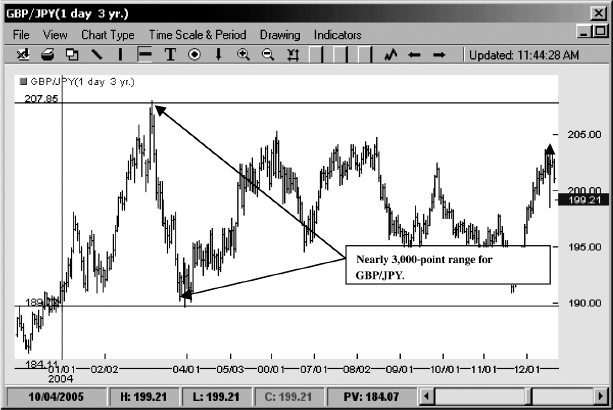
FIGURE 3.7 GBP/JPY: Example of Wide Range
Source: FXtrek IntelliChart™. Copyright 2001–2005 FXtrek.com, Inc.
At the time of writing in August 2005, Switzerland had an interest rate of 75 basis points and euro-zone rates were 200 basis points, creating a differential of only 125 basis points. The interest rates in the United Kingdom, however, stood at 475 basis points, while in Japan—which was still mired in deflation—rates remained at 0 basis points for a whopping 475-basis-point differential. The rule of thumb in FX is the larger the interest rate differential the more volatile the pair.
Table 3.1 lists various crosses, their interest rate differentials, and the maximum pip movement from high to low over the past 12 months.
TABLE 3.1 Range Values versus Interest Rate Differentials
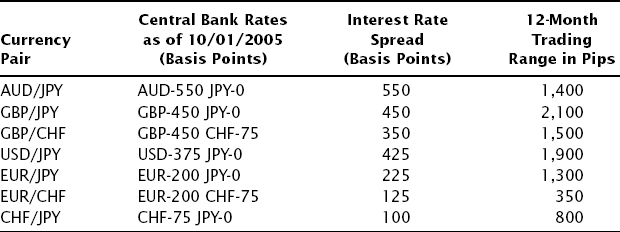
While the relationship is far from perfect, it is certainly substantial. Note how pairs with wider interest rate spreads typically trade in larger ranges. Thus, when contemplating range-trading strategies in FX, traders must be keenly aware of rate differentials and adjust for volatility accordingly. Failure to take interest rate differentials into account could turn potentially profitable range-trading ideas into losing propositions. The FX market is incredibly flexible in its ability to accommodate both trend and range traders, but proper knowledge is key to successful implementation of either range-trading or trend-trading strategies.