
If a steep change-of-cost curve makes Agile methods such as XP impossible, how much should you invest in making preparations for a development project? Some decision makers draw on analogies such as, “We pay an architect 10% of the cost of a building, so that’s what we’ll pay for software architecting.” But what percentage is really appropriate for software? Perhaps 10% is way too little or way too much. Many cost-cutting decision makers see that software architecting doesn’t directly produce the product, and as a result try to minimize its cost. But this often leads to an increased amount of late rework and embarrassing overruns in time and costs. Here again, any relevant evidence on “how much architecting is enough?” would be highly valuable for enterprise or project decision makers.
Evidence on how the costs of making changes or fixes vary phase by phase for large software projects was reported by several organizations in the 1970s, including IBM [Fagan 1976], GTE [Daly 1977], TRW [Boehm 1976], and Bell Labs’ Safeguard project [Stephenson 1976]. These studies found rather consistently that a post-delivery software change was about 100 times as expensive as a requirements-phase software change. Figure 10-2, taken from the 1981 book Software Engineering Economics [Boehm 1981], summarizes the results of these studies and a few others. It shows that, although the 100:1 ratio was generally true for large systems, a 5:1 ratio was more characteristic of smaller systems (2,000–5,000 source lines of code) [Boehm 1980].
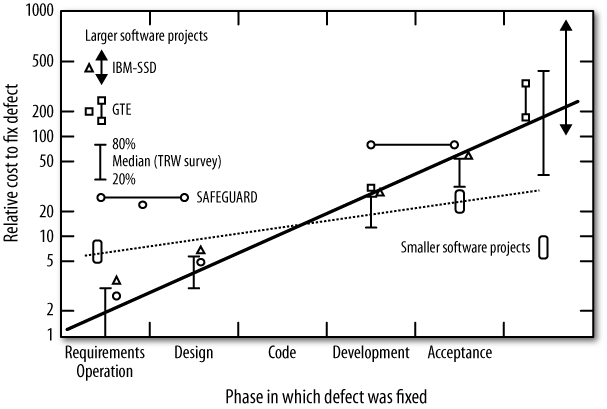
Considerable uncertainty has arisen over whether these escalation factors remain representative in today’s software development environment. To explore this and related questions, the National Science Foundation–sponsored Center for Empirically-Based Software Engineering (CeBASE), formed by the University of Maryland and the University of Southern California, performed a literature search and held three e-workshops involving people with relevant experience and data [Shull et al. 2002]. The results tended to confirm the 100:1 ratio for large projects, with factors of 117:1 and 137:1 recorded, and a 1996 survey showing a range of 70–125:1 [McGibbon 1996]. However, related e-workshop discussions indicated that investments in early requirements and design verification and validation by large projects could reduce the slope of the cost-to-fix curve from 100:1 down to as low as 20:1. A major success story that did even better in this regard—and the only project to my knowledge with experience data to match the flat curve in Figure 10-1—is the million-line CCPDS-R project described in the next section [Royce 1998].
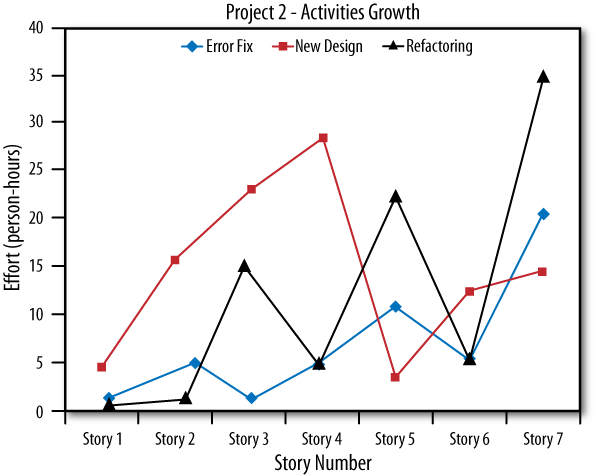
Although Beck and others have provided anecdotal data on Agile change experiences fitting Figure 10-1, empirical data on small Agile projects fails to bear out the claims. For example, a recent summary of two small commercial Java projects mostly following some XP practices (pair programming, test first, on-site customer) and compliant with the remaining practices, does provide empirical data on Agile cost-of-change, as shown in Figures 10-3 and 10-4 [Li and Alshayeb 2002].
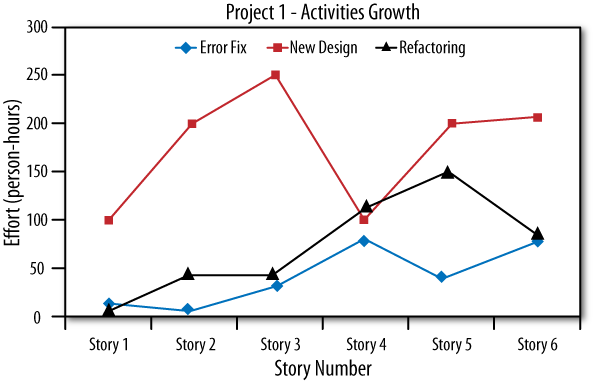
No data was available in these studies on the number of changes and the effort per change, but the percentage of total story development effort for Project 1 shows an average increase from one story to the next of roughly 6% per story for refactoring (from 0% of total effort to roughly 35% of total effort across six new stories), and about 4% per story for error fixes (from 0% of total effort to roughly 25% of total effort across six new stories). The corresponding figures for Project 2 are roughly 5% and 3%. These are nontrivial rates of increase, and although clearly not as good as the anecdotal experiences of Agile experts, more likely to represent mainstream XP experience. The small decrease in rates from Project 1 to Project 2 indicates a small, but not dominant, learning curve effect for the XP process.
[Reifer 2002] cites some proprietary empirical data with similar characteristics. Another corroborative data point is the XP ThoughtWorks lease management project experience report in [Elssamadisy and Schalliol 2002]. Once the project size reached over 50 people, 1,000 stories, and 500,000 lines of code, they noted that “[e]veryone says that all the story cards were finished at the proper times [in 30 days], but it still takes 12 weeks of full-time development effort to deliver a quality application to the customer.”