
The ability to switch from one view to another, to switch tables in a sheet view, and to add or remove fields in a view gives you tremendous versatility in how you see your project information. You can take it a step further by sorting, grouping, and filtering the information in a view.
By sorting information in a table, you can arrange it in alphabetical or numerical order by a particular field. For example, you might sort your tasks by start date so that you can see tasks that are due to start next week. Or you might sort your tasks by duration so that you can see the tasks with the longest durations and how you might break them up and bring in the project finish date.
You can also sort resources. For example, in the Resource Sheet, you might have originally entered all resources as they came on board, but now you want to see them in alphabetical order. You can easily sort by the resource name. Better yet, you can sort by department or group name and then by resource name.
To sort items in a sheet view, do the following:
Display the sheet view containing the information you want to sort.
The sort operation applies only to the current view.
On the View tab, in the Data group, click Sort.
In the submenu that appears, commonly used sort fields are presented. For example, if you’re working in the Gantt Chart, you can quickly sort by Start Date, Finish Date, Priority, Cost, or ID. If you’re working in the Resource Sheet, you can quickly sort by Cost, Name, or ID.
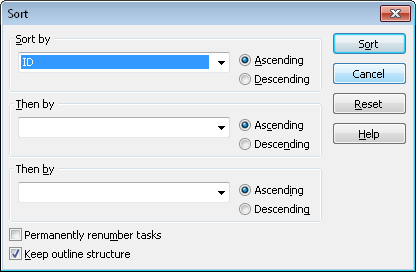
If you want to sort by a different field than what’s presented in the submenu, click Sort By. The Sort dialog box appears, as shown in Figure 4-26.
Under Sort By, click the name of the field you want to sort by, and then specify whether you want the sort to be ascending (lowest to highest) or descending (highest to lowest). If you want to sort within the sort, add another field in one or both of the Then By boxes.
Make sure that the Permanently Renumber check box is cleared. In the majority of cases, you will want this check box cleared. However, if you really want this sort to be permanent, and you’re certain that you won’t ever want to return to the original order of the tasks or resources, select this check box. This causes the ID numbers for the tasks or resources to be changed, and the tasks or resources are always sorted by order of their ID numbers when you don’t have any other sort order applied.
Click Sort.
The current sheet view is sorted according to your specifications.
If you sort tasks by duration, start date, or finish date, and if you have manually scheduled tasks that don’t have that information filled in yet, those tasks will be sorted at the bottom.
To return a sorted sheet view to its original order, click View, Data, Sort, By ID.
Think of grouping as a more sophisticated kind of sorting, in which a graphical layout is applied to a sheet view to segregate the groupings you’ve chosen. For example, suppose that you group your task sheet by complete and incomplete tasks. Tasks that are 0 percent complete (not started yet) are grouped first and marked by a yellow band (see Figure 4-27). Tasks that are 1–99 percent complete (in progress) are grouped next, bounded by another yellow band. Tasks that are 100 percent complete are grouped last.
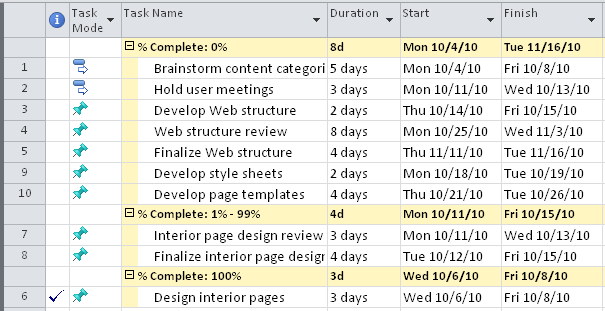
The grouping band shows the title of the group—for example, Percent Complete: 0%. Where appropriate, the grouping band also rolls up information summarized from the group, such as the total duration for the grouping, the earliest start date for all tasks in the grouping, the latest finish date for all tasks in the grouping, and so on.
Built-in Task Groups
When a task view is showing, all built-in task groups appear on the View tab, in the Data group, in the Group By box. These built-in task groups are:
Active V. Inactive
Auto Scheduled V. Manually Scheduled
Complete And Incomplete Tasks
Constraint Type
Critical
Duration
Duration Then Priority
Milestones
Priority
Priority Keeping Outline Structure
Resource
Status
You can also group resources in a resource sheet. For example, you might want to group resources by their department or code or by resource type (work or material).
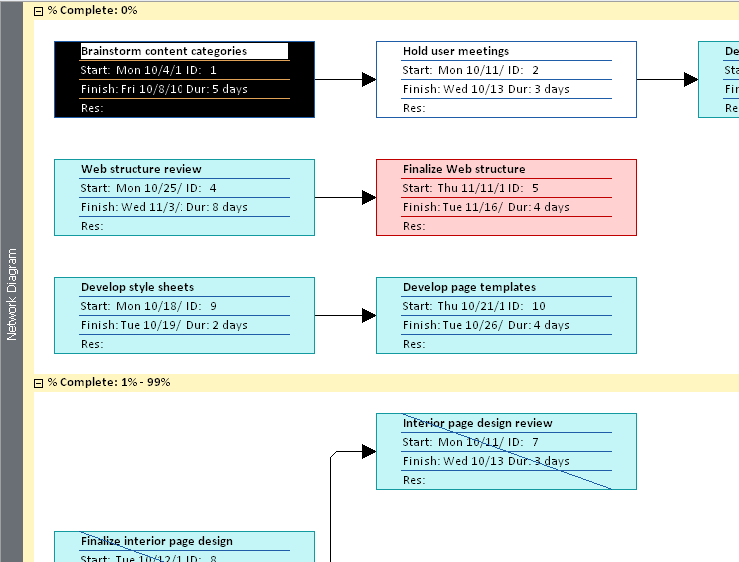
You can also group nodes in the Network Diagram view, as shown in Figure 4-28.
To group task or resource information in a sheet view or the Network Diagram view, follow these steps:
Display the view in which you want to show the grouping.
The group operation applies only to the current view.
On the View tab, in the Data group, click the arrow in the Group By box.
In the drop-down menu that appears, click the grouping you want.
The view is grouped according to the category you selected.
If you group tasks by duration, start date, or finish date, and if you have manually scheduled tasks that don’t have that information filled in yet, those tasks are grouped at the bottom under the No Value subcategory.
The groupings are not interactive; that is, if you change task information that makes the task belong in another group, it doesn’t automatically move to that other group. You need to reapply the grouping.
To remove a grouping, on the View tab, in the Data group, click the arrow in the Group By box, and then click No Group.
You can customize built-in groups and create entirely new groups as well. You can group by fields, including custom outline codes that you create.
Note
For more information about changing existing groups or creating your own, see Customizing Groups.
When you filter a view, you exclude information you don’t need to see so you can focus on what you do need to see. For example, if you want to see only tasks that use a particular resource so that you can more closely analyze the workload, you can apply the Using Resource filter. Or if you’re about to attend a status meeting and want to discuss tasks that are either in progress or not started, you can apply the Incomplete Tasks filter to a task sheet.
You can also apply filters to a resource sheet. If you want to examine all resources that are running over budget, for example, you can apply the Cost Overbudget filter. Or if you want to see only your material resources, you can apply the Resources—Material filter to a resource sheet.
To filter information in a view, follow these steps:
Display the view in which you want to show filtered information.
You can filter information in all views. However, the filter operation applies only to the current view.
On the View tab, in the Data group, click the arrow in the Filter box.
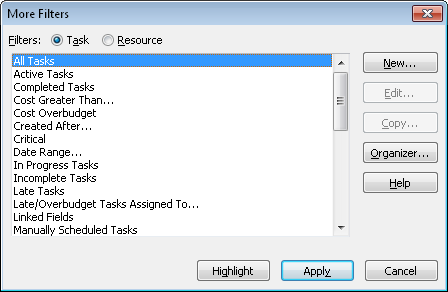
If the filter you want is listed in the drop-down menu, click it. If the filter is not in the submenu, click More Filters, and then find and click it in the More Filters dialog box. (See Figure 4-29.) Click Apply.
If a filter requires additional information, enter that information in the dialog box that appears, and then click OK.
For example, if you select the Date Range filter, you are prompted to enter dates for the tasks you want to see. If you’re filtering a resource view by Group, you are prompted to enter the resource group name.
The view is filtered according to your specifications.
Note
A filter excludes tasks or resources that do not meet the conditions of that filter. If you prefer, you can instead have the filter highlight tasks or resources that do meet the filter conditions while leaving the other tasks or resources visible. On the View tab, in the Data group, click the arrow in the Highlight box, and then click the criteria for the highlighting.
To remove a filter and show all tasks or all resources again, on the View tab, in the Data group, click the arrow in the Filter box, and then click No Filter.
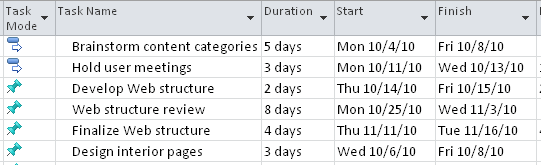
Using AutoFilter, you can quickly filter tasks or resources by a value in a particular field or column. In Project 2010, the AutoFilter arrows are already displayed for all columns in sheet views.
To filter information using AutoFilter, follow these steps:
Display the sheet view whose information you want to autofilter.
If the AutoFilter arrows are not showing in the column headings, on the View tab, in the Data group, click the arrow in the Filter box, and then click Display AutoFilter.
The AutoFilter arrows appear in each column heading in the sheet view.
Click the arrow in the column whose information you want to filter by, and then click the value you want to filter by.
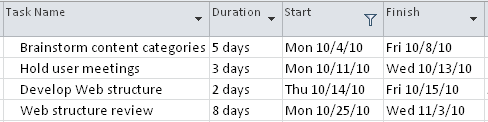
For example, suppose that you are displaying the Gantt Chart with the Entry table applied. If you want to filter for all tasks scheduled to start in April, click the AutoFilter arrow in the Start column, clear the Select All check box, and then select the April check box.
When AutoFilter is applied, the AutoFilter icon appears in the column heading.
To show all tasks or resources again, click the AutoFilter icon in the column heading, and then select the Select All check box.
The AutoFilter arrows remain handy in the column headings for all views throughout your project plan unless you turn AutoFilter off. If you want to turn AutoFilter off, on the View tab, in the Data group, click the arrow in the Filter box, and then click Display AutoFilter.
Note
You can customize built-in filters and create entirely new filters as well. You can also create custom AutoFilters. For more information, see Customizing Filters.