 Automatically Scheduling Tasks
by Teresa S. Stover, Bonnie Biafore, and Andreea Marinescu
Microsoft® Project 2010 Inside Out
Automatically Scheduling Tasks
by Teresa S. Stover, Bonnie Biafore, and Andreea Marinescu
Microsoft® Project 2010 Inside Out
- Microsoft® Project 2010 Inside Out
- SPECIAL OFFER: Upgrade this ebook with O’Reilly
- A Note Regarding Supplemental Files
- Introduction
- I. Project Fundamentals
- 1. Introducing Microsoft Project 2010
- 2. Understanding Projects and Project Management
- II. Developing the Project Plan
- 3. Starting a New Project
- Getting from Idea to Proposal to Project
- Focusing the Project Vision
- Creating a New Project Plan
- Entering Tasks
- Sequencing and Organizing Tasks
- Organizing Tasks into an Outline
- Setting Up Your Work Breakdown Structure
- Adding Supplementary Information to Tasks
- 4. Viewing Project Information
- Understanding Project Information Categories
- Accessing Your Project Information
- Switching Between Views
- Using Views
- Scheduling with Gantt Charts
- Highlighting Tasks with the Timeline
- Flowcharting with Network Diagrams
- Visualizing the Project with the Calendar
- Reviewing Assignments with the Team Planner
- Charting Team Availability with the Resource Graph
- Tabling with Sheet Views
- Timesheeting with Usage Views
- Seeing Details with Forms
- Cross-Referencing with Combination Views
- Using Tables
- Using Fields
- Arranging Your Project 2010 Window
- Navigating to a Specific Location in a View
- Rearranging Your Project Information
- 5. Scheduling Tasks Manually or Automatically
- 6. Building Your Schedule
- 7. Setting Up Resources in the Project
- Understanding the Impact of Resources in the Plan
- Adding Resources to the Project
- Removing a Resource from the Project
- Identifying Tentative, Generic, or Budget Resources
- Setting When Resources Are Available for Work
- Adding Detailed Resource Information
- 8. Assigning Resources to Tasks
- Assigning Work Resources to Tasks
- Assigning Material Resources to Tasks
- Assigning Cost Resources to Tasks
- Reviewing Assignment Information
- Changing Resource Assignments
- Contouring Resource Assignments
- 9. Planning Resource and Task Costs
- 10. Checking and Adjusting the Project Plan
- Working with the Critical Path and Critical Tasks
- Controlling Schedule Changes with Task Types
- Bringing in the Project Finish Date
- Reducing Project Costs
- Balancing Resource Workloads
- Changing Project Scope
- Reviewing the Impact of Changes
- Obtaining Buyoff on the Project Plan
- 3. Starting a New Project
- III. Tracking Progress
- 11. Setting a Baseline and Updating Progress
- Saving Original Plan Information Using a Baseline
- Updating Task Progress
- Updating Actual Costs
- 12. Responding to Changes in Your Project
- 11. Setting a Baseline and Updating Progress
- IV. Reporting and Analyzing Project Information
- 13. Reporting Project Information
- Establishing Your Communications Plan
- Using Views to Report Project Information
- Generating Text and Visual Reports
- Generating the Right Reports
- Summarizing with Overview Reports
- Focusing on Tasks with Schedule Progress Reports
- Using the Unstarted Tasks Report
- Using the Tasks Starting Soon Report
- Using the Tasks In Progress Report
- Using the Completed Tasks Report
- Using the Should Have Started Tasks Report
- Using the Slipping Tasks Report
- Using the Baseline Report in Visio
- Using the Baseline Work Report in Excel
- Using the Task Status Report in Visio
- Using the Budget Work Report in Excel
- Analyzing Budget Status with Cost Reports
- Using the Cash Flow Report
- Using the Cash Flow Report in Excel
- Using the Cash Flow Report in Visio
- Using the Baseline Cost Report in Excel
- Using the Budget Report
- Using the Budget Cost Report in Excel
- Using the Resource Cost Summary Report in Excel
- Using the Overbudget Tasks Report
- Using the Overbudget Resources Report
- Using the Earned Value Report
- Using the Earned Value Over Time Report in Excel
- Evaluating Resource Allocation with Assignment Reports
- Using the Who Does What Report
- Using the Who Does What When Report
- Using the To-Do List
- Using the Overallocated Resources Report
- Using the Resource Availability Report in Visio
- Using the Resource Work Availability Report in Excel
- Using the Task Usage Report
- Using the Resource Usage Report
- Using the Resource Work Summary Report in Excel
- Using the Resource Remaining Work Report in Excel
- Using the Resource Status Report in Visio
- Revising a Built-In Report
- Building a Custom Report
- Saving Project Data Fields
- Sharing Project Reports Electronically
- 14. Analyzing Progress Using Earned Value
- 13. Reporting Project Information
- V. Managing Multiple Projects
- 15. Managing Master Projects and Resource Pools
- Structuring Master Projects with Subprojects
- Consolidating Project Information
- Opening Multiple Project Files as a Set
- Sharing Resources by Using a Resource Pool
- 16. Exchanging Information Between Project Plans
- 15. Managing Master Projects and Resource Pools
- VI. Integrating Project 2010 with Other Programs
- 17. Exchanging Information with Other Applications
- 18. Integrating Project 2010 with Excel
- 19. Integrating Project 2010 with Visio
- 20. Integrating Project 2010 with Outlook
- 21. Collaborating as a Team by Using SharePoint
- Creating a Project Tasks List on a SharePoint Site
- Exchanging Project Information with SharePoint
- Synchronizing Changes Between Project and SharePoint
- Opening and Viewing Connected Project Information
- Collaborating with Team Members on Task Updates
- Assigning Tasks to Team Members
- Updating Task Progress
- Updating Task Progress in SharePoint
- Updating Task Progress in Project
- VII. Managing Projects Across Your Enterprise
- 22. Understanding Enterprise Project Management
- 23. Administering Your Enterprise Project Management Solution
- Signing In and Out
- Configuring Project Server Security
- Administering the Enterprise Resource Pool
- Establishing the Enterprise Portfolio
- Setting Up Project Workflows
- Standardizing Enterprise Project Elements
- Setting Up Team Member Work Pages
- Managing Pages, Views, and Reports
- 24. Managing Enterprise Projects and Resources
- Connecting to Your Project Server
- Working with Enterprise Projects
- Following a Project Workflow
- Building Your Enterprise Project Team
- Finding Resources to Meet Your Needs
- Building Your Project Team in Project Professional
- Building Your Project Team in Project Web App
- Identifying Resource Attributes by Using Custom Enterprise Fields
- Using Generic Resources as Placeholders
- Adding a Team Assignment Pool to Your Project Resource List
- Finding Enterprise Resources That Meet Specific Criteria
- Review Resource Assignments and Availability
- Replacing an Existing Project Resource with an Enterprise Resource
- Matching an Existing Project Resource
- Matching and Replacing Generic Resources
- Proposing Tentative Resources
- Assigning Tasks to Enterprise Resources
- Finding Resources to Meet Your Needs
- Collaborating with Your Project Team
- 25. Participating on a Team Using Project Web App
- Getting Started with Project Web App
- Working with Your Assignments
- Submitting Text-Based Status Reports
- Logging Time by Using Timesheets
- Working with Issues and Risks
- Setting Up E-Mail Reminders and Outlook Tasks
- Managing Resources in Project Web App
- 26. Making Executive Decisions Using Project Web App
- 27. Managing and Analyzing Project Portfolios
- VIII. Customizing and Managing Project Files
- 28. Customizing Your View of Project Information
- Customizing Views
- Changing the Content of a View
- Creating a New View
- Saving a View
- Changing Text Formatting in Views
- Formatting a Gantt Chart View
- Modifying the Timescale
- Modifying a Network Diagram
- Modifying the Timeline
- Modifying the Team Planner
- Modifying the Resource Graph
- Modifying the Calendar
- Modifying a Sheet View
- Modifying a Usage View
- Customizing Tables
- Customizing Fields
- Working with Outline Codes
- Customizing Groups
- Customizing Filters
- Sharing Customized Elements Among Projects
- Customizing Views
- 29. Customizing the Project 2010 Interface
- 30. Automating Your Work with Macros
- 31. Standardizing Projects by Using Templates
- 32. Managing Project Files
- Saving Project Files
- Opening Project Files
- Saving and Opening with Different File Formats
- Comparing Project Plans Side by Side
- Safeguarding Your Project Files
- 28. Customizing Your View of Project Information
- IX. Appendixes
- D. Index to Troubleshooting Topics
- E. About the Authors
- Index
- About the Authors
- SPECIAL OFFER: Upgrade this ebook with O’Reilly
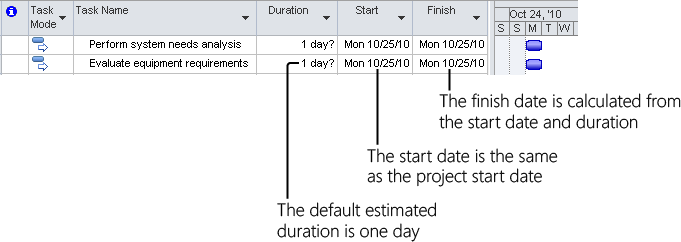
If you have used previous versions of Microsoft Project, you’re already familiar with automatically scheduled tasks. When you type the name of a task that’s identified for automatic scheduling, the default estimated duration of 1 day is entered, the default start date is the same as the project start date, and the finish date is calculated from the start date and duration. (See Figure 5-3.)
As you refine the durations, link tasks, and possibly enter date constraints or assign resources, Project 2010 calculates your schedule to reflect those controls.
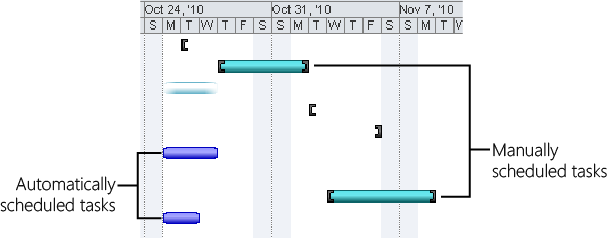
Automatically scheduled tasks are marked with the Gantt bar icon in the Task Mode field of the Gantt Chart. You can also add this field to other sheet views when you need to distinguish between manually and automatically scheduled tasks.
The chart area of the Gantt Chart shows traditional Gantt bars in their default medium blue. This is in contrast with the various visual cues associated with a manually scheduled task, which might show a start date marker, a finish date marker, a duration, or some combination of the three in a variegated light blue (by default). (See Figure 5-4.)
-
No Comment