
If you’re a resource manager, or if your biggest project priority is to maintain a balanced workload among your resources, monitor your resources’ workload and see if anyone is unexpectedly overallocated or underallocated. As you receive information from resources about their assigned tasks and enter actuals, you can see whether you need to take any action to prevent potential resource allocation problems in the near future.
Do one or more of the following to help you monitor and adjust the schedule to achieve a balanced resource workload:
Review resource workloads.
Adjust resource availability.
Adjust assignments.
Split tasks to reschedule remaining work for when resources have available time.
Level assignments.
Because work (in hours, days, weeks, and so on) is the measure of resource effort on tasks, you can use the baseline value for work to help review how well resources are utilized according to actual and scheduled values. For example, you can see one resource’s baseline work for tasks next to her values for scheduled work, based on actuals she has submitted regarding her progress. Then you can review the variances between the baseline and scheduled work. Work variance is calculated as follows:
(Scheduled/Current) Work – Baseline Work = Work Variance
If actual work values are considerably higher than originally planned, you can anticipate some problems with resource overallocation now or in the near future.
Note
For more information about adjusting assigned work, see Balancing Resource Workloads.
Note
You can use earned value calculations such as the Budgeted Cost of Work Scheduled (BCWS) and Actual Cost of Work Performed (ACWP) earned value fields to analyze project performance based on resource work. For more information, see Chapter 14.
There are two ways to review your overall work totals.
Review project statistics. On the Project tab, in the Properties group, click Project Information, and then click the Statistics button. Under Work, review the current, baseline, actual, and remaining work for the project.
Add the project summary task row. On the Format tab, in the Show/Hide group, select the Project Summary Task check box. Summary totals for task information in the current table are displayed in the project summary task row at the top of the task sheet. If a table containing work information is applied, the project summary task row shows project work totals.
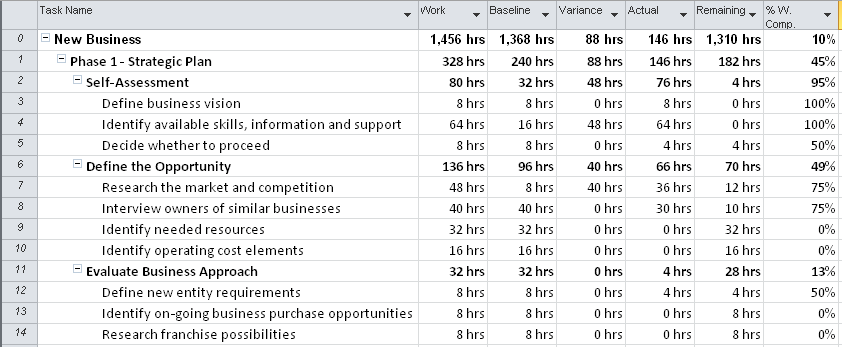
To review the differences between your original baseline work and your currently scheduled work, apply the Work table, as follows:
Display the Gantt Chart or other task sheet.
On the View tab, in the Data group, click Tables, and then click Work.
The Work table is applied to the current view, as shown in Figure 12-20.
With the project summary task row applied, you can also review rolled-up work totals.
You can apply a filter to a task or resource sheet to see only those tasks or resources that have more actual work reported than was planned, as follows:
Display the view and apply the table that contains the information you want to review in the context of overbudget work.
On the View tab, in the Data group, click the arrow in the Filter box, and then click More Filters.
In the More Filters dialog box, click Work Overbudget, and then click Apply or Highlight.
Project 2010 filters for any tasks or resources whose actual work reported is higher than the baseline work.
Review the tasks or resources to analyze the extent of the work overages.
When you finish, show all tasks again.
On the View tab, in the Data group, click the arrow in the Filter box, and then click No Filter. If you used a filter highlight, click the arrow in the Highlight box, and then click No Highlight.
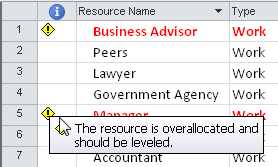
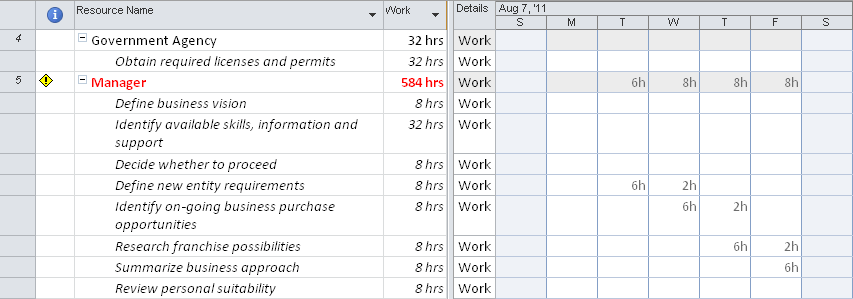
The name of any overallocated resource appears in red in any resource view. In the default Entry table of the Resource Sheet, a leveling indicator is also displayed next to the resource name, recommending that the resource be leveled.
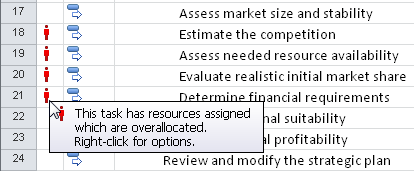
In a task sheet, any task that has an overallocated resource assigned to it displays an overallocated resource icon in the Indicators column.
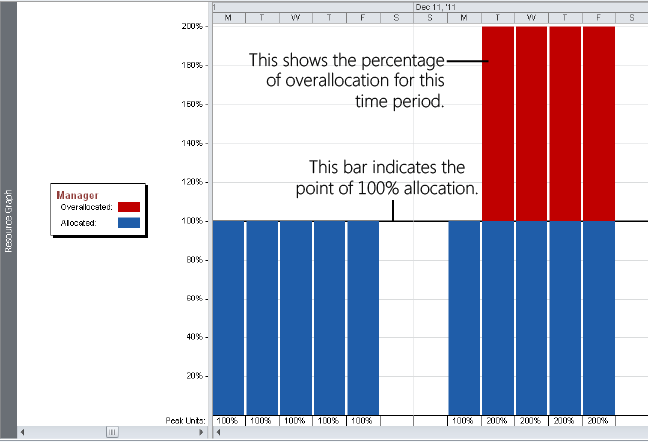
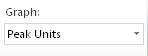
To see the extent of overallocation or underallocation for a resource, use the Resource Graph, as follows:
On the View tab, in the Resource Views group, click Other Views, and then click Resource Graph.
The Resource Graph appears, as shown in Figure 12-21.
Review the allocation for the first resource.
By default, the Resource Graph shows peak units for each time period, including the percentage allocated and the percentage overallocated. You can show different types of information in the Resource Graph. On the Format tab, in the Data group, click the arrow in the Graph box, and then click another type of information (for example, Work or Remaining Availability).
Use the Zoom slider in the lower-right corner of the Project 2010 window to zoom the Resource Graph in or out. Zooming in shows details over a shorter period of time. Zooming out shows information across a longer period of time.
If you prefer, you can also use the zoom buttons on the ribbon. On the View tab, in the Zoom group, click the Zoom button, and then click Zoom In or Zoom Out.
To see information for the next resource, press the Page Down key or click in the horizontal scroll bar in the left pane of the view.
Note
Adding the Resource Graph as the lower pane in a combination view can be very useful in finding resource overallocations.
Inside Out: Relieve the leveling hair-trigger
The leveling indicator often suggests that the resource be leveled on a day-by-day basis because Project 2010 has found that this resource is overallocated by at least one minute over the resource availability for a day.
You might find that level of detail too fine for your purposes. It might be more effective to level resources on a week-by-week basis or a month-by-month basis. Although the overallocation is still detected when a resource is overallocated by just one minute, looking at the entire week or the entire month instead of just one day provides more of a buffer for overallocations to take care of themselves.
To change the leveling trigger, click Resource, Level, Leveling Options. In the box labeled Look For Overallocations On A X Basis, click Week By Week or Month By Month.
You can also see the details about which assignments are causing resource overallocations (or underallocations) by using the Resource Usage view, as follows:
On the View tab, in the Resource Views group, click Resource Usage.
The Resource Usage view appears, as shown in Figure 12-22.
Figure 12-22. The Resource Usage view shows how resources are allocated for each time period as well as the specific assignments that contribute to that allocation.
Any resource whose name appears in red or with a leveling indicator is overallocated.
Review the timesheet area of the view to see where the overallocation occurs.
You might need to scroll to move to a different time period.
Use the Zoom slider in the lower-right corner of the Project 2010 window to zoom the timesheet area in or out.
Review the sheet area of the view to see the assignments for each resource.
You can add the Overallocation field to the timesheet area of the view. The Overallocation field can help you learn by how many hours or days a resource is overallocated. To add the Overallocation field, on the Format tab, in the Details group, select the Overallocation check box.
The Overallocation field is added as a new row in the timesheet area of the Resource Usage view, as shown in Figure 12-23.
To see underallocations or the amount of time that a resource is available for more assignments, add the Remaining Availability field to the timesheet area of the view. On the Format tab, in the Details group, select the Remaining Availability check box.
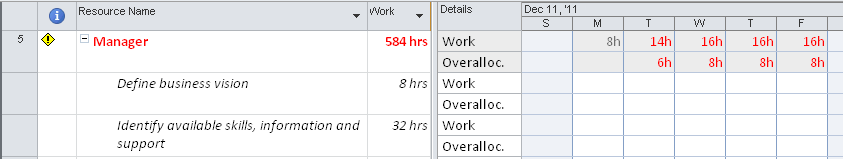
Use the Resource Allocation view to see the Resource Usage view in combination with the Leveling Gantt. This view helps you see which resources are overallocated in conjunction with the tasks that are causing the overallocation. On the View tab, in the Resource Views group, click Other Views, and then click More Views. In the dialog box, click Resource Allocation and then click Apply. Figure 12-24 shows an example of the Resource Allocation view.
Figure 12-24. With the Resource Allocation view, you can see task information in the lower pane for any assignment you click in the Resource Usage view in the upper pane.
With the Summary table applied to a resource view, you can see the Peak field, which can quickly tell you whether resources are allocated to their maximum availability (100%), overallocated (more than 100%), or underallocated (less than 100%). On the View tab, in the Data group, click Tables, and then click Summary. Figure 12-25 shows an example of the Summary table.
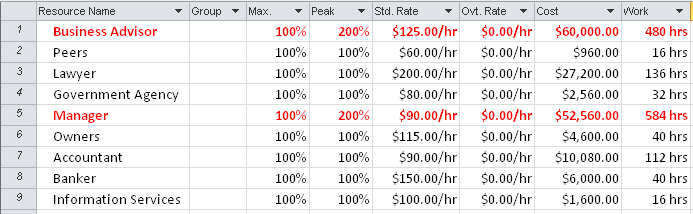
Figure 12-25. By reviewing resources’ Peak fields, you can quickly see how many resources are allocated and whether they’re available to take on more assignments.
The following filters can help you focus on any potential problems with overallocated resources:
Overallocated Resources (see Figure 12-26)
Work Overbudget
Resources/Assignments With Overtime
Slipping Assignments
Figure 12-26. Apply the Overallocated Resources filter to a resource view to quickly see a list of resources who have more work assigned than time available for that work.
With a resource view displayed, apply a filter. On the View tab, in the Data group, click the arrow in the Filter box. Then either click the name of the filter you want in the drop-down menu, or click More Filters and find the filter in the dialog box.
You can also generate and print a report. The following reports provide information about resource usage:
Who Does What
Who Does What When
To-Do List
Overallocated Resources
Task Usage
Resource Usage
Baseline Work Report (visual report in Excel)
Budget Work Report (visual report in Excel)
Resource Availability Report (visual report in Visio)
Resource Remaining Work Report (visual report in Excel)
Resource Status Report (visual report in Visio)
Resource Work Availability Report (visual report in Excel)
Resource Work Summary Report (visual report in Excel)
To run a text-based report about assignments or workloads, click Project, Reports, Reports. Double-click Assignments or Workload, and then double-click the report you want. If a dialog box asks for more, enter the information, and then click OK. The report appears in the Print Backstage view. You can then print the report to study the details.
To run a visual report, follow these steps:
On the Project tab, in the Reports group, click Visual Reports.
On the All tab, double-click the name of the report you want.
Project 2010 data is gathered and the report is built and displayed in Visio or Excel.
Suppose that you reviewed information about assignments and workload throughout your project plan and found that some resources are overallocated and others are underallocated. Or perhaps your company had a reduction in force, and your project staffing was reduced by 15 percent.
If you need to take corrective actions in your project plan to balance the resource workload, you can:
Adjust resource availability.
Adjust assignments by, for example, adding resources, replacing resources, delaying a task or assignment, or specifying overtime.
Split tasks to balance the workload.
Use the Prevent Overallocations feature in the Team Planner to balance the workload.
Use the Project 2010 leveling feature to balance the workload.
Adjust scope (this will probably require stakeholder approval).
Note
For more information about using any of these strategies to better allocate your resources, see Balancing Resource Workloads.
When you adjust your project plan to achieve the resource allocation levels you need, be sure to check the scheduled finish date, costs, and scope. You need to know how your changes affect other areas of the project plan.